How to Improve Profit Margins: The Complete Guide for Distribution and Manufacturing Companies
Learn 12 proven strategies to improve profit margins in distribution and manufacturing. Includes pricing tactics, cost reduction methods, and operational improvements with benchmarks.
Profit margins separate businesses that survive from businesses that thrive. A distribution or manufacturing company operating at 2% net margin has no buffer for downturns, no capital for growth, and no ability to invest in people or systems. A company at 8% net margin can weather disruption, fund expansion, and attract investment.
The gap between 2% and 8% isn't luck or market position. It's execution. McKinsey's research shows that a 1% improvement in price realization translates to an 8% increase in operating profit. That's the highest-leverage improvement opportunity available—far more impactful than increasing volume or cutting costs.
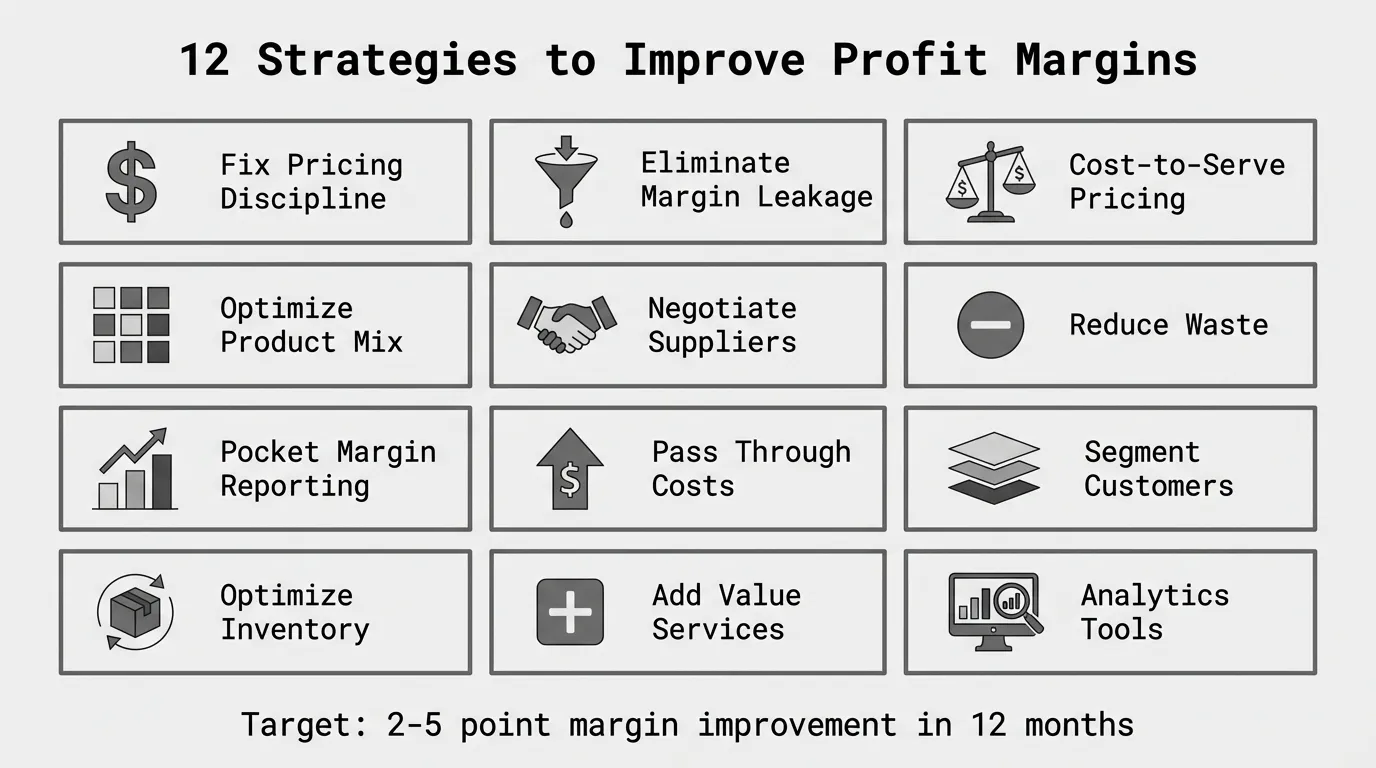
This guide covers 12 proven strategies to improve profit margins for mid-market distribution and manufacturing companies. These tactics work for businesses with $20M to $200M in revenue, 5,000 to 100,000 SKUs, and complex pricing structures that create margin leakage.
We'll cover pricing optimization, cost reduction, operational efficiency, and strategic shifts—with specific benchmarks, formulas, and examples from distribution and manufacturing companies.
Why Profit Margins Matter More Than Revenue
Most businesses chase revenue growth without tracking what it costs to generate that revenue. Revenue is a vanity metric. Margin is survival.
A $50 million distributor with 6% net margin earns $3 million in annual profit. If they grow to $60 million but margin drops to 4% (due to discounting and operational complexity), profit falls to $2.4 million. They grew 20% but lost $600K in profit.
The math:
Scenario 1: $50M × 6% net margin = $3M profit
Scenario 2: $60M × 4% net margin = $2.4M profit
Result: 20% revenue growth, -20% profit decline
This happens because growth often comes from low-margin customers who demand deep discounts, require high service levels, and generate disproportionate operational costs. Volume without margin discipline destroys profitability.
The alternative is margin-focused growth: Grow revenue among high-margin customers, walk away from unprofitable business, and improve margin on retained accounts. A company that grows to $55M at 8% net margin earns $4.4 million—47% more profit than the revenue-focused scenario.
Scenario 3: $55M × 8% net margin = $4.4M profit
Comparison: 10% revenue growth, +47% profit improvement
According to research from McKinsey on net revenue retention in B2B, markets increasingly demand margin expansion and efficient, sustainable growth. Companies that prioritize margin over volume create significantly more value.
The Three Types of Margin Problems
Before implementing margin improvement tactics, diagnose which type of margin problem you're facing. The solutions differ.
1. Margin Leakage (Revenue-Side Problem)
Definition: Profit disappears through pricing gaps, untracked deductions, and unauthorized discounts.
Symptoms:
- Gross margin declining without obvious cause
- Wide margin variance across similar customer-product combinations (10+ point gap)
- Pricing overrides affecting 50%+ of transactions
- Off-invoice deductions (rebates, freight, credits) growing faster than revenue
Primary causes:
- Unauthorized discounts and pricing overrides
- Off-invoice deductions not tracked or allocated to transactions
- Freight absorption without recovery
- Rebate programs where customers don't meet volume commitments
- Credit memos issued without approval workflow
Fix: Process controls, pricing discipline, pocket margin reporting. Margin leakage is the most fixable problem because it's internal. For a complete breakdown, see our margin leakage guide.
2. Margin Erosion (Strategic Problem)
Definition: Margins decline gradually over time due to market forces and internal drift.
Symptoms:
- Margins declining steadily over 2+ years
- Customer pricing established years ago never reviewed or increased
- Competitors undercutting on price
- Failure to pass through cost increases to customers
Primary causes:
- Competitive pressure and price wars
- Customer bargaining power increases
- Failure to raise prices when costs rise
- Product commoditization
- Cost structure drift (operating expenses rising faster than revenue)
Fix: Strategic repricing, cost pass-through, customer segmentation, product differentiation. Margin erosion requires repositioning, not just process fixes. For diagnosis methods, see margin erosion vs. margin leakage.
3. Operational Inefficiency (Cost-Side Problem)
Definition: High cost-to-serve, production waste, and operational complexity erode realized margin.
Symptoms:
- Labor costs rising faster than revenue
- High scrap, rework, or defect rates
- Small orders unprofitable due to handling costs
- Slow-moving inventory tying up capital
- Returns and warranty claims exceeding budget
Primary causes:
- No cost-to-serve analysis by customer or order size
- Scrap and rework exceeding standard allowances
- Inventory carrying costs not allocated to product-level margins
- Manual processes that should be automated
- Quality issues causing returns and warranty claims
Fix: Cost-to-serve pricing, lean operations, inventory optimization, automation. For manufacturing-specific tactics, see how to fix margin leakage in manufacturing.
Most companies face all three problems simultaneously. The key is sequencing. Start with margin leakage (quickest wins), then address pricing strategy (medium-term), then optimize operations (long-term structural improvement).
Margin Improvement Strategy 1: Fix Pricing Discipline
Pricing is the highest-leverage margin improvement tool. McKinsey's research shows a 1% price improvement drives an 8% increase in operating profit—far more than a 1% increase in volume or reduction in costs.
The problem isn't that companies don't know pricing matters. The problem is that pricing discipline breaks down at the transaction level. Standard prices exist, but 50%+ of transactions involve overrides, discounts, and one-off deals that erode margin without approval or tracking.
How to Implement Pricing Discipline
Step 1: Set price floors by product category.
A price floor is the minimum acceptable margin. Configure your ERP or quoting system to flag (or block) transactions below the floor. This eliminates the worst pricing outliers immediately.
Example floors:
- Commodity products: 12% gross margin minimum
- Standard products: 18% gross margin minimum
- Specialty products: 25% gross margin minimum
Step 2: Implement discount approval workflows.
Define discount tiers with corresponding approval levels:
- 0-5% discount: Sales rep approval
- 5-10% discount: Manager approval
- 10-15% discount: VP approval
- 15%+ discount: Executive approval + documented justification
Track every override. Monthly reporting should show override frequency by rep, average override depth, and total margin given away.
Step 3: Audit the top 20% of discount accounts.
Pull your highest-discount customers and review every override from the past 12 months. Confirm each discount has a documented business justification—volume commitment, strategic relationship, competitive bid situation.
In most audits, 10-15% of customers have discounts that drifted well beyond anything justified by volume or relationship. These accounts are pure margin recovery opportunities.
Step 4: Eliminate "loss leader" pricing that doesn't drive volume.
Many companies price certain products below cost to attract customers, assuming those customers will buy higher-margin products too. This works in retail. It rarely works in B2B distribution.
Analyze customer purchase behavior. If a customer buys only the loss leader and nothing else, you're subsidizing them with no offsetting margin. Either raise pricing or walk away from the business.
According to research on pricing strategies for distribution, distributors that implement pricing discipline see immediate margin improvements of 1-3 percentage points within 90 days—with minimal customer churn.
For a complete framework on strategic price increases, see how to raise prices without losing customers.
Margin Improvement Strategy 2: Eliminate Margin Leakage
Margin leakage is profit that disappears between invoice price and actual cash collected. Most companies track invoice margin but miss the off-invoice deductions that happen after the sale: rebates, freight absorption, early payment discounts, credit memos.
McKinsey research found that off-invoice leakages average 16.3% of list price in B2B companies. The gap between invoice margin and pocket margin is where profit hides.
The 7 Sources of Margin Leakage
- Unauthorized discounts and pricing overrides — reps dropping price to close deals without approval
- Off-invoice deductions — rebates, freight, co-op credits, early payment discounts not tracked at the transaction level
- Freight absorption — free shipping thresholds waived, or delivery costs exceeding freight revenue
- Rebate program complexity — customers receiving rebates they don't qualify for, or overlapping rebate programs double-counted
- Contract compliance failures — giving discounts without verifying volume commitments
- Product mix drift — sales shifting toward lower-margin commodity products
- Credit memos and returns — liberal return policies where restocking fees aren't charged
How to Fix Margin Leakage
Build a pocket price waterfall. Track every deduction from list price to actual cash collected. This is the foundational analysis. Without it, you're measuring invoice margin and missing everything that happens afterward.
Example waterfall:
| Step | Line Item | Amount |
|---|---|---|
| 1 | List Price | $100.00 |
| 2 | - Standard Discount | -$15.00 |
| 3 | - Negotiated Discount | -$5.00 |
| 4 | = Invoice Price | $80.00 |
| 5 | - Volume Rebate | -$4.00 |
| 6 | - Early Payment Discount | -$1.60 |
| 7 | - Freight Absorption | -$3.20 |
| 8 | - Co-op/Marketing | -$1.60 |
| 9 | - Credit Memo Adjustments | -$0.80 |
| 10 | = Pocket Price | $68.80 |
Invoice margin looks like 20% ($80 invoice on $100 list). But pocket margin is 31.2% below list price. That 11.2-point gap is where leakage hides.
Audit rebate programs. Review all active rebate agreements. Confirm customers are meeting volume commitments that qualify them for each tier. Claw back or adjust rebates where commitments aren't met.
A $52 million building materials distributor audited their rebate program and found $180K in annual rebates paid to customers who hadn't met volume commitments. The rebates were auto-calculated based on prior-year tiers, not current-year purchases.
Fix freight policy enforcement. If you have a minimum order for free shipping, enforce it. Train customer service to quote freight charges on sub-threshold orders.
A $38 million industrial distributor discovered they were absorbing $400K annually in freight costs that should have been charged to customers. Their policy stated $500 minimum for free shipping, but reps waived it on 60% of orders below threshold.
For detailed detection methods and fix-by-fix implementation, see our complete margin leakage guide.
Margin Improvement Strategy 3: Implement Cost-to-Serve Pricing
Not all customers and orders cost the same to serve. A customer ordering 50 pallets delivered to one dock costs far less than a customer ordering 12 items shipped to 8 locations with expedited freight.
When you use average cost-to-serve instead of actual per-customer calculations, you overprice easy customers (losing them to competitors) and underprice expensive ones (subsidizing their complexity).
How to Calculate Cost-to-Serve
Cost-to-serve includes all costs beyond COGS:
| Cost Category | Distribution Example | Manufacturing Example |
|---|---|---|
| Order processing | $25-75 per order | $50-150 per order |
| Picking and packing | $0.50-2.00 per line item | N/A (production costs) |
| Freight and delivery | Actual cost or $100-500 per shipment | $150-800 per shipment |
| Technical support | $50-200 per hour | $100-300 per hour |
| Returns handling | $15-50 per return + restocking | $75-250 per return |
| Credit and collections | 0.5-2% of order value | 0.5-2% of order value |
| Custom packaging or labeling | Actual cost | Actual cost |
Cost-to-Serve = Order Processing + Picking/Packing + Freight + Support + Returns + Credit + Customization
Example: A customer places 80 orders per year averaging $1,200 each, with 8 line items per order, 2 returns per month, and requires weekly calls with customer service.
- Order processing: 80 orders × $40 = $3,200
- Picking/packing: 80 orders × 8 items × $1 = $640
- Freight: 80 orders × $150 avg = $12,000
- Support: 52 calls × 0.5 hours × $75/hour = $1,950
- Returns: 24 returns × $30 = $720
- Total cost-to-serve: $18,510 annually
If this customer generates $96,000 in annual revenue at 22% gross margin, gross profit is $21,120. After subtracting $18,510 in cost-to-serve, net margin is only $2,610—or 2.7% of revenue.
That customer appears profitable at the invoice margin level (22%) but barely breaks even after accounting for actual service costs.
How to Implement Cost-to-Serve Pricing
Segment customers by cost-to-serve profile:
- Low cost: Large orders, predictable delivery, minimal support, low returns
- Medium cost: Mixed order sizes, standard delivery, occasional support
- High cost: Small orders, custom delivery, frequent support, high returns
Apply tiered pricing based on cost profile:
- Low-cost customers: Standard margin targets
- Medium-cost customers: Add 3-5 points to margin target
- High-cost customers: Add 5-10 points to margin target, or implement minimum order fees
Establish order minimums and surcharges:
- Orders under $500: $50 small order fee
- Custom delivery requirements: Freight charge + $75 handling fee
- Expedited orders (under 24 hours): 15% rush fee
- Technical support beyond standard warranty: $150/hour
According to operational efficiency research, distributors that implement cost-to-serve pricing improve net margins by 2-4 percentage points by eliminating unprofitable transactions and right-sizing pricing for high-service customers.
Margin Improvement Strategy 4: Optimize Product Mix
Product mix determines blended margin. If your sales team defaults to selling the easiest products to move (often the lowest-priced, lowest-margin commodity items), your blended margin will drift downward even if individual product margins stay constant.
How to Analyze Product Mix
Categorize products by margin profile:
| Category | Gross Margin | Volume | Strategy |
|---|---|---|---|
| Stars | 30%+ | High volume | Protect pricing, market aggressively |
| Cash Cows | 25-30% | Medium volume | Maintain, upsell to customers buying commodities |
| Commodities | 10-20% | High volume | Manage tightly, price floors, bundle with higher-margin items |
| Dogs | Under 10% | Low volume | Discontinue or reprice significantly |
Identify high-margin products customers should be buying more of. If a customer buys commodity fasteners at 12% margin but never buys your specialty fasteners at 28% margin, that's a sales opportunity. Train reps to cross-sell and upsell toward higher-margin products.
Discontinue or reprice unprofitable SKUs. Many distributors carry 20,000+ SKUs but generate 80% of revenue from 2,000 SKUs. The long tail often loses money. Run a profitability analysis accounting for inventory carrying costs, shelf space, and handling complexity.
For every SKU below 10% gross margin with under 12 turns per year:
- Option 1: Raise price 15-25%
- Option 2: Discontinue and offer a substitute
- Option 3: Make it special-order-only (no inventory carried)
A $67 million electrical distributor analyzed 18,000 SKUs and found 4,200 items below 10% margin with under 6 turns annually. They discontinued 2,800 SKUs and repriced the remaining 1,400. The result: Blended gross margin improved from 24.1% to 26.3% with no revenue loss—customers bought substitute products or accepted the price increase.
Incentivize sales teams on margin, not just revenue. If reps are compensated solely on revenue, they'll sell whatever closes fastest—usually low-margin commodity products. Change commission structures to reward margin contribution:
Commission = (Revenue × Margin%) × Commission Rate
A rep who sells $100K at 15% margin earns commission on $15K margin contribution. A rep who sells $80K at 30% margin earns commission on $24K margin contribution—60% more comp despite 20% less revenue.
This aligns rep behavior with profitability. According to strategies for profit margin improvement, businesses that shift sales compensation toward margin-based incentives see product mix improvements of 2-4 percentage points within 6 months.
Margin Improvement Strategy 5: Negotiate Better Supplier Terms
Your supplier agreements directly impact your gross margin. A 2% improvement in supplier pricing or payment terms translates to a 2-point gross margin improvement—without changing anything customer-facing.
Supplier Negotiation Tactics
1. Consolidate volume with fewer suppliers. If you're buying similar products from 4 suppliers, consolidate to 2 and negotiate better terms in exchange for increased volume.
Example: A $45 million distributor bought electrical wire from 4 suppliers, averaging $2.8M per supplier annually. They consolidated to 2 suppliers at $5.6M each and negotiated 3.5% better pricing plus extended payment terms (net 60 instead of net 30). The result: $360K annual margin improvement plus $250K cash flow benefit.
2. Negotiate prompt payment discounts. Many suppliers offer 2% discount for payment within 10 days (2/10 net 30 terms). If you have cash flow to take advantage, that's a 36% annualized return.
Annualized Return = (Discount% / (100% - Discount%)) × (365 / (Full Payment Days - Discount Days))
Example: (2% / 98%) × (365 / 20) = 37.2% annualized return
3. Request volume rebates or tiered pricing. If you're a top-10 customer for a supplier, negotiate annual rebates based on volume milestones. Structure rebates to pay quarterly or bi-annually so you capture the benefit faster.
4. Lock in pricing with longer contracts during favorable markets. If commodity prices are low, negotiate 12-24 month fixed pricing. If prices are high and expected to fall, stick with 90-day pricing or index-based pricing tied to spot markets.
5. Push back on unilateral price increases. Suppliers send price increase notices expecting minimal pushback. Negotiate delays, partial increases, or volume commitments in exchange for holding pricing.
Example response: "We can accept a 4% increase instead of 6% if we commit to a 15% volume increase over the next 12 months. Does that work?"
According to cost management research, businesses that actively negotiate supplier terms recover 1-3% of COGS annually—translating to 1-3 point gross margin improvements without raising customer prices.
Margin Improvement Strategy 6: Reduce Operational Waste
Operational inefficiencies erode margin by increasing the cost to deliver products or services. These costs often don't show up in margin analysis because they're buried in overhead.
For Distributors: Reduce Fulfillment Costs
Optimize warehouse layout to reduce pick time. Fast-moving SKUs should be closest to packing stations. Slow-moving items can be in back zones. Every second saved per pick compounds across thousands of orders.
A $55 million distributor redesigned warehouse zones based on pick frequency. Average pick time dropped from 2.8 minutes per line item to 1.9 minutes. With 180,000 line items picked annually, that saved 2,700 labor hours—equivalent to $75K in annual labor cost savings.
Automate order processing and invoicing. Manual data entry for orders, POs, and invoices introduces errors and requires labor. EDI (electronic data interchange) integration with major customers eliminates this overhead.
Reduce returns through better order accuracy. Returns cost $15-50 per incident in handling, restocking, and lost margin. Root causes include mis-picks, incorrect product descriptions, and customers ordering the wrong item.
Implement barcode scanning for picking, require photo confirmation for custom orders, and add product selectors to your e-commerce site to reduce ordering errors.
For Manufacturers: Reduce Production Waste
Track all-in scrap rates. Standard cost accounting often assumes 2-3% scrap. Actual scrap, when including rework, material waste, and defects caught at final inspection, is often 6-12%. That difference is pure margin loss.
A $28 million fabricator tracked standard scrap at 6.8% but actual scrap (including rework and quality failures) was 11.2%. The 4.4-point gap represented $320K in annual leaked margin.
Optimize setup and changeover times. For low-volume, high-mix manufacturers, setup time is a major cost driver. Reducing setup from 45 minutes to 20 minutes allows more production runs per shift and lowers cost per unit.
Implement preventive maintenance schedules. Unplanned downtime costs far more than planned maintenance. A machine failure that halts production for 8 hours costs thousands in lost throughput, rush fees, and expedited freight to recover.
Standardize BOMs and reduce part proliferation. If you have 15 slightly different variants of the same component across multiple products, you're carrying 15× the inventory and complexity. Standardize to 3-5 variants.
According to manufacturing margin improvement research, manufacturers that implement lean operations and waste reduction see 2-4 percentage point margin improvements through lower production costs and higher throughput.
Margin Improvement Strategy 7: Implement Pocket Margin Reporting
Most companies measure invoice margin—the margin calculated from invoice price. This misses everything that happens after the invoice: rebates, freight costs, payment term discounts, credit memos.
Pocket margin is the actual cash collected after all deductions. The gap between invoice margin and pocket margin is where profit hides.
How to Build Pocket Margin Reporting
You need data from multiple systems:
- ERP/order management: Invoices, discounts, pricing
- Accounting: Credit memos, rebate accruals, payment term deductions
- Logistics: Actual freight costs vs. freight charged
- CRM/contracts: Negotiated terms, volume commitments
Step 1: Map every deduction from list price to pocket price.
For each transaction, calculate:
Pocket Price = Invoice Price - Volume Rebates - Freight Absorption - Payment Term Discounts - Co-op Credits - Credit Memos
Pocket Margin = (Pocket Price - COGS) / Pocket Price × 100
Step 2: Segment pocket margin by customer, product, and channel.
Calculate pocket margin for:
- Each customer (or customer segment)
- Each product (or product category)
- Each sales rep
- Each channel (direct, distributor, retail)
Then look for unexplained variance. If two similar customers buying the same products show a 12-point pocket margin difference, you've found leakage.
Step 3: Track invoice-to-pocket gap as a KPI.
The invoice-to-pocket gap reveals how much margin disappears after the invoice:
Invoice-to-Pocket Gap = Invoice Margin% - Pocket Margin%
Benchmarks:
- Elite distributors: Under 3 points
- Average distributors: 6-10 points
- Poor margin management: 10+ points
If your gap exceeds 8 points, you have significant leakage worth investigating.
Step 4: Make pocket margin your primary profitability metric.
Replace invoice margin with pocket margin in:
- Monthly financial reporting
- Sales rep dashboards
- Customer profitability analysis
- Product profitability analysis
This shifts the entire organization from optimizing invoice margin (which doesn't reflect reality) to optimizing pocket margin (which determines actual cash collected).
A $72 million HVAC distributor moved to pocket margin reporting and discovered their average invoice margin of 26.3% was actually 18.1% pocket margin. The 8.2-point gap represented $5.9 million in annual margin leakage. Fixing the leakage recovered $1.8 million in margin within 12 months.
Margin Improvement Strategy 8: Pass Through Cost Increases
When input costs rise, not all companies pass those increases through to customers. Bain research found that only 55% of B2B companies fully passed through cost increases during inflationary periods. The 45% that didn't absorbed the cost increase as margin loss.
How to Pass Through Cost Increases
1. Add cost escalation clauses to contracts.
For any contract longer than 12 months, include material and labor cost escalation triggers tied to industry indices:
- Material costs: Producer Price Index (PPI) for your industry
- Labor costs: Employment Cost Index (ECI)
- Freight costs: Diesel fuel surcharge index
Example clause: "Pricing will adjust annually based on changes in the PPI for industrial distribution. If the index increases more than 3% in any 12-month period, pricing will increase proportionally effective 60 days after notification."
2. Implement surcharges for volatile costs.
Instead of raising base prices, add a temporary surcharge tied to the specific cost input:
- Fuel surcharge (common in distribution and logistics)
- Steel surcharge (for metal fabrication)
- Resin surcharge (for plastic manufacturers)
Surcharges are easier to implement than base price increases because they're positioned as temporary and tied to external factors. When costs normalize, you can remove the surcharge—but keep base pricing intact.
3. Communicate price increases 60-90 days in advance.
Don't surprise customers with sudden price increases. Give them 60-90 days notice with a clear explanation of why costs are rising. Transparency builds trust and reduces churn.
Example email structure:
- Why: "Steel costs have increased 18% over the past year due to tariffs and supply chain disruptions."
- What: "Effective July 1, pricing will increase by 8%."
- Options: "Lock in current pricing through December by signing a 12-month contract before May 1."
4. Raise prices annually, not reactively.
Annual price increases create customer expectations and prevent the need for large, shocking increases. A 4% annual increase is easier to absorb than a 15% increase after 4 years of no changes.
According to B2B pricing strategy research, companies with standardized annual pricing reviews retain 90%+ of customers through price increases, compared to 70-80% retention for companies that raise prices reactively and inconsistently.
For a complete framework on communicating price increases, see how to raise prices without losing customers.
Margin Improvement Strategy 9: Segment Customers by Profitability
Not all customers are equally profitable. The 80/20 rule applies: 20% of customers generate 80% of profit, while the bottom 20% of customers often destroy value.
How to Segment Customers by Profitability
Step 1: Calculate pocket margin by customer.
For each customer, calculate:
Customer Profitability = (Total Revenue × Pocket Margin%) - Cost-to-Serve
This reveals which customers are genuinely profitable after accounting for all deductions and service costs.
Step 2: Categorize customers into profitability tiers.
| Tier | Characteristics | Action |
|---|---|---|
| Tier 1: High-profit | High volume, high margin, low cost-to-serve | Protect pricing, invest in relationship |
| Tier 2: Good-profit | Medium volume, medium margin, medium cost-to-serve | Maintain, look for upsell opportunities |
| Tier 3: Low-profit | Low margin or high cost-to-serve | Reprice, reduce service costs, or walk away |
| Tier 4: Unprofitable | Negative profitability after cost-to-serve | Reprice significantly or exit |
Step 3: Differentiate strategy by tier.
Tier 1 customers: These are your best customers. Give them account management, preferential service, early access to new products, and pricing stability. Don't risk losing them by chasing Tier 3 volume.
Tier 2 customers: Standard service model. Look for opportunities to shift them into Tier 1 through volume growth or product mix improvements.
Tier 3 customers: These customers are marginally profitable or unprofitable due to low margin, high service demands, or both. Options:
- Raise pricing 10-20%
- Implement order minimums or surcharges
- Reduce service levels (move from dedicated account manager to shared support)
Tier 4 customers: Unprofitable after cost-to-serve. Either reprice dramatically (50%+ increase) or walk away. Losing an unprofitable customer improves your overall profitability.
Step 4: Walk away from unprofitable business.
This is the hardest decision for most businesses. Revenue feels good. Turning down orders feels wrong. But unprofitable revenue is worse than no revenue—it consumes cash, ties up resources, and prevents you from serving profitable customers better.
Example: A $62 million industrial distributor identified 80 customers (12% of customer base) that generated $4.2M in revenue at negative profitability. These customers demanded deep discounts, placed small orders, required custom delivery, and generated high returns.
They offered these customers a 25% price increase. 60% of the customers left. 40% accepted the increase. The result: Lost $2.5M in revenue but improved net margin from 3.8% to 5.6%—adding $750K to annual profit despite lower revenue.
Margin Improvement Strategy 10: Improve Inventory Management
For distributors and manufacturers, inventory is a major capital cost. Carrying costs (warehousing, insurance, obsolescence, and capital tied up) typically run 15-25% of inventory value annually.
Poor inventory management erodes margin in three ways:
- Carrying costs reduce profitability on slow-moving inventory
- Stockouts force expedited freight and emergency purchasing at premium prices
- Obsolete inventory must be written off or sold at a loss
How to Optimize Inventory
Implement ABC analysis. Categorize SKUs by revenue contribution:
- A items: Top 20% of SKUs generating 80% of revenue → tight inventory control, frequent replenishment
- B items: Middle 30% of SKUs generating 15% of revenue → moderate inventory levels
- C items: Bottom 50% of SKUs generating 5% of revenue → minimal inventory, make-to-order or special-order-only
Set target inventory turns by category.
| Category | Target Turns | Strategy |
|---|---|---|
| A items (fast-movers) | 12-20 turns/year | High service levels, frequent orders |
| B items (medium-movers) | 6-12 turns/year | Balanced approach |
| C items (slow-movers) | 2-6 turns/year | Minimal inventory, longer lead times acceptable |
Reduce slow-moving and dead stock. Any SKU with under 2 turns annually is tying up capital. Options:
- Discount heavily to move inventory (even at a loss—freeing capital is worth it)
- Return to supplier for credit
- Liquidate through secondary channels
- Write off and dispose
A $48 million building materials distributor identified $850K in slow-moving inventory (under 2 turns). They ran a clearance sale, returned $200K to suppliers, and liquidated $150K through secondary channels. Total recovery: $520K. They reinvested that capital in fast-moving A items, improving blended inventory turns from 5.2 to 6.8.
Implement vendor-managed inventory (VMI) for key suppliers. VMI shifts inventory responsibility to the supplier. They monitor your usage and replenish automatically. This reduces your carrying costs and improves turns.
According to inventory optimization research, businesses that optimize inventory management improve cash flow by 10-20% and reduce carrying costs by 2-4% of revenue—translating to 1-2 point margin improvements.
Margin Improvement Strategy 11: Add Value-Added Services
Competing on price in commodity markets erodes margin. The alternative is to differentiate through value-added services that justify premium pricing.
Value-Added Services for Distribution
Vendor-managed inventory (VMI). You manage inventory at the customer's facility, replenishing automatically based on usage. Customers pay a premium for the convenience and reduced stockout risk.
Kitting and sub-assembly. Instead of selling individual components, assemble them into kits or pre-built sub-assemblies. A customer buying a kit pays more than buying individual parts, and you capture the assembly labor margin.
Technical support and training. Offer product selection guides, installation training, troubleshooting support, or on-site technical assistance. Customers with complex applications will pay a premium for expertise.
Custom packaging and labeling. Repackage products in customer-specific quantities or with custom labels. This differentiates you from competitors selling standard packaging.
Consignment inventory. Place inventory at the customer's site but retain ownership until used. You charge a premium for the consignment service, and the customer gets zero inventory carrying cost.
Value-Added Services for Manufacturing
Design and engineering services. Offer design for manufacturability (DFM) reviews, prototyping, and engineering support. Customers pay for the expertise, and you build stickier relationships.
Vendor-managed inventory (VMI). Maintain inventory at the customer's facility and replenish based on usage forecasts.
Kitting and sub-assembly. Deliver pre-assembled components rather than individual parts, allowing customers to reduce their own assembly labor.
Quality certifications and testing. Provide certified test reports, material traceability, and compliance documentation. Customers in regulated industries (aerospace, medical devices) will pay a premium for documented quality.
Just-in-time (JIT) delivery. Deliver in precise quantities and timing to match the customer's production schedule. This reduces their inventory carrying costs and earns you a premium.
A $34 million contract manufacturer added design for manufacturability (DFM) reviews as a paid service—$2,500 per project. They completed 48 DFM projects in the first year, generating $120K in high-margin service revenue. More importantly, 75% of DFM customers placed manufacturing orders, creating $4.2M in production revenue.
According to strategies for improving profit margins, businesses that add value-added services see 3-8 point margin improvements by differentiating beyond commodity pricing.
Margin Improvement Strategy 12: Invest in Pricing and Margin Analytics
You can't manage what you don't measure. Most distribution and manufacturing companies operate on gut feel and spreadsheet analysis that's weeks out of date.
Investing in pricing and margin analytics provides:
- Real-time visibility into pocket margin by customer, product, and transaction
- Automated detection of margin leakage (pricing variance, unauthorized discounts, rebate compliance)
- Customer profitability segmentation
- Product profitability analysis
- Pricing optimization recommendations
What Good Pricing Analytics Looks Like
Transaction-level margin visibility. See pocket margin (after all deductions) for every transaction, not just invoice margin.
Customer profitability dashboards. Rank customers by profitability after accounting for cost-to-serve. Identify which customers are unprofitable and why.
Product profitability analysis. Calculate true product margin accounting for inventory carrying costs, handling complexity, and returns.
Pricing variance alerts. Flag transactions that fall below price floors or exceed discount thresholds.
Rebate compliance tracking. Monitor whether customers are meeting volume commitments that qualify them for rebates.
Most ERPs don't provide these capabilities out of the box. You need either custom reporting (expensive, slow to build) or a specialized pricing analytics tool.
Pryse provides instant pocket margin analysis by uploading transaction data. Upload your ERP export and see margin leakage by customer, product, and transaction in 24 hours—without a 6-month implementation or $100K software license.
Margin Improvement Benchmarks
Use these benchmarks to gauge where you stand and set realistic targets:
Distribution Benchmarks
| Metric | Below Average | Average | Above Average | Elite |
|---|---|---|---|---|
| Gross margin | Under 20% | 20-25% | 25-30% | 30%+ |
| Pocket margin | Under 14% | 14-18% | 18-22% | 22%+ |
| Net profit margin | Under 2% | 2-4% | 4-6% | 6-10% |
| Invoice-to-pocket gap | 10+ points | 6-10 points | 3-6 points | Under 3 points |
| Override frequency | 60%+ | 40-60% | 20-40% | Under 20% |
Manufacturing Benchmarks
| Metric | Below Average | Average | Above Average | Elite |
|---|---|---|---|---|
| Gross margin | Under 25% | 25-35% | 35-40% | 40%+ |
| Net profit margin | Under 5% | 5-8% | 8-12% | 12%+ |
| Scrap rate (all-in) | 10%+ | 6-10% | 3-6% | Under 3% |
| Standard cost variance | 8%+ | 4-8% | 2-4% | Under 2% |
Margin Improvement Potential
| Starting Point | Realistic Improvement | Timeline |
|---|---|---|
| 2% net margin | Improve to 4-6% | 12-18 months |
| 4% net margin | Improve to 6-8% | 12-18 months |
| 6% net margin | Improve to 8-10% | 12-24 months |
Most distribution and manufacturing companies can improve net margins by 2-5 percentage points through focused margin management. The gain depends on your starting point and how many improvement levers you activate.
The 90-Day Margin Improvement Plan
If you need to improve margins quickly, here's a 90-day action plan:
Days 1-30: Analysis and Diagnosis
- Calculate pocket margin by customer, product, and channel
- Identify margin leakage sources (pricing overrides, freight absorption, rebate compliance)
- Segment customers by profitability (Tier 1-4)
- Analyze product mix and identify high-margin products to promote
- Benchmark your margins against industry standards
Days 31-60: Quick Wins Implementation
- Set price floors by product category (blocks worst outliers)
- Audit top 20% of discount accounts (recover unjustified discounts)
- Fix freight policy enforcement (stop absorbing freight on sub-threshold orders)
- Audit rebate programs (confirm customers meet volume commitments)
- Implement discount approval workflows (require manager approval for 10%+ discounts)
Expected impact: 1-2 percentage points net margin improvement within 60 days.
Days 61-90: Structural Changes
- Build pocket margin reporting (consolidate data from ERP, accounting, logistics)
- Implement cost-to-serve pricing (segment customers by service costs, adjust pricing)
- Add cost escalation clauses to new contracts (protect against future cost increases)
- Shift sales compensation to margin-based incentives (align rep behavior with profitability)
- Exit unprofitable customers (offer price increases or walk away)
Expected impact: Additional 1-2 percentage points net margin improvement by day 90.
Day 91+: Ongoing Margin Management
- Monthly margin reviews by product category and customer segment
- Quarterly deep dives on margin leakage trends
- Annual full margin audits
- Annual price increases tied to cost inflation indices
- Continuous optimization of product mix, inventory, and operations
Common Mistakes to Avoid
Here are the ways businesses sabotage margin improvement:
1. Chasing revenue without tracking profitability. Revenue growth that comes from low-margin customers destroys profitability. Measure margin on every new customer and order.
2. Failing to track pocket margin. If you only measure invoice margin, you're missing 30-50% of the margin story. Track pocket margin (after all deductions) to see reality.
3. Tolerating pricing discipline breakdowns. If 60% of transactions have pricing overrides without approval, you've lost control of margin. Implement price floors and approval workflows.
4. Not walking away from unprofitable business. Losing an unprofitable customer improves your profitability. Don't cling to revenue that destroys margin.
5. Absorbing cost increases instead of passing them through. If your costs rise 10% over two years but you don't raise prices, you've lost 10 points of margin. Pass through cost increases within 90 days.
6. Implementing changes without measuring results. Track margin improvement metrics monthly. If a tactic isn't delivering results within 90 days, adjust or move on.
Where to Start
If you need to improve margins, here's the priority sequence:
Week 1: Analysis
- Calculate pocket margin by customer, product, and channel
- Identify which customers and products are below target margin
- Quantify margin leakage (invoice-to-pocket gap)
- Benchmark against industry standards
Weeks 2-4: Quick Wins
- Implement price floors by product category
- Audit top 20% of discount accounts
- Fix freight policy enforcement
- Audit rebate programs
Expected gain: 1-2 points net margin improvement within 30 days.
Months 2-3: Structural Changes
- Build pocket margin reporting
- Implement cost-to-serve pricing
- Segment customers by profitability
- Add cost escalation clauses to contracts
Expected gain: Additional 1-2 points net margin improvement by month 3.
Months 4-12: Optimization
- Optimize product mix toward high-margin items
- Negotiate better supplier terms
- Reduce operational waste
- Add value-added services
Expected gain: Additional 1-2 points net margin improvement by month 12.
Total potential: 3-6 point net margin improvement within 12 months for most distribution and manufacturing companies.
For businesses analyzing pricing and margin across thousands of transactions, the bottleneck is usually visibility. You know margins should be better, but identifying where you have pricing power requires transaction-level analysis that takes weeks in Excel.
Pryse provides instant margin analysis. Upload your transaction data and see pocket margin by customer, product, and transaction in 24 hours. Find your margin leakage and pricing opportunities without a 6-month implementation.
For related margin improvement tactics, see:
- How to raise prices without losing customers
- Margin leakage: Complete detection and prevention guide
- How to increase profit margin in service businesses
Sources
- Vendavo: How to Improve Profit Margin in B2B
- Phocas: Five ways to increase profit margins in distribution
- K38 Consulting: Improve Profit Margins: Small Business Strategies for 2026
- BDC: How to improve your profit margin
- Cash Flow Frog: How to Improve Profit Margin—Simple Tactics That Work
- Snowball Creations: How to Improve Profit Margins in eCommerce & B2B
- Expense to Profit: How to Improve Profit Margins in the Manufacturing Sector
- McKinsey: The net revenue retention advantage: Driving success in B2B tech
Last updated: February 24, 2026
Related Articles
Frequently Asked Questions

Want to analyze your entire product catalog?
Pryse automatically identifies margin leakage across thousands of SKUs. Upload your data and find hidden profit in 24 hours.
One-time $1,499 diagnostic. No subscription required.