Margin Erosion vs. Margin Leakage: What's Actually Different and Why It Matters
Margin erosion is gradual profit decline from market forces. Margin leakage is preventable loss from pricing gaps. Learn the differences and which to fix first.
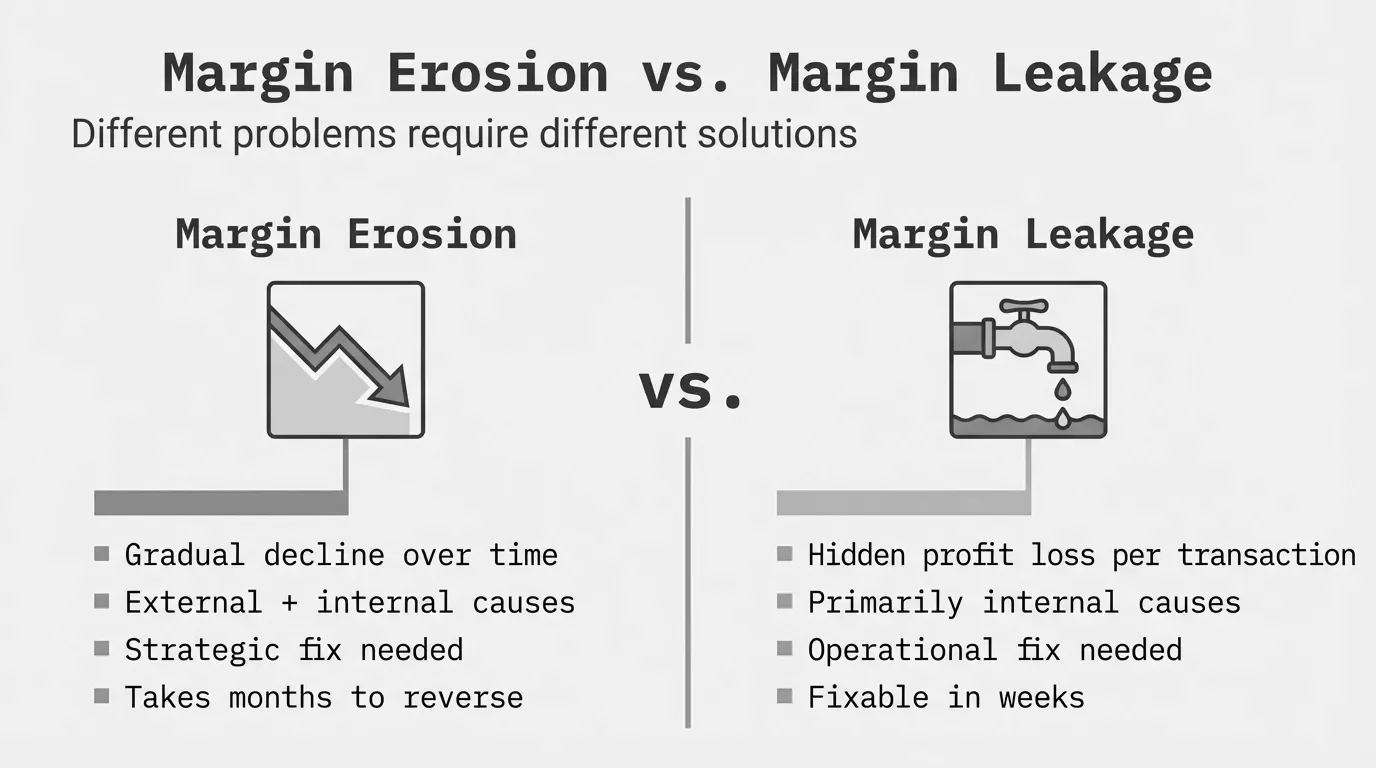
Margin erosion is the gradual decline in a company's profit margins over time, driven by forces that compress the gap between costs and selling prices. Margin leakage is the preventable, often hidden loss of profit from internal pricing errors, unauthorized discounts, and operational breakdowns.
People use these terms interchangeably. That's a problem, because the causes are different, the fixes are different, and confusing the two means you'll spend money solving the wrong thing.
If your margins have been sliding for three years and you blame "the market," you might be right. That's erosion. But if 40% of your sales reps are giving discounts beyond their authority and nobody catches it until quarter-end, that's leakage. The distinction matters because leakage is fixable in weeks. Erosion takes a strategy overhaul.
This post breaks down both terms with real numbers, shows you exactly where they overlap and diverge, and gives you a framework for figuring out which one is eating your profits.
Margin Erosion: Definition and How It Works
Margin erosion is the structural, gradual decline of profitability. It happens when costs rise faster than prices, or when competitive pressure forces prices down while costs stay flat.
Margin Erosion Rate = (Previous Margin % - Current Margin %) / Previous Margin % x 100Here's what erosion looks like in practice.
A building materials distributor carries 8,000 SKUs. In 2023, their blended gross margin was 26%. By 2025, it's 22%. Nothing "broke." No single event caused it. But over 24 months:
- Lumber and steel costs climbed 12%, and the company only passed through 7% in price increases
- Two regional competitors entered the market and undercut pricing on high-volume SKUs
- Their largest customer (14% of revenue) renegotiated terms and pushed for an additional 2% discount
Each factor shaved half a point or a full point off margin. Together, they moved the needle from 26% to 22%. That 4-point drop on $60M in revenue is $2.4M in gross profit gone.
That's erosion. It's gradual. It's often external. And it doesn't show up as a single line item you can point to.
What Causes Margin Erosion
Erosion comes from forces that are often outside your direct control, or at least outside your immediate operational decisions:
Rising input costs. Raw materials, freight, energy, labor. When your cost of goods increases and you don't adjust pricing to match, the margin gap shrinks. Manufacturing companies dealing with volatile commodity prices (steel, aluminum, resins) know this well. A 10% jump in material costs with only a 6% price increase means 4 points of erosion.
Competitive pressure. When a competitor drops prices, you feel the pull to match. This is especially common in commodity distribution where products are interchangeable. One player starts a price war on fasteners or electrical supplies, and suddenly the whole market resets 3-5% lower.
Customer concentration. If your top 5 customers represent 40%+ of revenue, they have leverage. Annual renegotiations become a one-way ratchet: they push for better pricing, extended payment terms, free freight, and rebate adjustments. Each concession is small. Together, they compound.
Channel and market shifts. E-commerce disrupted distributor margins across multiple verticals. When customers can price-compare in seconds, your pricing power erodes. Amazon Business entering B2B distribution put pressure on distributors who previously competed on relationships alone.
Failure to adjust pricing. This one is partially internal, partially external. Many distributors review pricing annually. In a period of rising costs, an annual review means you're eating 11 months of cost increases before adjusting. The erosion accumulates between reviews.
Margin Erosion Formula and Measurement
You can measure erosion at the company level, product level, or customer level. The formula stays the same:
Erosion Amount ($) = Revenue x (Previous Margin % - Current Margin %)For a more granular view, track margin by period:
| Period | Revenue | COGS | Gross Margin | Margin % | Change |
|---|---|---|---|---|---|
| Q1 2025 | $15.2M | $11.1M | $4.1M | 27.0% | -- |
| Q2 2025 | $15.8M | $11.8M | $4.0M | 25.3% | -1.7 pts |
| Q3 2025 | $14.9M | $11.3M | $3.6M | 24.2% | -1.1 pts |
| Q4 2025 | $16.1M | $12.4M | $3.7M | 23.0% | -1.2 pts |
Notice what happened in Q2: revenue went up but gross profit went down. That's the signature of erosion. You're selling more but keeping less. Over the year, margin dropped from 27% to 23%. On roughly $62M in annual revenue, that's $2.5M in lost gross profit.
The warning signs are consistent margin percentage decline across multiple quarters, COGS growing faster than revenue, and pricing concessions that never get clawed back.
Margin Leakage: Definition and How It Works
Margin leakage is the profit you should have captured but didn't, because of preventable internal failures. It's the gap between your intended margin and your actual margin on individual transactions.
Margin Leakage = Intended Margin - Actual Realized MarginThe defining characteristic of leakage: it's fixable. It happens because of process gaps, lack of controls, human error, or poor visibility into transaction-level data.
Here's a real scenario. An industrial distributor has a published price list and a discount matrix. List price for a hydraulic fitting is $47.50. The approved discount for a mid-tier customer is 15%, putting the target sell price at $40.38.
But the sales rep quotes $36.00 because the customer said they got a better price from a competitor. The rep's manager approves it verbally without checking the discount matrix. The order ships. The actual margin on that fitting drops from 34% to 22%.
Multiply that across 200 similar transactions per month, and you've got $85,000 in annual leakage on a single product category.
Nobody planned for that lower margin. It wasn't a strategic decision to lower prices in response to competitive pressure. It was a process failure. That's leakage.
For a deeper breakdown of how leakage works and how to find it, see our margin leakage guide.
What Causes Margin Leakage
Leakage sources are internal. They come from your own operations, your own people, and your own systems:
Unauthorized discounting. Sales reps giving discounts beyond their authority, or applying discounts that expired, or stacking discounts that weren't meant to combine. This is the single largest source of leakage in most distribution companies. Without guardrails, reps default to whatever discount gets the deal closed.
Pricing errors in the system. Wrong prices loaded into the ERP. Outdated cost data that doesn't reflect recent supplier increases. Price list updates that didn't propagate to all channels. When you're managing 10,000+ SKUs across multiple customer tiers, a 2% error rate means 200 SKUs are mispriced at any given time.
Rebate and incentive mismanagement. You negotiate a 3% rebate with a supplier but only claim 2.4% because your tracking is manual and some qualifying purchases slip through. Or you offer customer rebates based on volume tiers, but your system doesn't automatically adjust when a customer drops below threshold.
Off-invoice deductions. Customers take deductions for early payment, freight allowances, or co-op marketing, and some of those deductions aren't valid. But if nobody audits them, the money's gone.
Cost-to-serve blindness. You offer free next-day delivery to a customer whose orders average $150. The delivery costs $45. Your gross margin on the sale might be 28%, but after cost-to-serve you're at 11%. That hidden cost is leakage because you're not pricing for it.
Manual processes and spreadsheets. McKinsey research indicates B2B companies lose up to 4% of revenue to various forms of leakage. A huge portion of that traces back to manual pricing processes where spreadsheets, email approvals, and disconnected systems create gaps.
How to Measure Margin Leakage
Leakage is best measured at the transaction level, not the aggregate level. You need to compare what you intended to charge versus what you actually charged:
Leakage Rate = (Target Sell Price - Actual Sell Price) / Target Sell Price x 100A price waterfall analysis is the best tool for finding leakage. It shows you exactly where dollars fall off between list price and the pocket price you actually collect.
| Step | Amount | % of List |
|---|---|---|
| List Price | $100.00 | 100% |
| Standard Discount | -$15.00 | 85% |
| Volume Discount | -$5.00 | 80% |
| Promotional Discount | -$3.00 | 77% |
| Invoice Price | $77.00 | 77% |
| Freight Allowance | -$4.00 | 73% |
| Payment Terms Discount | -$1.50 | 71.5% |
| Rebate | -$2.50 | 69% |
| Pocket Price | $69.00 | 69% |
In this example, 31% of the list price never reaches your pocket. Some of that is intentional (standard discount, volume discount). But $3 in promotional discounts on a product where the promo ended last quarter? That's leakage. A freight allowance for a customer who picks up at your warehouse? Leakage. A rebate paid to a customer who didn't hit their volume tier? Leakage.
Margin Erosion vs. Margin Leakage: The Key Differences
The two terms share a symptom (lower margins) but differ in cause, visibility, speed, and fix.
| Dimension | Margin Erosion | Margin Leakage |
|---|---|---|
| Definition | Structural decline in margins over time | Preventable, hidden profit loss on transactions |
| Primary Cause | External market forces, cost increases | Internal process failures, pricing errors |
| Speed | Gradual (quarters/years) | Ongoing (every transaction) |
| Visibility | Visible in aggregate reporting | Hidden until you analyze transaction-level data |
| Intentionality | Often a known trade-off | Usually unintentional |
| Scope | Affects entire product lines or company | Affects specific transactions, customers, or SKUs |
| Example | Steel costs up 15%, prices only raised 8% | Rep gave 22% discount when max authorized was 15% |
| Fix | Strategic: pricing model, product mix, market repositioning | Tactical: controls, audits, pricing tools, guardrails |
| Time to Fix | Months to years | Weeks to months |
| Who Owns It | Leadership, pricing strategy, finance | Sales ops, pricing team, finance |
Here's the simplest way to think about it: erosion is when the market takes your margin. Leakage is when you give it away.
How They Overlap (and Why People Confuse Them)
In practice, erosion and leakage feed each other. They overlap in three ways.
Erosion creates conditions for leakage. When margins are under pressure from rising costs, sales teams feel that pressure. They discount more aggressively to win deals. Management, already worried about revenue, loosens discount controls. What started as erosion (external cost pressure) now creates leakage (unauthorized discounting). The two blend together in the P&L.
Leakage that goes unchecked becomes structural. If reps have been giving 20% discounts for two years when the matrix says 15%, that 20% becomes the de facto price. Customers now expect it. At that point, is it leakage or erosion? Technically it started as leakage, but once it's baked into customer expectations, fixing it feels like a price increase. The leakage hardened into erosion.
Both show up the same way in high-level reporting. If your gross margin dropped 3 points this year, your income statement won't tell you whether it came from cost increases (erosion) or discount overruns (leakage). You need transaction-level data to separate them. Most companies operating in Excel don't have that visibility, which is why the two get lumped together.
The practical question isn't "which one do I have?" Most mid-market distributors and manufacturers have both. The question is "how much of my margin decline is fixable right now?" Because the leakage portion is fixable. The erosion portion requires longer-term strategic work.
Real-World Examples in Distribution and Manufacturing
Example 1: Erosion in Electrical Distribution
A $45M electrical distributor saw gross margins decline from 24.5% to 21.2% over three years. The causes:
- Copper prices increased 18% between 2023 and 2025
- The company passed through 11% in price increases (7% gap absorbed)
- A national competitor opened a branch 20 miles away and underpriced on commodity wire and conduit
- Two large contractor accounts demanded annual rebates of 1.5% that didn't exist before
None of these were process failures. They were market realities. The fix required repositioning: shifting product mix toward higher-margin lighting controls, adding value-added services (cut-to-length, kitting), and implementing cost-plus pricing for volatile commodity items.
Example 2: Leakage in HVAC Parts Distribution
A $70M HVAC parts distributor had a 26% gross margin that should have been 29% based on their pricing matrix. A transaction-level margin analysis uncovered:
- 34% of invoices had discounts exceeding the authorized tier for that customer
- Promotional pricing on seasonal items (refrigerant, filters) was still applied 3 months after promotions ended
- Freight charges were waived on 22% of orders under $200, against company policy
- Price updates from a major supplier (implemented March 1) weren't loaded into the ERP until April 15, resulting in 6 weeks of underpriced sales
The 3-point gap represented roughly $2.1M in annual profit that was recoverable without changing a single customer relationship or market position. The fixes were operational: tightening discount approvals, automating promotional price expiration, enforcing minimum order thresholds for free freight, and building a process for same-week cost updates.
Example 3: Both at Once in Industrial Fastener Manufacturing
A $90M fastener manufacturer experienced margin erosion AND leakage simultaneously:
Erosion (1.8 points): Steel costs rose 14%. Import competition from Southeast Asian manufacturers increased. Two automotive OEM customers consolidated purchasing and demanded lower pricing across all SKUs.
Leakage (2.3 points): The quoting process relied on spreadsheets. Sales engineers built custom quotes with outdated material costs. Volume discount thresholds hadn't been recalculated in 18 months. Customer-specific pricing agreements existed in PDFs that weren't linked to the ERP.
Total margin decline: 4.1 points. But 2.3 of those points were immediately recoverable through better pricing controls and data management. The remaining 1.8 points required strategic work on product mix, import sourcing, and customer profitability management.
How to Tell Which One You're Dealing With
You can't fix what you can't diagnose. Here's a practical framework:
Signs You Have Margin Erosion
- Margins decline across most or all product categories simultaneously
- COGS as a percentage of revenue has been climbing for 2+ quarters
- Competitors are visibly lowering prices or offering aggressive terms
- Customer concentration is increasing (top 10 accounts growing share)
- Your cost of goods is rising faster than your average selling prices
- The margin decline tracks with identifiable external events (tariffs, commodity spikes, new competitor entry)
Signs You Have Margin Leakage
- Margin variance is high within the same product category or customer segment
- Some reps or branches consistently produce lower margins than others (on the same products)
- Actual selling prices deviate from your published price lists or discount matrices
- You can't easily answer: "What was the discount rate on orders over $5,000 last month?"
- Promotional pricing remains active after the promotion ends
- You find invoices with discounts that nobody approved
- Customers are receiving freight allowances or payment term discounts they aren't entitled to
The Diagnostic Test
Pull a sample of 500 transactions from the last quarter. For each one, compare the actual selling price against your target price (list price minus the authorized discount for that customer tier).
If the gap between target and actual is consistent across the sample (say, actual is 2-3% below target for almost all transactions), you're likely seeing erosion. The market moved, and your target prices are too high relative to competitive reality.
If the gap is wildly inconsistent (some transactions are at target, some are 10% below, some are 15% below, with no clear pattern), that's leakage. Your pricing isn't being applied consistently.
Most companies find a mix of both. The consistent gap is erosion. The variance around that gap is leakage. Both deserve attention, but the leakage offers faster ROI on fixing.
Fixing Margin Erosion
Erosion is structural, so the fixes are strategic. They take longer and require leadership alignment.
Dynamic cost-plus pricing for volatile inputs. If material costs swing 10%+ per year, annual price lists don't work. Tie pricing to commodity indices with automatic adjustments. Your customer pays list price minus discount plus a surcharge that moves monthly. Steel service centers and chemical distributors have done this for years.
Product mix management. Not every SKU is worth fighting for at thin margins. Identify which product lines still carry healthy margin (often specialty, technical, or value-add items) and shift sales focus there. Let competitors win the commodity race to the bottom.
Value-add services. When products are commoditized, services aren't. Kitting, private labeling, technical support, inventory management programs, and VMI (vendor-managed inventory) all justify margin premiums that pure product distribution can't.
Customer profitability analysis. Some customers erode your margins more than others. Run a cost-to-serve analysis on your top 20 accounts. You may find that your largest customer is your least profitable after accounting for freight, returns, extended terms, and special handling.
Regular pricing reviews. Move from annual to quarterly pricing reviews at minimum. In volatile cost environments, monthly reviews on key categories. The faster you detect erosion, the sooner you can adjust.
Fixing Margin Leakage
Leakage is tactical, and the fixes are operational. They produce faster results.
Implement discount guardrails. Set maximum discount authority by role. A sales rep can approve up to 10%. A regional manager up to 18%. Anything beyond goes to pricing or finance. Make the guardrails visible in the quoting tool, not buried in a policy document nobody reads.
Automate promotional pricing expiration. Every promotion should have a hard end date in your pricing system. When it expires, the system reverts to standard pricing automatically. No manual intervention needed.
Audit transactions monthly. Pull a report of all transactions where actual margin fell below threshold. Investigate the top 20 offenders. This single practice, done consistently, will recover more margin than most pricing software implementations.
Close the cost-update gap. When a supplier changes costs, how long until that's reflected in your selling prices? If the answer is "a few weeks" or "whenever someone gets to it," you're leaking profit on every order shipped at the old price. Build a 48-hour cost-update process.
Make margin visible to sales. Most reps don't intend to leak margin. They just don't see it. If your quoting tool shows the rep the margin impact of every discount in real time, behavior changes fast. Visibility is cheaper than controls.
For a full walkthrough on finding and fixing leakage, see our margin leakage guide.
Why the Distinction Matters for Mid-Market Companies
Here's why this matters specifically if you're running a $20M-$200M distribution or manufacturing business.
Enterprise companies with $500M+ revenue have pricing teams, dedicated analytics staff, and tools like PROS or Vendavo that cost $100K-$300K per year. They can track erosion and leakage separately because they have the infrastructure.
Mid-market companies usually don't. They run pricing in Excel. Discount approvals happen over email or Slack. Cost updates are manual. And when margins decline, the conversation at the leadership meeting is "margins are down, we need to do something." But nobody can say how much is erosion versus leakage, because the data isn't there.
This leads to the wrong response. Companies assume it's all erosion ("the market is tough") and pursue broad strategies like across-the-board price increases. Meanwhile, 40-60% of the margin decline might be leakage that's fixable without touching a single customer price.
The first step is visibility. You need transaction-level data that shows the gap between intended and actual pricing. A margin analysis at the transaction level will separate the structural decline from the preventable losses.
Once you know the split, you can prioritize. Fix the leakage first (it's faster and has immediate ROI), then address the erosion with strategic pricing changes.
Frequently Asked Questions
What is margin erosion?
Margin erosion is the gradual decline in profit margins over time, typically caused by rising costs, competitive price pressure, or market shifts that narrow the gap between what you pay for goods and what you sell them for. It's structural, meaning it affects broad categories of products or the entire business, not just individual transactions.
What is margin leakage?
Margin leakage is the preventable loss of profit caused by internal process failures like unauthorized discounts, pricing errors, billing mistakes, rebate mismanagement, and cost-to-serve gaps. Unlike erosion, leakage happens at the transaction level and is fixable through better controls and visibility. See our margin leakage guide for a full breakdown.
Can margin erosion be reversed?
Yes, but it takes longer than fixing leakage. Reversing erosion requires strategic moves: changing your pricing model, shifting product mix toward higher-margin items, adding value-added services, renegotiating supplier terms, or repositioning in the market. These changes typically take 6-18 months to fully impact margins.
How much margin leakage is typical in distribution?
Research from multiple sources suggests B2B distributors lose 2-5% of revenue to margin leakage. For a $50M distributor, that's $1M to $2.5M annually. The biggest sources are usually unauthorized discounting, expired promotional pricing, and slow cost updates from suppliers.
What tools help identify margin erosion vs. leakage?
At the basic level, a price waterfall analysis shows where dollars fall off between list price and pocket price. This separates planned discounts (strategic) from unplanned losses (leakage). For erosion, trend analysis of margin by product category and customer segment over time reveals the structural pattern. Enterprise tools like PROS and Vendavo handle this, but mid-market companies can start with transaction-level data exports and analysis.
Is margin erosion the same as price erosion?
Not exactly. Price erosion is specifically about average selling prices declining over time. Margin erosion is broader: it can be caused by price erosion, but also by cost increases that aren't offset by price changes. You can maintain stable prices and still experience margin erosion if your costs are climbing.
Which should I fix first: erosion or leakage?
Fix leakage first. It's faster (weeks, not months), doesn't require customer-facing changes, and has immediate P&L impact. Once you've tightened up the preventable losses, you'll also have better data to understand the true scope of your erosion problem.
Last updated: January 29, 2026
Frequently Asked Questions

Want to analyze your entire product catalog?
Pryse automatically identifies margin leakage across thousands of SKUs. Upload your data and find hidden profit in 24 hours.
One-time $1,499 diagnostic. No subscription required.