Margin Leakage in Manufacturing: Where Your Profits Actually Disappear
Manufacturing margin leakage costs mid-market manufacturers 2-5% of revenue annually. Learn the 8 most common sources and how to find them in your data.
Margin leakage in manufacturing is the gap between the profit margin you expect on paper and the margin you actually collect. It's caused by cost increases that don't flow into pricing, production variances that get buried in overhead, and revenue concessions that nobody tracks at the line-item level.
For mid-market manufacturers running $20M-$200M in revenue, this gap typically runs 2-5% of total revenue. That's $400K to $10M in annual profit that should be hitting the bottom line but isn't.
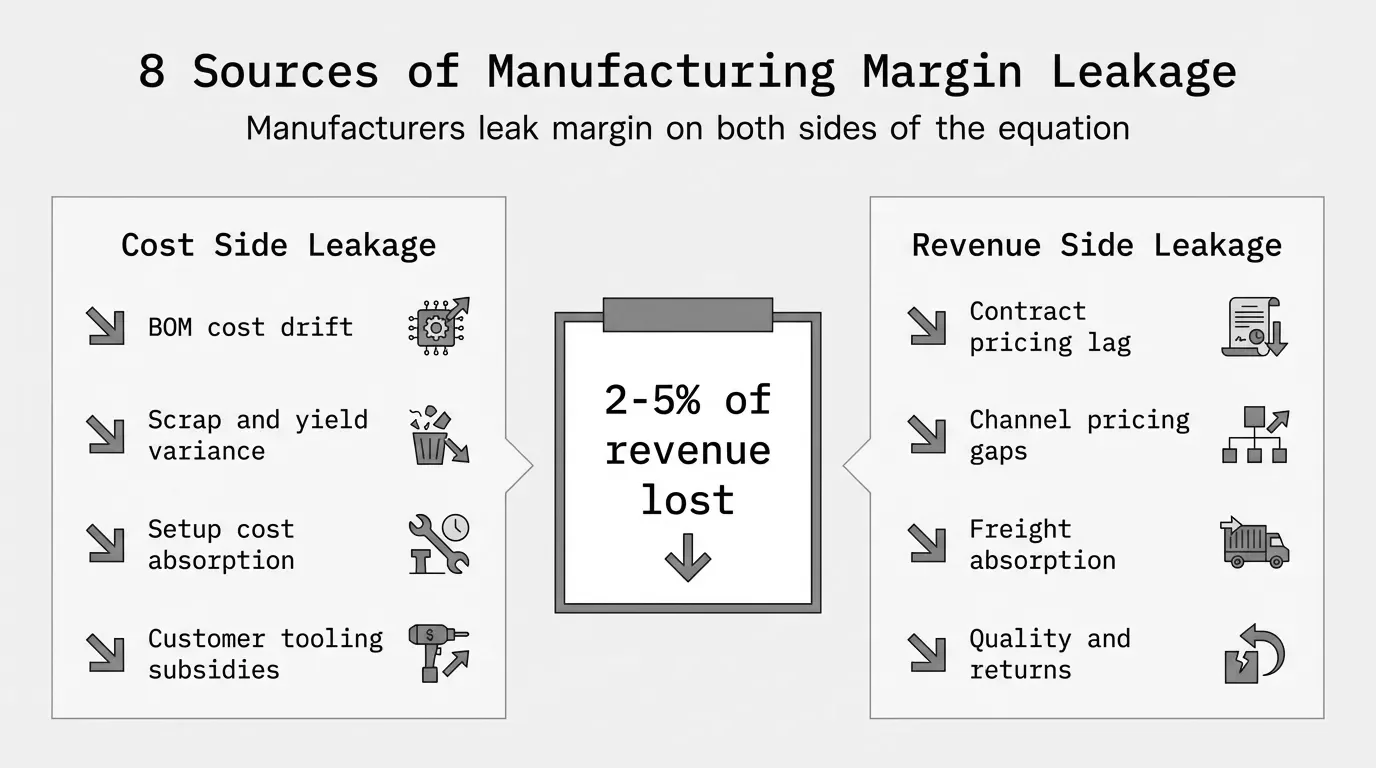
Here's what makes manufacturing leakage different from other industries: you're losing margin on both sides of the equation. Your costs are drifting upward through BOM changes, scrap, and yield loss. And your realized prices are drifting downward through contract lag, channel inconsistencies, and unrecovered ancillary costs. The squeeze happens simultaneously, and it's invisible if you're only watching aggregate margins.
This article walks through the eight most common manufacturing margin leakage sources we see in practice, with specific numbers and detection methods for each. For a broader overview of margin leakage across industries, see our margin leakage guide.
Why Manufacturing Margin Leakage Gets Ignored
Most manufacturers know their gross margin at the company level. Fewer know it at the product family level. Almost none know it at the individual SKU-customer-transaction level.
That's the problem. Company-level margin can look stable at 28% while individual transactions range from -5% to 60%. The profitable orders subsidize the unprofitable ones, and nobody sees the bleed because the aggregate number looks fine.
There's a structural reason this happens in manufacturing more than in distribution or services. Manufacturing cost structures are complex. You've got multi-level BOMs, labor routing variances, overhead allocation methods, scrap factors, setup costs, yield assumptions, and tooling amortization schedules. Each one introduces a place where the actual cost can diverge from the standard cost you used to set prices.
McKinsey research found that off-invoice price leakages can add up to 16.3% of the standard list price in B2B companies. Their analysis also showed that a 1% increase in average discount leads to an 8.7% decrease in operating profit. In manufacturing, the leakage sources extend well beyond discounting into the production cost side.
Boston Consulting Group reported that 45% of executives see revenue leakage as a systematic problem, and that fixing it can add up to 5% back to the bottom line. For a $75M manufacturer running an 8% net margin, that's the difference between $6M and $9.75M in annual profit.
The 8 Sources of Manufacturing Margin Leakage
Each of these shows up differently depending on whether you're running a discrete, process, or custom fabrication operation. But the economics are consistent across manufacturing types.
1. BOM Cost Drift
Your bill of materials is the foundation of your cost structure. When material costs change and your standard costs don't update in sync, every unit you produce costs more than your pricing assumes.
This is the single most common leakage source we see in mid-market manufacturing. Here's why it's so pervasive: BOM costs represent 50-70% of total manufacturing cost, and raw material prices can shift 10-30% within a single quarter depending on the commodity.
How it works in practice:
An industrial fastener manufacturer sets standard costs in January based on steel at $820 per ton. By April, steel has moved to $940 per ton, a 14.6% increase. Their ERP still uses the January standard. Every unit produced from April through the next standard cost update is costing more than the system thinks.
Leakage per unit = (Actual material cost - Standard material cost) x Units producedIf this manufacturer produces 2 million fasteners before updating, and the material content per fastener is $0.12 at standard versus $0.14 at actual, that's $0.02 x 2,000,000 = $40,000 in unrecognized cost.
Scale that across a full product catalog with dozens of materials, and BOM cost drift accounts for 0.5-2% of revenue at many manufacturers.
Detection method: Compare your standard BOM costs to current purchased material costs, line by line. Any component where the variance exceeds 5% is a leakage risk. If you haven't updated standard costs in more than 90 days and you buy any commodity-linked materials, you almost certainly have BOM cost drift.
2. Scrap and Yield Variance
Every manufacturer builds a scrap factor into their standard costs. The question is whether your actual scrap matches that assumption.
A scrap rate below 5% is generally considered acceptable in most manufacturing processes. But scrap rates vary enormously by operation, material, and product complexity. And the financial impact depends on when in the production process scrap occurs.
Raw material scrap early in the process wastes only material. Scrap at the end of a multi-step process wastes material plus all the accumulated labor and overhead from prior operations. A part that fails final inspection after six machining operations costs far more than one that fails incoming material inspection.
Real scenario:
A custom metal fabrication shop assumes 4% scrap in their cost standards. Actual scrap is running at 6.8% due to a tooling wear issue they haven't caught. On a $3M product line, that 2.8-point variance means:
Annual leakage = Revenue x (Actual scrap % - Standard scrap %) x Cost multiplierWith a 65% material cost ratio, that's roughly $3M x 0.028 x 0.65 = $54,600 in direct material loss alone. Add the wasted labor and overhead on those scrapped parts, and the real number is closer to $85,000.
Detection method: Pull actual scrap and rework reports by work center and compare to the scrap factors in your routing standards. Look for any work center where actual scrap exceeds standard by more than 1 percentage point. Also check if your scrap factors have been updated in the past 12 months. Many ERPs carry the same scrap assumptions for years.
3. Setup Cost Absorption Failures
Setup costs, the time and labor to configure a machine between production runs, need to get absorbed into the unit cost of the parts produced during that run. When the actual run quantity is lower than the planned quantity, setup costs get under-absorbed.
This is a particular problem for make-to-order manufacturers and any shop with high product mix and short run lengths.
The math is straightforward:
A CNC machining operation has a setup cost of $450 per changeover (1.5 hours at a $300/hour fully loaded rate). The standard cost assumes runs of 500 pieces, allocating $0.90 per unit to setup.
But the actual average run length has dropped to 280 pieces due to smaller order quantities from customers. Now the real setup cost per unit is $1.61 instead of $0.90.
Setup cost variance per unit = Setup cost x (1/Actual run qty - 1/Standard run qty)= $450 x (1/280 - 1/500) = $450 x (0.00357 - 0.002) = $0.71 per unitAt 280 units per run and 600 runs per year, that's $0.71 x 168,000 = $119,280 in unabsorbed setup costs annually.
Detection method: Compare your standard run quantities (the ones your cost standards assume) to actual average run quantities over the past 6 months. If average run quantities have dropped more than 20% from the standard assumption, you've got a setup absorption problem. This is especially common when you've been accepting smaller orders to fill capacity.
4. Customer Tooling Subsidies
Many manufacturers absorb some or all of the tooling costs for customer-specific products. Dies, molds, fixtures, and jigs can range from $5,000 for a simple stamping die to $500,000+ for a complex injection mold.
The standard practice is to amortize tooling costs over the expected production volume. The leakage happens when actual volumes fall short.
Example:
A plastics manufacturer builds a $120,000 injection mold for a customer contract expecting 200,000 units over two years. They amortize the tooling at $0.60 per unit.
After 18 months, the customer has only ordered 95,000 units. You've recovered $57,000 of the $120,000 tooling investment. If volumes don't pick up, you'll absorb $63,000 in unrecovered tooling cost on this single program.
Tooling costs make up roughly 20-30% of total manufacturing cost for custom and semi-custom products. When volumes miss projections by 30-50%, that tooling amortization shortfall goes straight to the bottom line.
Detection method: List every active customer tool with its original cost, amortization rate, and actual cumulative volume. Flag any tool where actual volume is trending more than 25% below the amortization plan. Also flag any tool that's been idle for 90+ days. These are your biggest tooling subsidy risks.
5. Contract Pricing That Doesn't Reflect Cost Changes
Long-term contracts with fixed or semi-fixed pricing create a structural margin leak when costs move upward during the contract period. This is one of the most documented leakage sources in manufacturing.
The typical pattern: sales negotiates a 2-year supply agreement based on current costs. The contract includes a price escalator tied to CPI or a commodity index. But the escalator underestimates actual cost movement, or the adjustment mechanism is annual while costs move quarterly, or the contract simply doesn't have an escalator at all.
By the numbers:
| Contract Type | Typical Duration | Price Adjustment | Common Leakage |
|---|---|---|---|
| Fixed price, no escalator | 1-3 years | None | 3-8% by end of term |
| Annual escalator (CPI-based) | 2-5 years | Once per year | 1-3% from timing lag |
| Quarterly adjustment (index-linked) | 1-2 years | Every 90 days | 0.5-1.5% from index mismatch |
| Cost-plus | Ongoing | Per order | 0.5-1% from cost calculation gaps |
A food and beverage manufacturer with $30M in annual revenue had 40% of sales under 2-year fixed contracts signed in Q1 2024. By Q4 2024, ingredient costs had risen 6% and packaging costs 11%. The $12M under fixed contracts was now generating roughly 4 percentage points less margin than expected, a $480,000 annual margin loss from contract lag alone.
Detection method: Pull your top 20 accounts by revenue. For each one, compare the current contract price per unit to the current fully-loaded standard cost. Any account where the contract price yields less than your target margin is leaking. Pay special attention to contracts signed more than 12 months ago.
6. Channel Pricing Inconsistencies
Manufacturers selling through multiple channels, direct, distributor, OEM, often end up with pricing that doesn't make sense when you look across channels. The same product going to a distributor at one price and direct to an end-user at a different price is expected. But when the distributor price plus the distributor's margin undercuts your direct price, or when different distributors get wildly different pricing for no strategic reason, you've got leakage.
Common patterns we see:
- A distributor negotiated pricing in 2023 that hasn't been adjusted, while direct pricing was updated in 2025
- Regional reps gave different pricing to different distributors for the same product volumes
- OEM pricing assumed volumes that never materialized, but the low unit price remains in effect
- Export pricing that doesn't account for the actual cost of compliance, documentation, and logistics
An industrial components manufacturer with three channels found a 22% spread between their lowest and highest realized margin across channels for the same product family. Direct sales averaged 34% gross margin, distributor sales 26%, and OEM sales 12%. The OEM channel represented 30% of volume but was barely covering variable costs after freight and quality support.
Detection method: Calculate realized pocket margin by channel, by product family. That means starting from gross revenue, subtracting all off-invoice costs (freight, rebates, co-op, returns, quality claims), and comparing the net pocket margin across channels. A spread of more than 10 points on the same product should trigger a review.
7. Freight and Delivery Cost Absorption
Freight is one of the sneakiest margin leaks in manufacturing because it often sits outside the pricing calculation entirely. The quote covers the product. Freight is "standard" or "included" or calculated at the time of shipment and billed separately, maybe.
For manufacturers shipping heavy or bulky products, freight can represent 5-12% of the order value. When freight costs rise or when customers are located further from your plant than your standard freight assumptions, every shipment loses margin.
What this looks like in practice:
A building products manufacturer uses a flat $0.08/lb freight allowance built into product prices. Actual freight costs average $0.11/lb due to carrier rate increases and a shift in customer mix toward more distant accounts. On 15 million pounds of annual shipments:
Annual freight leakage = (Actual cost/lb - Standard cost/lb) x Annual volume= ($0.11 - $0.08) x 15,000,000 = $450,000That's pure margin loss, $450K that doesn't show up in the product margin report because freight is booked as a separate line item or buried in SG&A.
Detection method: Compare actual freight expense by customer to the freight revenue or allowance collected from that customer. Also compare your current average freight cost per pound (or per pallet, per truckload) to the assumption embedded in your pricing. If you haven't updated freight factors in 18+ months, they're almost certainly wrong.
8. Quality Cost and Returns Leakage
Returns, warranty claims, quality concessions, and rework costs are margin leaks that hit after the sale. In manufacturing, these costs include not just the refund or credit, but the labor to process the return, inspect the product, rework or scrap it, and manage the customer relationship.
Most manufacturers track quality costs at the aggregate level (total warranty expense, total returns percentage) but don't tie them back to specific products, customers, or production lots.
Example by manufacturing sector:
| Manufacturing Sector | Typical Return/Claim Rate | Hidden Cost Multiplier | Effective Margin Impact |
|---|---|---|---|
| Industrial components | 1-3% of revenue | 2.5x (handling, inspection, rework) | 2.5-7.5% of affected revenue |
| Food and beverage | 0.5-2% of revenue | 1.5x (disposal, recall risk) | 0.75-3% of affected revenue |
| Custom fabrication | 2-5% of revenue | 3x (re-manufacture, expedite) | 6-15% of affected revenue |
| Electronics/assemblies | 1-4% of revenue | 2x (diagnosis, component-level repair) | 2-8% of affected revenue |
A custom fabrication shop with $18M in revenue and a 3.5% return rate doesn't have a $630,000 quality cost problem. When you factor in the full cost of rework labor, expedited replacement shipments, and the engineering time to diagnose root cause, the real cost is closer to $630,000 x 3 = $1.89M, or 10.5% of the affected revenue.
Detection method: Build a true cost-of-quality report that captures the full loaded cost per return or claim, not just the credit issued. Track cost of quality by product family and by customer. You'll typically find that 20% of your SKUs generate 80% of quality costs.
How Manufacturing Leakage Differs from Distribution
If you've read about margin leakage in distribution contexts, the manufacturing version is different in important ways.
Distributors primarily leak margin on the revenue side: wrong prices, excessive discounts, rebate miscalculations, unapproved credits. Their cost of goods is relatively straightforward. They buy products at a known cost and resell them.
Manufacturers leak margin on both sides simultaneously.
Revenue-side leakage (shared with distributors):
- Discounting and price concessions
- Rebate and incentive over-payments
- Contract pricing that hasn't kept up with costs
- Channel pricing inconsistencies
Cost-side leakage (unique to manufacturing):
- BOM cost drift
- Scrap and yield variance
- Setup cost under-absorption
- Tooling subsidy shortfalls
- Overhead allocation distortions
- Labor efficiency variance
This dual exposure is why manufacturing margin leakage tends to be larger than distribution leakage in absolute terms. A distributor might lose 1-3% of revenue to margin leakage. A manufacturer with the same revenue can lose 2-5%.
The other difference is visibility. A distributor can see margin at the transaction level with basic reporting: buy price minus sell price. A manufacturer needs to understand multi-level BOM costs, labor routings, overhead allocation, and production variances before they can even calculate the true cost of a specific product going to a specific customer. Most ERPs make this harder than it needs to be.
For more on how to analyze margins at the product and customer level, see our margin analysis guide and our breakdown of manufacturer profit margins by industry segment.
Quantifying Your Total Margin Leakage
Here's a framework for estimating your total manufacturing margin leakage. These ranges are based on what we typically see in mid-market manufacturers with $20M-$200M in revenue.
| Leakage Source | Low Estimate (% of Revenue) | High Estimate (% of Revenue) | Most Common Range |
|---|---|---|---|
| BOM cost drift | 0.3% | 2.0% | 0.5-1.0% |
| Scrap/yield variance | 0.2% | 1.5% | 0.3-0.8% |
| Setup cost absorption | 0.1% | 0.8% | 0.2-0.5% |
| Tooling subsidies | 0.1% | 0.5% | 0.1-0.3% |
| Contract pricing lag | 0.3% | 2.0% | 0.5-1.5% |
| Channel inconsistencies | 0.2% | 1.5% | 0.3-0.8% |
| Freight absorption | 0.1% | 1.0% | 0.2-0.5% |
| Quality/returns | 0.2% | 1.5% | 0.3-0.7% |
| Total | 1.5% | 10.8% | 2.4-6.1% |
For a $75M manufacturer, the "most common range" midpoint of about 4% means roughly $3M in annual margin leakage. That's profit that should be hitting the bottom line but isn't.
To put that in perspective: McKinsey's research shows that a 1% price increase drives an 8% increase in operating profit for the average company. If you're a $75M manufacturer with 10% operating margins ($7.5M), recovering $3M in leakage is equivalent to a 40% increase in operating profit, without selling a single additional unit.
Leakage recovery impact = Recovered margin / Current operating profit x 100= $3,000,000 / $7,500,000 x 100 = 40% operating profit improvementWhere to Start: The 48-Hour Margin Diagnostic
You don't need a 6-month consulting engagement or a $100K/year pricing platform to identify your biggest leaks. You need transaction-level data and the right analysis framework.
Step 1: Pull the data you already have
Export from your ERP:
- 12 months of invoiced sales (customer, product, quantity, price, date)
- Current standard costs by product
- Actual material costs (purchase history for your top 50 components)
- Scrap and rework reports by work center
- Freight expense by customer or shipment
Most ERP systems (SAP Business One, Epicor, Infor, Sage, SYSPRO) can generate these exports in CSV format.
Step 2: Calculate pocket margin by transaction
For every invoice line, calculate the fully loaded cost and the actual realized price after all concessions. This gives you pocket margin per transaction, which is where leakage becomes visible.
Step 3: Flag the outliers
Sort by deviation from target margin. Any transaction where actual margin is more than 2 percentage points below target is a leakage candidate. Group the outliers by cause: is it a cost issue (BOM drift, scrap) or a price issue (contract lag, channel inconsistency)?
Step 4: Quantify the top 3-5 sources
Don't try to fix everything at once. Identify the three to five biggest leakage sources by dollar impact and build a remediation plan for each one. In our analysis of mid-market manufacturers, the top three sources typically account for 70% of total leakage.
Pryse automates this entire process. Upload your transaction data as a CSV, and within 24 hours you get a price waterfall visualization, automated leakage detection by source, and dollar-quantified opportunity sizing. It's $1,499, one time, no implementation project required.
Preventing Future Margin Leakage
Identifying current leakage is step one. Preventing it from recurring requires process changes.
Quarterly standard cost updates. If you update standard costs annually, you're flying blind for 9 months of the year in a volatile input cost environment. Move to quarterly reviews at minimum for any material that's commodity-linked.
Contract escalation clauses. Every contract longer than 6 months should include a material cost escalator tied to relevant indices (steel, resin, copper, etc., depending on your materials). Quarterly adjustment periods are better than annual.
Setup cost re-costing. When average order quantities change by more than 15%, re-run your setup cost absorption calculation. Don't wait for the annual review.
Tooling amortization audits. Review customer tooling recovery quarterly. If a program is trending below its volume projection by more than 25% at the 6-month mark, renegotiate the amortization schedule with the customer.
Freight factor updates. Update freight allowances whenever your carrier contracts renew. If you're not tracking freight profitability by customer, start.
Quality cost attribution. Tie quality costs back to the specific product and customer that generated them. This changes the margin picture for products and customers that seem profitable on a gross margin basis but aren't after quality costs.
FAQ
What is margin leakage in manufacturing?
Margin leakage in manufacturing is the gap between your expected profit margin and your actual realized margin. It's caused by cost drift in your bill of materials, production variances that exceed your standard assumptions, pricing that doesn't keep up with cost changes, and revenue concessions that don't get tracked at the line-item level. Unlike distribution margin leakage, manufacturing leakage hits on both the cost side and the revenue side simultaneously.
How much margin do manufacturers typically lose to leakage?
Mid-market manufacturers typically lose 2-5% of total revenue to margin leakage from all sources combined. McKinsey research indicates that off-invoice leakages alone can reach 16.3% of list price. For a manufacturer running $50M in annual revenue, even a 3% total leakage rate means $1.5M in profit lost annually. The exact amount depends on your industry, product complexity, and how frequently you update cost standards and pricing.
What are the biggest sources of manufacturing margin leakage?
The most impactful sources are BOM cost drift (materials costs rising between standard cost updates), contract pricing lag (fixed-price agreements that don't keep up with cost changes), and scrap/yield variance above standard assumptions. Together, these three sources often represent 60-70% of total leakage. Setup cost absorption failures and channel pricing inconsistencies round out the top five. The relative importance shifts by manufacturing type. Process manufacturers tend to see more yield variance. Discrete and custom manufacturers see more setup and tooling leakage.
How is manufacturing margin leakage different from distribution margin leakage?
Distributors primarily leak margin through pricing errors, excessive discounting, and rebate miscalculations. Their cost side is simple: they buy and resell at known costs. Manufacturers face all those same revenue-side issues plus a full set of production-side leakage sources: BOM cost drift, scrap and yield variance, setup cost under-absorption, tooling subsidy shortfalls, and overhead allocation distortions. This dual exposure means manufacturing leakage is typically larger, running 2-5% of revenue versus 1-3% for distributors.
How do you detect margin leakage in a manufacturing company?
Start with two analyses. First, compare standard costs to actual costs at the SKU level to find cost-side leakage (BOM drift, scrap variance, setup absorption). Second, build a price waterfall from list price down to pocket price to find revenue-side leakage (discounting, contract lag, freight absorption). Flag any SKU-customer combination where actual margin deviates more than 2 percentage points from your target margin. Transaction-level data from your ERP usually reveals the pattern within hours.
Can margin leakage be fixed without enterprise pricing software?
Yes. Enterprise pricing platforms like PROS, Vendavo, and PriceFX cost $100K-$500K per year and require 6-18 months to implement. Most mid-market manufacturers can identify their top leakage sources using transaction data they already have in their ERP. The key is getting that data into a format where you can analyze margin at the individual transaction level instead of the aggregate. A diagnostic tool like Pryse does this analysis on a one-time basis for $1,499, with results in 24 hours and zero implementation overhead.
Last updated: January 29, 2026
Frequently Asked Questions

Want to analyze your entire product catalog?
Pryse automatically identifies margin leakage across thousands of SKUs. Upload your data and find hidden profit in 24 hours.
One-time $1,499 diagnostic. No subscription required.