Margin Analysis: Complete Guide to Profitability Analysis
Learn how to analyze gross, net, and operating margins. Step-by-step margin analysis for distribution and manufacturing companies.
Margin analysis is the process of measuring profitability by calculating the difference between revenue and costs at various levels of your business. It answers a simple question: how much money do you actually keep from each sale?
For distribution and manufacturing companies, margin analysis reveals which products, customers, and channels generate profit and which ones drain it. A business selling $50 million annually might discover that 30% of their SKUs lose money after accounting for true costs.
This guide covers the four types of margin analysis, how to calculate each one, common margin problems and their fixes, and specific benchmarks for distribution and manufacturing companies.
What Is Margin Analysis?
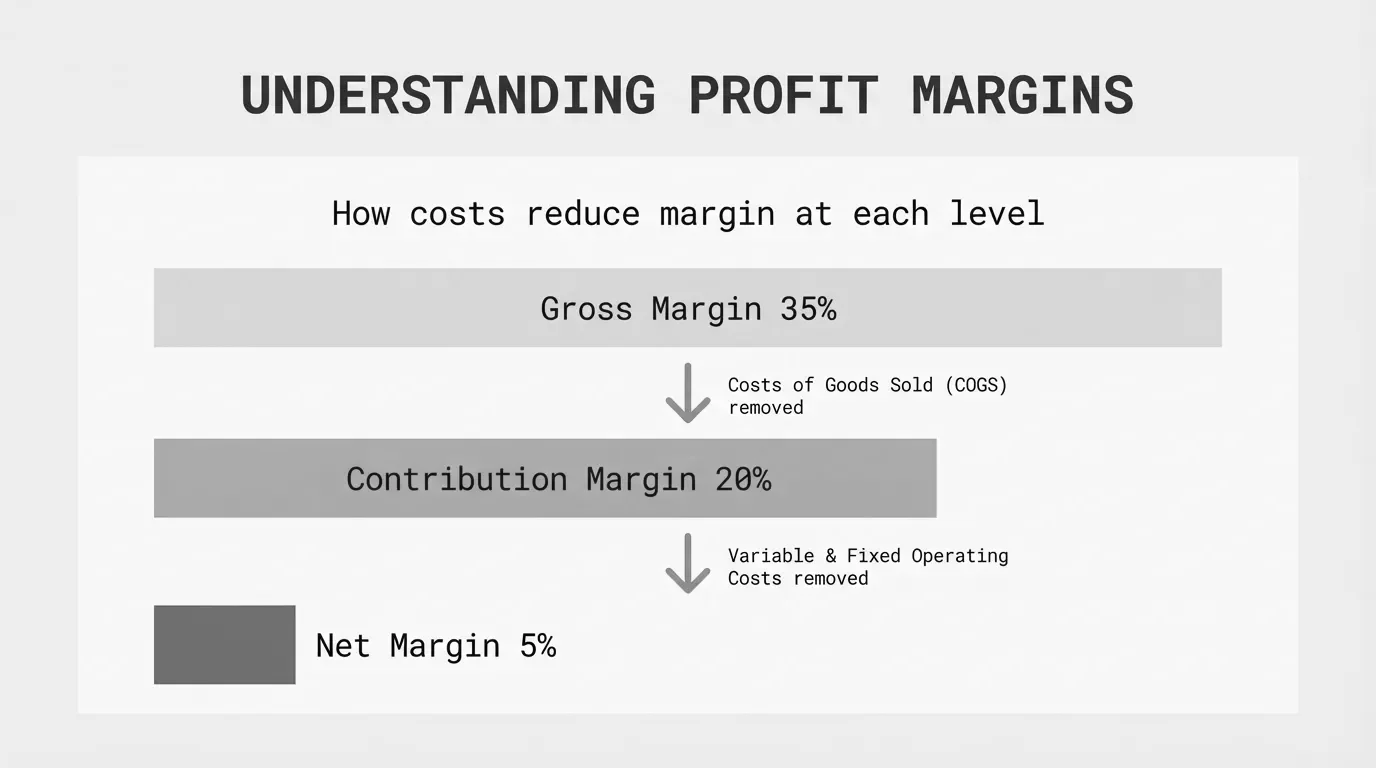
Margin analysis examines the gap between what you sell something for and what it costs you. The "margin" is the profit that remains after subtracting costs from revenue, expressed as a percentage.
Margin = (Revenue - Costs) / Revenue x 100Different margin types subtract different cost categories:
| Margin Type | Costs Subtracted | What It Measures |
|---|---|---|
| Gross Margin | Direct costs (COGS) | Production/purchasing efficiency |
| Operating Margin | COGS + operating expenses | Operational efficiency |
| Net Margin | All costs including interest and taxes | Overall profitability |
| Contribution Margin | Variable costs only | Product-level profitability |
A profitability analysis combines these metrics to build a complete picture. You might have strong gross margins but weak net margins, which points to overhead problems rather than pricing or sourcing issues.
The Four Types of Margin Analysis
Gross Margin Analysis
Gross margin measures what remains after subtracting the direct cost of goods sold from revenue. For a distributor, that's purchase cost. For a manufacturer, it's materials, direct labor, and production overhead.
Gross Margin = (Revenue - Cost of Goods Sold) / Revenue x 100A $100,000 sale with $70,000 in COGS produces a 30% gross margin.
Why it matters: Gross margin reveals your pricing power and sourcing efficiency. If you're buying at $70 and selling at $100, you have room for operating costs and profit. If you're buying at $92 and selling at $100, you're running on fumes.
Typical ranges:
- Wholesale distribution: 20-30%
- Industrial manufacturing: 25-35%
- Food distribution: 15-25%
- Specialty distribution: 30-40%
For deeper calculation guidance, see our post on gross margin formula.
Operating Margin Analysis
Operating margin goes further by also subtracting operating expenses: salaries, rent, utilities, marketing, and other costs required to run the business.
Operating Margin = (Revenue - COGS - Operating Expenses) / Revenue x 100Or equivalently:
Operating Margin = Operating Income / Revenue x 100This metric shows operational efficiency. Two companies with identical gross margins might have very different operating margins if one runs leaner operations.
Why it matters: Operating margin reflects management effectiveness. High gross margin with low operating margin means overhead is eating your profits. A company with 32% gross margin and 8% operating margin has 24 percentage points consumed by operating costs.
Typical ranges:
- Wholesale distribution: 3-8%
- Industrial manufacturing: 10-15%
- Food distribution: 2-4%
- Building materials distribution: 5-10%
For detailed calculation examples, see our operating margin formula guide.
Net Margin Analysis
Net margin is the bottom line. It subtracts everything: COGS, operating expenses, interest, and taxes.
Net Margin = Net Profit / Revenue x 100Where net profit equals revenue minus all expenses.
Why it matters: Net margin is what owners and investors care about. It's the actual profit you can reinvest, distribute, or use to service debt. A business running 12% operating margin might only net 5% after interest on inventory financing and corporate taxes.
Typical ranges:
- Wholesale distribution: 2-10%
- Industrial manufacturing: 5-10%
- Food distribution: 1-3%
- Building materials distribution: 3-7%
NYU Stern maintains updated industry margin data for public companies, showing manufacturing net margins averaging around 8% and wholesale distribution at 3-5%.
For calculation guidance and examples, see our net profit margin formula post.
Contribution Margin Analysis
Contribution margin subtracts only variable costs from revenue, ignoring fixed costs entirely.
Contribution Margin = (Revenue - Variable Costs) / Revenue x 100Variable costs change with volume: materials, direct labor, sales commissions, freight. Fixed costs stay constant regardless of volume: rent, salaried staff, insurance.
Why it matters: Contribution margin shows what each product or sale "contributes" toward covering fixed costs and generating profit. It's the right metric for make-or-discontinue decisions and break-even analysis.
A product with 40% contribution margin contributes $0.40 of each revenue dollar toward fixed costs. Once fixed costs are covered, that $0.40 becomes profit.
Use contribution margin when:
- Deciding whether to keep or drop a product line
- Calculating break-even points
- Evaluating special orders or custom pricing
- Analyzing product mix optimization
How to Perform Margin Analysis Step by Step
Most mid-market distribution and manufacturing companies run margin analysis in Excel using data exported from their ERP. Here's the process that works.
Step 1: Gather Clean Data
You need accurate, detailed data. That means:
Revenue data
- Invoice-level transaction detail
- Customer, product, and channel identifiers
- All discount and rebate information
Cost data
- Standard costs or actual purchase costs
- Allocated operating expenses
- Off-invoice costs (freight, rebates, payment terms)
The biggest problem at this stage is missing cost allocation. If your ERP tracks purchase cost but not freight, handling, or rebates, your margin calculations will be wrong.
Warning: Invoice price is not pocket price. The difference matters. A $100 invoice becomes $85 in pocket price after factoring in a 5% volume rebate, 3% early payment discount, 4% freight absorption, and 3% in handling costs. More on this in the pocket margin section below.
Step 2: Calculate Each Margin Type
Run the formulas at different levels:
Company-wide margins:
Gross Margin = (Total Revenue - Total COGS) / Total Revenue x 100
Operating Margin = (Total Revenue - Total COGS - Total OpEx) / Total Revenue x 100
Net Margin = Net Profit / Total Revenue x 100
Product-level margins:
Calculate margin for each SKU or product category. This reveals which products carry the business and which ones drag it down.
Customer-level margins:
Some customers are more profitable than others. A customer buying high-margin products, paying quickly, and requiring minimal support generates more profit than one buying low-margin items, paying late, and calling support constantly.
Channel-level margins:
Direct sales versus distribution versus e-commerce all have different cost structures. Channel margin analysis shows where to focus growth efforts.
Step 3: Segment and Compare
Raw margin numbers mean little without context. Segment your data to find patterns:
By product category
- Which categories exceed margin targets?
- Which ones fall short?
- What's the margin range within each category?
By customer tier
- Do your largest customers have the best or worst margins?
- Which customer segments over-index on profitability?
By time period
- Are margins improving or declining?
- What seasonal patterns exist?
Against benchmarks
- How do you compare to industry averages?
- Where are you ahead or behind competitors?
Step 4: Find the Outliers
The real value in margin analysis is identifying outliers:
Low-margin products still getting sales attention. Your sales team might be pushing a 15% margin product when a substitute at 35% margin sits in the catalog.
Negative-margin customers. Yes, some customers cost more to serve than they pay. A customer ordering small quantities with rush shipping, paying at 90 days, and returning 20% of orders might be underwater.
High-margin opportunities being missed. Products with 50% margins that could support more volume don't get sales focus because nobody runs the numbers.
Step 5: Take Action
Margin analysis without action is just accounting. Turn findings into decisions:
- Reprice or drop negative-margin products
- Restructure deals with unprofitable customers
- Shift sales incentives toward high-margin products
- Renegotiate supplier terms for high-volume items
- Reduce cost-to-serve for problem accounts
Margin Analysis Formulas: Quick Reference
Here are all the key formulas in one place:
Gross Margin = (Revenue - COGS) / Revenue x 100
Operating Margin = (Revenue - COGS - Operating Expenses) / Revenue x 100
Net Margin = Net Profit / Revenue x 100
Contribution Margin = (Revenue - Variable Costs) / Revenue x 100
Contribution Margin Ratio = Contribution Margin / Revenue
Break-Even Point (Units) = Fixed Costs / Contribution Margin per Unit
Break-Even Point (Revenue) = Fixed Costs / Contribution Margin Ratio
Pocket Price and Pocket Margin: The Hidden Layer
Most margin analysis stops at invoice level. That's a mistake.
A price waterfall shows how list price erodes to pocket price through sequential deductions: invoice discounts, off-invoice rebates, freight costs, payment terms, and other allowances.
According to McKinsey research, off-invoice price leakages average 16.3% of list price. Combined with on-invoice discounts, total erosion can reach 33% or more from list to pocket.
Invoice margin uses the price shown on the invoice. Pocket margin uses the actual cash collected after all deductions.
Invoice Margin = (Invoice Price - COGS) / Invoice Price x 100
Pocket Margin = (Pocket Price - COGS) / Pocket Price x 100
A product with 30% invoice margin might have only 18% pocket margin after accounting for:
| Deduction | Amount |
|---|---|
| Volume rebate | 5% |
| Early payment discount | 2% |
| Freight absorption | 3% |
| Co-op advertising | 2% |
If you only track invoice margin, you're missing the full picture. For a deep dive on this topic, see our guide on price waterfall analysis.
Common Margin Problems and How to Fix Them
After analyzing thousands of transactions across distribution and manufacturing companies, certain patterns appear repeatedly.
Problem 1: Price Inconsistency
Symptom: Wide margin variance across similar transactions.
Two customers buy the same product. One pays $100, the other pays $82. Both are legitimate sales without obvious explanation for the difference.
Cause: Legacy pricing, rep discretion, and scattered agreements create inconsistency. Customer A's price was set in 2019 and never reviewed. Customer B negotiated harder last month.
Fix: Map your price waterfall. Identify where prices diverge from targets. Establish pricing guardrails that limit rep discretion. Review customer-specific pricing annually.
Problem 2: Cost Increases Not Passed Through
Symptom: Gross margin declining over time despite stable pricing.
Suppliers raised prices 8% over two years. Your prices increased 3%. The 5% gap comes straight out of margin.
Cause: Price increases are unpleasant. Sales teams resist them. Without a systematic process, they don't happen.
Fix: Track supplier cost changes centrally. Set triggers for automatic price reviews when costs move beyond thresholds. Communicate increases proactively with customers rather than apologetically after the fact.
Problem 3: Product Mix Shift
Symptom: Overall margins declining even though individual product margins are stable.
Nothing changed about pricing or costs for any specific product. But the mix shifted. High-margin products went from 40% of revenue to 30%. Low-margin products filled the gap.
Cause: Sales incentives favor volume over margin. Customers naturally migrate toward lower-priced options. New competitors enter high-margin segments.
Fix: Recalibrate sales incentives to include margin contribution, not just revenue. Track mix trends monthly. Investigate what's driving shifts before they become entrenched.
Problem 4: Untracked Discounts and Rebates
Symptom: Actual margin consistently lower than expected margin.
The pricing system says margin should be 28%. Actual results show 22%. The gap persists across periods.
Cause: Off-invoice deductions aren't captured in the pricing calculation. Freight absorption, rebates, returns, chargebacks, and payment term costs add up.
Fix: Build a complete price waterfall that captures all deductions. This requires connecting data from AP, AR, logistics, and sales systems. Messy, but necessary.
Problem 5: High Cost-to-Serve Customers
Symptom: Customers that look profitable on paper destroy margin in practice.
A customer generates $500K in revenue at 25% gross margin. Looks great. But they order 200 times per year in small quantities, require next-day delivery, pay at 75 days, and return 15% of orders. The cost to serve them exceeds the margin.
Cause: Traditional margin analysis doesn't allocate operating costs to individual customers. Cost-to-serve analysis does.
Fix: Calculate true customer profitability by allocating order processing, picking, shipping, returns handling, and AR costs to each account. Then segment customers and adjust pricing or service levels accordingly.
Margin Analysis for Distribution Companies
Distribution operates on thin margins. Wholesale distribution typically runs 20-30% gross and 2-10% net. There's little room for error.
Distribution-Specific Margin Challenges
Multi-tier pricing complexity. Distributors often serve different customer types at different price levels: end users, contractors, dealers, OEMs. Managing margin across tiers requires tracking who's buying at what level.
Rebate program complexity. Supplier rebates can represent significant margin. A distributor might earn 2-4% back on purchases through volume rebates, growth rebates, and marketing funds. Missing rebate tiers means leaving money on the table.
Freight and logistics costs. A distributor eating 5% of revenue in freight absorption has a structural margin problem. Tracking delivery costs by customer reveals who's costing money to serve.
Inventory carrying costs. The cost of holding inventory (warehousing, insurance, obsolescence, capital tied up) runs 15-30% of inventory value annually. Slow-moving SKUs destroy margin even if their selling price looks adequate.
Distribution Margin Benchmarks
| Metric | Low | Typical | Strong |
|---|---|---|---|
| Gross Margin | 15% | 22-28% | 32%+ |
| Operating Margin | 2% | 4-7% | 10%+ |
| Net Margin | 1% | 2-5% | 8%+ |
| Inventory Turns | 3x | 5-8x | 10x+ |
These benchmarks vary by vertical. Food distribution runs thinner than electrical. Building materials differs from industrial MRO.
Where Distributors Find Hidden Margin
Based on pricing analysis across dozens of mid-market distributors, margin recovery opportunities cluster in predictable areas:
- Customer pricing inconsistency (1-3% of revenue) - Same products priced differently across similar customers without justification
- Rebate program underperformance (0.5-1.5% of revenue) - Missing volume tiers, not claiming all earned rebates
- Freight recovery (0.5-2% of revenue) - Absorbing shipping costs that should be passed through
- Payment terms cost (0.3-1% of revenue) - Slow-paying customers not charged for cost of capital
McKinsey research indicates that distributors who implement systematic pricing improvements can expand earnings by up to 50% with minimal volume impact.
Margin Analysis for Manufacturing Companies
Manufacturers face different margin dynamics. Cost structures are more complex, with multiple inputs and production stages. But margin analysis principles remain the same.
Manufacturing-Specific Margin Challenges
Bill of materials complexity. A single finished good might have dozens of components with costs changing at different rates. Accurate COGS requires maintaining current component costs and realistic overhead allocations.
Production variance. Standard costs used for pricing might diverge from actual production costs. Scrap, rework, and efficiency variance all affect realized margin.
Capacity utilization effects. Manufacturing has significant fixed costs. Running at 60% capacity versus 90% capacity dramatically changes unit cost allocation, which affects margin calculation.
Channel and customer mix. Selling through distributors versus direct creates different margin profiles. The same product might generate 35% margin through distribution or 45% margin on direct sales, with different volumes and cost-to-serve.
Manufacturing Margin Benchmarks
| Metric | Commodity | Diversified | Specialty |
|---|---|---|---|
| Gross Margin | 18-25% | 28-35% | 38-50% |
| Operating Margin | 5-8% | 10-15% | 15-22% |
| Net Margin | 3-5% | 6-10% | 10-15% |
Commodity manufacturers compete on cost and volume. Specialty manufacturers with differentiated products command higher margins but lower volumes.
Where Manufacturers Find Hidden Margin
Manufacturing margin improvement opportunities include:
- Product portfolio optimization (1-3% of revenue) - Discontinuing or repricing low-margin products that consume capacity
- Customer-specific pricing alignment (0.5-2% of revenue) - Adjusting prices based on true cost-to-serve and value delivered
- Input cost pass-through (0.5-2% of revenue) - Systematic price adjustments when material costs change
- Scrap and rework reduction (0.5-1.5% of cost) - Quality improvements that reduce wasted materials and labor
Tools and Templates for Margin Analysis
Excel-Based Analysis
For companies under $100M in revenue, Excel remains the practical choice. An effective margin analysis workbook includes:
Transaction data tab: Raw invoice data with product, customer, quantity, price, and cost fields
Margin calculation tab: Formulas calculating gross margin by product and customer
Pivot analysis tab: Summaries by product category, customer tier, time period
Benchmark comparison tab: Industry standards and internal targets
Action items tab: Issues identified and recommended responses
The challenge with Excel is data management. As transaction volume grows, spreadsheets become unwieldy. Keeping data current requires manual exports and refreshes.
ERP System Reporting
Most mid-market companies use ERP systems (NetSuite, SAP Business One, Acumatica, Microsoft Dynamics 365) that can generate margin reports. The limitation is analysis depth.
Standard ERP reports show overall margins. Getting product-by-customer detail, pocket margin calculation, or trend analysis typically requires custom reports or data exports to Excel.
Dedicated Pricing Analytics
For companies serious about margin optimization, purpose-built tools automate what's painful in Excel:
- Automatic margin calculation across products and customers
- Price waterfall visualization
- Margin leakage identification
- Benchmark comparison
- Trend tracking over time
The investment makes sense when the complexity of your pricing (thousands of SKUs, hundreds of customers, multiple price tiers) exceeds what Excel handles well.
Running Margin Analysis: Cadence and Process
Monthly
Calculate and review overall margins. Track gross, operating, and net margin month-over-month. Look for trends.
Identify variances from budget. If margins are below plan, find out why before it compounds.
Check pricing compliance. Are prices being honored in the field? Spot-check transactions against price lists.
Quarterly
Run product profitability analysis. Which products are above target? Which are below? What changed?
Run customer profitability analysis. Segment customers by margin contribution. Identify those requiring attention.
Review pricing versus cost trends. Are cost increases being passed through? What's the lag?
Update benchmarks. Compare current performance to industry data and internal targets.
Annually
Complete portfolio review. Evaluate every product family against margin thresholds. Recommend discontinuation, repricing, or continued investment.
Customer tier review. Reassess customer classifications and associated pricing levels.
Pricing strategy review. Do current margins support business objectives? What structural changes are needed?
Process improvement planning. Based on the year's analysis, what data, tools, or capabilities need upgrading?
Getting Started With Margin Analysis
If you're currently running limited margin analysis, here's how to build capability:
Week 1-2: Baseline current state
- Calculate company-wide gross, operating, and net margin
- Identify what data you have and what's missing
- Document where pricing and cost data lives
Week 3-4: Build product analysis
- Calculate margin by product category
- Identify highest and lowest margin products
- Flag products below minimum acceptable margin
Month 2: Add customer dimension
- Calculate margin by customer or customer segment
- Identify margin variance across similar customers
- Flag customers with margin below threshold
Month 3: Introduce pocket margin
- Map your price waterfall
- Capture off-invoice costs and deductions
- Recalculate margins using pocket price
Ongoing: Institutionalize the process
- Establish regular reporting cadence
- Connect analysis to pricing decisions
- Track margin improvement over time
Most companies find 2-5% in margin recovery opportunities once they start looking systematically. A 3% improvement on $50M in revenue is $1.5M annually, straight to the bottom line.
The Bottom Line on Margin Analysis
Margin analysis isn't complicated. The formulas are basic math. The challenge is having accurate data and actually using the insights.
For distribution and manufacturing companies in the $20M-$200M range, systematic margin analysis typically reveals:
- Products priced below cost-to-serve
- Customers with hidden service costs
- Pricing inconsistencies across similar transactions
- Cost increases absorbed rather than passed through
- Rebates and deductions not captured in analysis
Fixing these issues doesn't require enterprise pricing software or massive investments. It requires looking at your data more carefully than you have been.
Start with gross margin by product and customer. Add operating cost allocation for contribution margin. Build toward pocket margin analysis that captures the full price waterfall. Compare everything to benchmarks.
A 1% improvement in price drops directly to the bottom line. On $50 million in revenue at 5% net margin, a 1% price improvement increases profit by 40%. That makes margin analysis worth the effort.
Last updated: January 24, 2026
Related Articles
Frequently Asked Questions

Want to analyze your entire product catalog?
Pryse automatically identifies margin leakage across thousands of SKUs. Upload your data and find hidden profit in 24 hours.
One-time $1,499 diagnostic. No subscription required.