Competitive Pricing Analysis: A 6-Step Process for Distributors
How to run a competitive pricing analysis across 10K+ SKUs. Step-by-step process with formulas, data sources, and distribution-specific examples.
A competitive pricing analysis is the structured process of collecting what competitors charge, comparing it against your own prices, and figuring out where you're leaving money on the table or losing deals you should've won. It's not guessing. It's not reacting to whatever your sales rep heard at lunch. It's data.
And most distributors don't do it. They rely on anecdotes — "the customer says ABC Supply is 10% cheaper" — and either drop their price or lose the deal. We ran a competitive pricing analysis for a $60M industrial distributor last year. They'd been hearing "you're too expensive" from customers for months. When we actually matched their prices against three key competitors across 2,400 overlapping SKUs, the reality was different: they were overpriced on about 15% of items (mostly commodity fasteners) and underpriced on 35% of items (specialty fittings, safety equipment, adhesives). They weren't too expensive. They were mispriced. There's a big difference.
This guide walks through the six-step process for running a competitive pricing analysis that actually produces actionable results, not a spreadsheet that sits in a shared drive. For the broader strategic framework, see our competitive pricing guide.
Why Competitive Pricing Analysis Matters in Distribution
Here's the economic argument in one sentence: Bain & Company's analysis of dozens of B2B companies found that a 1% improvement in realized price drives an 8% increase in operating profit — roughly twice the benefit of a 1% improvement in volume or variable costs.
The problem is that most distributors don't know where that 1% lives. They can't tell you which products are priced above market (costing them volume) or below market (costing them margin). A competitive pricing analysis answers both questions at once.
Consider a $75M distributor with 12,000 SKUs. If 3,000 of those SKUs are priced 5-8% below the nearest competitor — and those SKUs represent $20M in annual revenue — the margin left on the table is somewhere between $1M and $1.6M per year. That's not theoretical. That's the pattern we see repeatedly.
The flip side matters too. If 1,500 commodity SKUs are priced 10% above market, those are the items driving customer complaints and defection. You're losing volume on price-sensitive products while undercharging on products where customers aren't shopping around. It's the worst of both worlds.
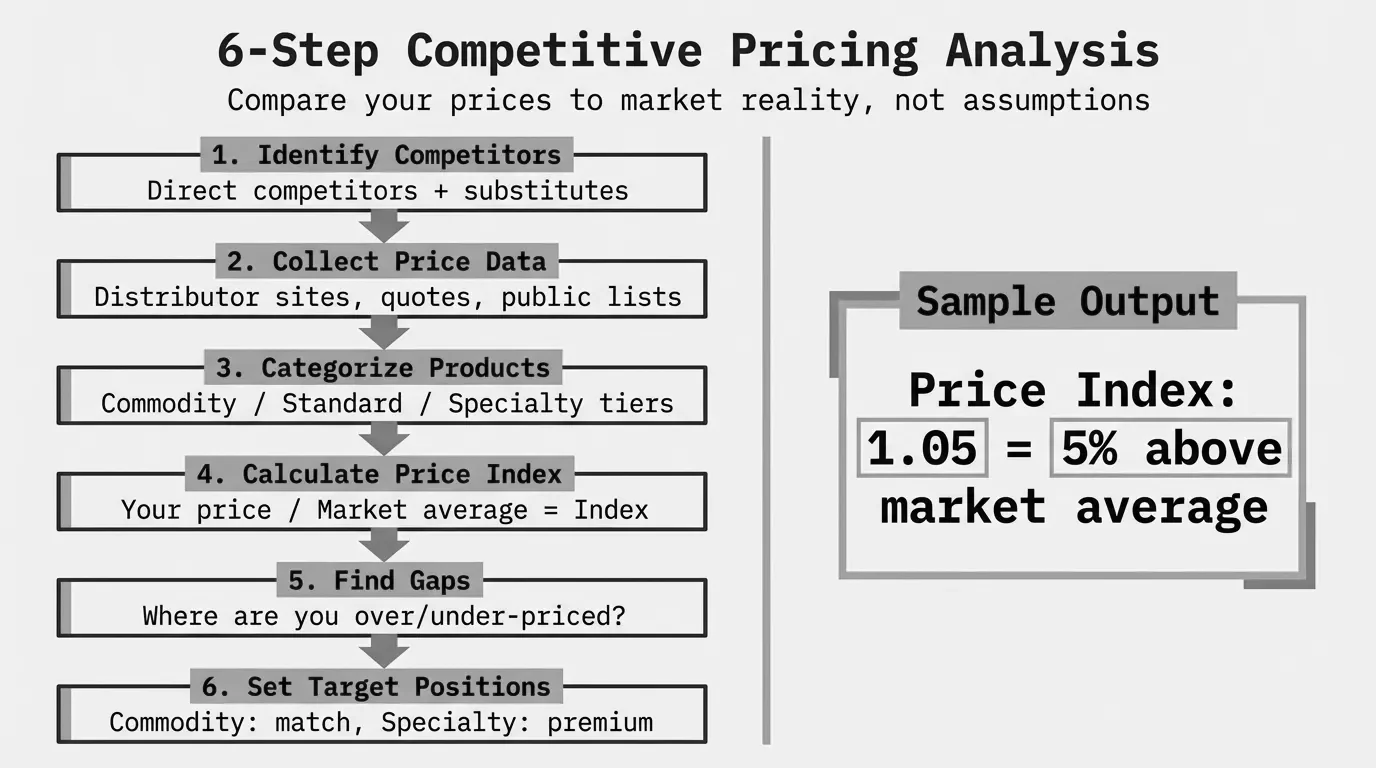
Step 1: Define Your Competitive Set
Don't try to track every company that sells something similar to what you sell. That's a project that never finishes.
Pick 3-5 direct competitors. These are companies your sales team loses deals to regularly. For a regional industrial distributor, that's usually:
- 1-2 local/regional competitors who overlap on geography and product mix
- 1-2 national players (Grainger, MSC Industrial, Fastenal, etc.)
- 1 online-first competitor who shows up on price-sensitive bids
Talk to your sales team. Pull your win/loss data from the last 12 months. The competitors worth tracking are the ones that actually take your business, not every name in the industry directory.
Step 2: Collect Competitor Price Data
This is where most competitive pricing analysis efforts stall. B2B pricing isn't published on a shelf. You have to hunt for it.
Here are the data sources that actually work in distribution, ranked by reliability:
Tier 1 — Hard data:
- Customer-provided competitive quotes (ask your sales team to collect these systematically)
- Buy-sell group or cooperative pricing data
- Public online pricing from competitor websites or marketplaces
- Supplier price sheets (if competitors share the same suppliers, their cost floor is similar to yours)
Tier 2 — Soft data:
- Sales team intelligence from customer conversations
- Win/loss reports with price-related loss reasons
- Industry pricing surveys from trade associations (NAED, ISA, NAW)
Tier 3 — Inferred data:
- Reverse engineering from known competitor margins (public companies report gross margins in 10-K filings)
- Market basket testing (requesting quotes as a prospect)
The $60M distributor I mentioned earlier collected 4,200 competitive price points over 90 days using a combination of customer-provided quotes, online pricing, and sales team debriefs. They didn't need a pricing intelligence platform. They needed a structured process and a shared spreadsheet with clear fields: date, competitor, SKU, their price, our price, source.
What to capture for each data point:
| Field | Example |
|---|---|
| Date collected | 2026-01-15 |
| Competitor | ABC Supply |
| Product / SKU | 3/4" brass ball valve |
| Your SKU number | BV-750-BR |
| Competitor price | $18.40 |
| Your price | $21.60 |
| Unit of measure | Each |
| Source | Customer quote |
| Confidence level | High / Medium / Low |
The confidence level matters. A customer-provided quote is high confidence. A rumor from a trade show is low. You'll weight your analysis accordingly.
Step 3: Organize by Category and Segment
Dumping 4,000 price comparisons into a flat list tells you nothing useful. You need structure.
Group your competitive data by product category, then by customer segment. Here's why: your competitive position on commodity fasteners is completely different from your position on specialty electrical components. Mixing them together gives you an average that's wrong everywhere.
We typically recommend this hierarchy:
- Product category (fasteners, valves, electrical, safety, etc.)
- Price tier (A items = top 20% by revenue, B items = next 30%, C items = bottom 50%)
- Customer type (contractor, OEM, maintenance/MRO, government)
This segmentation lets you see patterns. You might discover you're 12% above market on commodity fasteners sold to contractors but 8% below market on specialty safety equipment sold to OEMs. Each of those findings requires a different response.
Step 4: Calculate Your Competitive Price Index
The competitive price index (CPI) is the single number that tells you where you stand. It's the backbone of any competitive pricing analysis.
Competitive Price Index = (Your Price / Competitor Price) x 100
A CPI of 100 means you're at parity. Above 100 means you're more expensive. Below 100 means you're cheaper.
For a single product against a single competitor, it's straightforward:
Example: Your price = $21.60, Competitor price = $18.40
CPI = ($21.60 / $18.40) x 100 = 117.4
A CPI of 117.4 means you're 17.4% more expensive than that competitor on that item.
When you have multiple competitors, average the individual indexes:
Average CPI = Sum of individual CPIs / Number of competitors
Example: CPI vs. Comp A = 117, CPI vs. Comp B = 104, CPI vs. Comp C = 112
Average CPI = (117 + 104 + 112) / 3 = 111
Sales-Weighted Price Index
Here's where most guides stop, and where the real insight starts. An unweighted average treats a $5 fastener you sell 10 units of per year the same as a $200 valve you sell 5,000 units of. That's misleading.
Weight your CPI by sales volume or revenue to get a number that reflects where your money actually flows:
Weighted CPI = Sum of (Individual CPI x SKU Revenue) / Total Revenue of Analyzed SKUs
That $60M distributor had an unweighted average CPI of 108 across all analyzed items — 8% above market. Sounds alarming. But when we weighted by revenue, their weighted CPI was 101.3. They were basically at market on the products that mattered most. The 8% gap was concentrated in low-volume tail items that nobody was buying anyway. That changed the whole conversation. Instead of panicking about being "too expensive," they could focus on the specific categories where their pricing was actually off.
For more on how to apply the index to your competitive pricing model, see our dedicated guide.
Step 5: Identify Gaps and Prioritize
Now you've got a CPI by category and segment. The next step is deciding what to do about it.
Not every gap needs fixing. Here's the prioritization framework we use:
| CPI Range | Position | Typical Action |
|---|---|---|
| Below 90 | Significantly underpriced | Raise prices. You're leaving margin on the table. |
| 90-97 | Slightly underpriced | Evaluate — might be intentional for volume. |
| 97-103 | At market | No action needed unless margins are thin. |
| 103-110 | Slightly overpriced | Monitor. Acceptable for differentiated products. |
| Above 110 | Significantly overpriced | Investigate. Are you losing volume here? |
The key word is "investigate," not "cut prices." A CPI of 115 on a specialty product with high service value might be exactly right. A CPI of 115 on a commodity fitting is probably costing you orders.
Cross-reference your CPI with two other data points:
- Sales trend — Is volume declining on high-CPI items? That confirms the price gap is hurting you.
- Margin contribution — Are low-CPI items actually profitable enough to justify the volume?
This is where competitive pricing analysis connects to your broader b2b pricing strategy. Price gaps don't exist in isolation. They exist in the context of your margin targets, your competitive positioning, and your customer relationships.
Step 6: Act on the Findings
Analysis without action is just an expensive spreadsheet. Here's how to translate findings into price changes that stick.
Quick wins (implement in 30 days):
- Raise prices on items where CPI is below 95 AND the item isn't a high-visibility shopped product. These are pure margin giveaways.
- Correct obvious outliers where a single product is priced 20%+ above or below market with no strategic reason.
Medium-term moves (30-90 days):
- Adjust commodity category pricing to bring CPI within 97-103 range. Do it in 2-3% increments, not one big jump.
- Create pricing tiers for products where your CPI varies wildly by customer segment. Your OEM customers getting the same price as your spot-buy contractors doesn't make sense.
Strategic shifts (90+ days):
- Renegotiate supplier costs on categories where you're consistently above market AND your margins are average. Your cost structure might be the problem, not your pricing.
- Develop a competitive pricing formula for each product category that automatically positions new items based on competitive benchmarks.
One thing we tell every client: don't move everything at once. Start with the top 200 SKUs by revenue impact (CPI gap x annual revenue). Fix those and you've captured 70-80% of the opportunity.
Common Mistakes in Competitive Pricing Analysis
After running these analyses for distribution and manufacturing companies, the same errors show up repeatedly.
Mistake 1: Treating all competitive intel as equal. A price your sales rep "heard from a customer" isn't the same quality as an actual quote. Weight your confidence levels or you'll make decisions on bad data.
Mistake 2: Analyzing SKU-by-SKU instead of by category. You can't manage 10,000 individual competitive positions. You can manage 20 category-level pricing strategies. Aggregate up.
Mistake 3: Ignoring the full cost picture. A competitor quoting $18.40 on a valve doesn't mean they're cheaper if their minimum order is 100 units, delivery takes 3 weeks, and they charge $25 for shipping. Compare total cost to the customer, not unit price alone. For more on this, see competitive pricing examples from real distribution scenarios.
Mistake 4: Running the analysis once and never again. Markets move. Competitor pricing changes. Your cost inputs shift. A competitive pricing analysis from 12 months ago is outdated. Build a quarterly cadence at minimum.
Mistake 5: Letting sales teams set the agenda. Sales hears about competitive losses, not competitive wins. If you only analyze the products where customers complained about price, you'll conclude you're overpriced on everything. Include your full product mix for an honest picture.
What Good Looks Like
The $60M distributor I've been referencing took about six weeks from data collection to first price changes. Their results after 90 days:
- Raised prices on 340 underpriced specialty items (average increase: 4.2%)
- Reduced prices on 180 overpriced commodity items (average decrease: 2.8%)
- Net margin impact: +1.4% on analyzed product lines
- Dollar impact: roughly $280K in annualized additional margin
They didn't buy new software. They didn't hire a consultant for six months. They built a process, collected data, calculated indexes, and made targeted adjustments. The hardest part wasn't the math. It was getting the sales team to trust the data over their instincts.
That's what a competitive pricing analysis actually does. It replaces "I think we're too expensive" with "we're 7% above market on commodity fasteners and 6% below market on specialty fittings." One of those is a problem. The other is an opportunity. Without the analysis, they look the same. For a deeper look at the pricing methodology behind these decisions, start there.
Getting Started
You don't need perfect data to start. Here's the minimum viable competitive pricing analysis:
- Pick your top 500 SKUs by revenue
- Identify 3 competitors
- Collect at least 200 competitive price points over 30 days
- Calculate CPI by product category
- Find the 50 biggest gaps (by CPI x revenue)
- Make 50 price adjustments
- Measure the margin impact after 60 days
That's it. No six-figure platform. No year-long project. Just a structured process, some discipline around data collection, and the willingness to look at the numbers honestly.
If you want to see what your competitive price position looks like across your full catalog, Pryse can run a margin diagnostic in 24 hours. Upload your pricing data and see where the gaps are.
Last updated: February 14, 2026
Frequently Asked Questions

Want to analyze your entire product catalog?
Pryse automatically identifies margin leakage across thousands of SKUs. Upload your data and find hidden profit in 24 hours.
One-time $1,499 diagnostic. No subscription required.