5 Competitive Pricing Models: Which One Fits Your Distribution Business?
Compare 5 competitive pricing models used in distribution and manufacturing. Includes margin expectations, scenarios, and a decision framework for choosing the right one.
Every distributor and manufacturer tracks what competitors charge. The question isn't whether you're doing competitive pricing -- it's whether you're doing it with a model or just reacting.
I've worked with distribution companies that monitored competitor prices religiously but had no framework for what to do with the data. Their sales reps collected price sheets, forwarded them to the pricing manager, and the pricing manager adjusted a few hundred SKUs based on gut feel. That's not a competitive pricing model. That's a fire drill.
A competitive pricing model gives you a repeatable system for deciding where to position your prices relative to the market. Not just "match them" or "beat them by 5%," but a structured approach based on your cost position, your differentiation, and what you're actually trying to achieve in each product category.
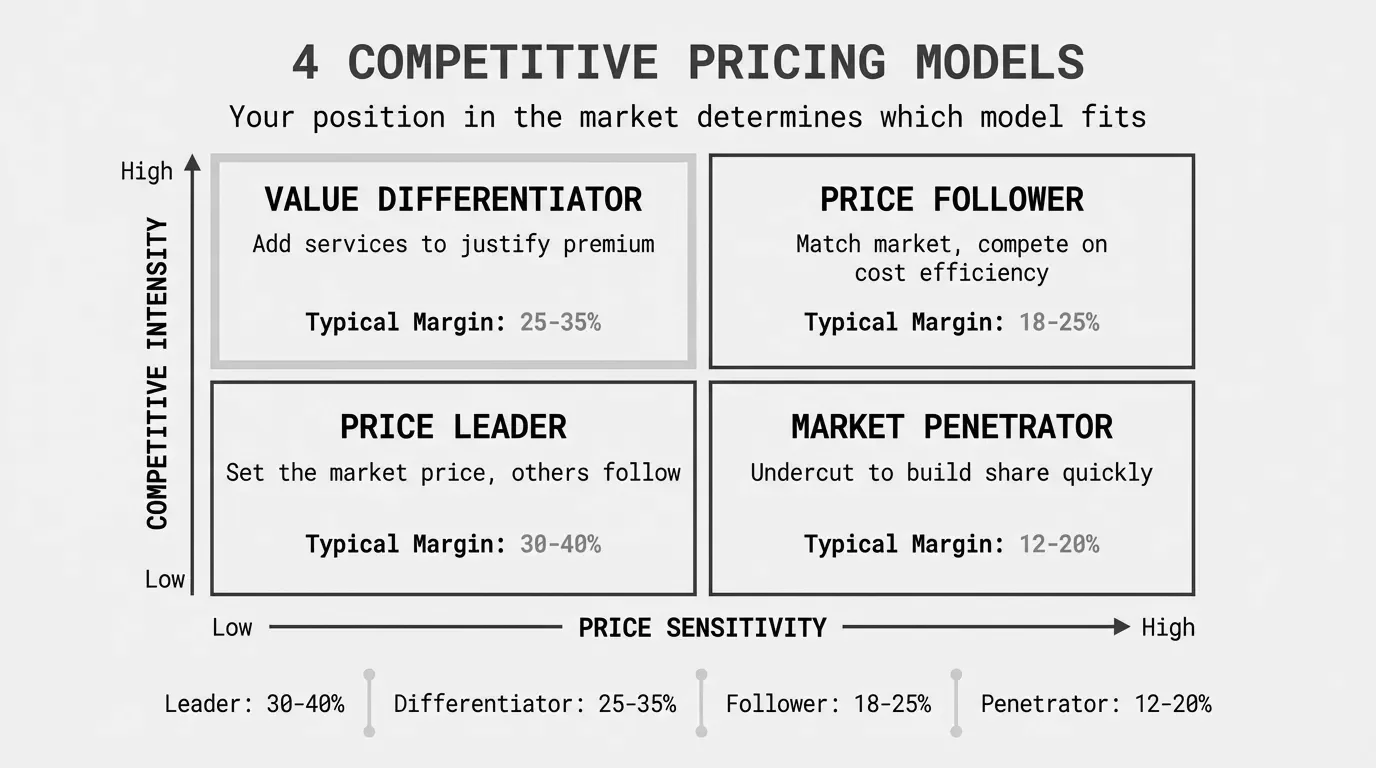
This article covers five competitive pricing models, when each one works, the margin expectations that come with it, and how to pick the right one for your business. For broader context on how competitive pricing fits into your overall approach, see the competitive pricing guide.
The 5 Competitive Pricing Models
These aren't theoretical constructs from an economics textbook. They're the models I see distribution and manufacturing companies actually use -- sometimes intentionally, more often by accident.
1. Price Leader
The Price Leader model means you set the market price. Competitors react to you, not the other way around. You move first on increases and decreases, and the market follows.
How it works. You establish prices based on your cost structure, target margins, and market intelligence. When you raise prices, competitors evaluate whether to follow. When you drop them, competitors decide whether to match. Your pricing decisions ripple through the market.
When it fits. You're the dominant player in a product category or region. You have genuine cost advantages -- better supplier terms, more efficient logistics, higher volume. You've got a brand reputation that lets you set expectations. In distribution, this often happens at the regional level: the largest electrical distributor in the Southeast can be a Price Leader even if they're a fraction of the size of a national chain.
Margin expectations. Price Leaders typically sustain 15-25% gross margins on the categories they lead. The advantage isn't necessarily higher margins per unit -- it's control. You decide when margins expand and when they compress. Bain & Company's 2025 brief "Expanding Profit Margin Through Intelligent Pricing" found that companies with disciplined pricing leadership sustain 2-4 percentage points more margin than reactive competitors over time.
The risk. If you raise prices and nobody follows, you've just handed market share to your competitors. Price leadership only works when you have enough market presence that others take your moves seriously. A $30M distributor trying to lead pricing in a category dominated by a $500M national player is going to have a bad time.
Best for: Regional distributors with dominant market share in specific categories. Manufacturers with proprietary products or cost advantages from vertical integration.
2. Price Follower
The Price Follower model means you let one or two dominant competitors set the pace and adjust your prices in response. You don't initiate price moves -- you react to them.
How it works. You identify the price leader in each product category and track their pricing changes. When they raise prices, you evaluate whether to follow (usually yes, because it protects margins across the market). When they drop prices, you decide how far to follow based on your cost floor. The gap between your price and the leader's price stays relatively consistent.
When it fits. You're a smaller player in a market with a clear leader. You don't have the volume or cost position to drive market pricing. But you compete on service, relationships, or geographic coverage that the leader can't match. Following keeps you competitive without starting a price war you can't win.
Margin expectations. Price Followers typically operate at 20-30% gross margins. That's often better than the leader's margins, because followers don't bear the cost of being first. You don't invest in the market intelligence to set prices -- you just react. And because you're usually smaller, you can cherry-pick the most profitable opportunities while the leader serves the whole market.
The risk. You're always playing catch-up. If the leader drops prices aggressively to gain share, you're forced to follow or lose volume. You also can't differentiate on price -- you need other reasons for customers to buy from you.
Best for: Regional distributors competing against national players. Smaller manufacturers in fragmented markets. Companies with strong service differentiation but limited pricing power.
3. Price Matcher
The Price Matcher model is exactly what it sounds like. You match competitor prices, product for product. The competitive set determines your pricing, and you stay within a tight band around the market average.
How it works. You monitor a defined set of competitors (usually three to five) and calculate the market price for each SKU or category. Your price stays within a target range of that average -- typically plus or minus 2-5%. If a competitor drops, you drop. If they raise, you raise.
Target Price = Average Competitor Price x (1 + Position Offset %)
Example: $47.50 avg x (1 + 0.02) = $48.45 (priced 2% above market average)
When it fits. Commodity products where customers actively compare prices. Categories with high price transparency -- online channels, published price lists, or frequent RFQs. Products where your offering is functionally identical to competitors. This is the default model for items like standard fasteners, commodity electrical supplies, or generic maintenance chemicals.
Margin expectations. Expect 18-25% gross margins, compressed by the transparency that makes this model necessary. You won't outperform the market because you are the market. The upside is you won't lose deals on price either.
The risk. Price Matching on everything is a margin trap. If you match across your entire catalog, you're letting your least disciplined competitor set your prices on every SKU. And here's the problem -- different competitors are cheapest on different products. Match them all and you end up at the lowest price across the board, not the average. I've seen distributors lose 3-5 margin points this way without realizing it.
This is where a competitive pricing analysis matters. You need to know not just what competitors charge, but which competitors your customers actually check for which products.
Best for: Commodity-heavy product lines. Categories with published benchmarks. Online or e-commerce channels where price comparison is easy.
4. Value Differentiator
The Value Differentiator model prices above the competitive set and justifies the premium through service, availability, expertise, or total cost of ownership. You're using competitive data as a reference point, not a ceiling.
How it works. You start with competitor pricing to understand the market range, then set your price above it based on the measurable value you deliver beyond the product itself. That value might be same-day delivery, technical support, kitting and assembly, inventory management, or extended warranties. The gap between your price and the market average represents your differentiation premium.
Differentiated Price = Market Price + Value-Add Premium
Example: $47.50 market + $8.50 premium (same-day delivery, technical support) = $56.00
When it fits. Products where you offer measurable advantages beyond the product itself. Customers with high downtime costs who'll pay for reliability and speed. Technical products where your team's expertise reduces the customer's risk. Any situation where the customer's total cost of ownership is lower buying from you, even at a higher unit price.
A $55M industrial distributor I worked with priced bearings 12% above market average. Expensive? Sure. But they stocked 40 sizes that competitors drop-shipped, and their average delivery time was 4 hours versus 3 days. For a manufacturer losing $2,000 per hour of downtime, that premium was nothing. Their win rate on bearing quotes was 78%.
Margin expectations. 30-45% or higher on differentiated categories. This is where real margin lives in distribution. Bain & Company has found that companies with clear value differentiation sustain margins 5-10 percentage points above market average in the product categories where their differentiation is strongest ("Is Pricing Killing Your Profits?" Bain & Company, 2015).
The risk. Overestimating your differentiation. If you price 15% above market but your value-add is "we're friendly and responsive," customers will eventually shop you. The premium has to connect to something the customer can quantify. Also, this model doesn't work for commodity SKUs where you offer no real differentiation -- trying to charge a premium for commodity pipe fittings available from six other local suppliers won't fly.
For a deeper comparison of how value-based and competitive approaches interact, see value-based pricing model.
Best for: Specialty or technical product lines. Distributors with genuine service advantages (same-day delivery, VMI, technical support). Manufacturers with proprietary products or applications engineering capabilities.
5. Market Penetrator
The Market Penetrator model prices below the competitive set to capture market share. It's a land-grab strategy: accept thinner margins now to build volume that improves your cost position later.
How it works. You identify target categories or customer segments and price 10-20% below the prevailing market. The goal isn't to be profitable on those products immediately -- it's to win the customer's business, build switching costs through service and integration, and then gradually move pricing toward market levels as the relationship deepens.
Penetration Price = Market Price x (1 - Discount %)
Example: $47.50 market x (1 - 0.15) = $40.38 (15% below market)
When it fits. Entering a new market or product category. Launching a new branch location and building a customer base. Competing for large contracts where winning the initial business opens up cross-sell opportunities. Also useful when you've got excess inventory to move or you're trying to displace a competitor with a weak service reputation.
Margin expectations. 5-15% gross margins on penetration items. Sometimes break-even. The math only works if you have a clear path to either raising prices over time or making up the margin on related products the customer buys from you once they're in the door.
The risk. This is the most dangerous competitive pricing model. If you don't have a plan to get back to normal margins, you've just trained your customers to expect below-market pricing forever. I've watched distributors penetrate a market, win a bunch of accounts, and then find they can't raise prices without losing them. Three years later they're running 8% gross margins on a customer segment that should be doing 22%.
The other risk: triggering a price war. If the incumbent responds by matching your penetration pricing, both of you end up worse off. Make sure you can sustain the lower price longer than they can -- or target customers they're underserving, so they're less likely to fight for the business.
Best for: New market or geographic expansion. Categories where you have a structural cost advantage competitors can't match. Large contract bids where winning the initial deal leads to significant follow-on business.
Decision Framework: Choosing the Right Competitive Pricing Model
Picking a competitive pricing model isn't a one-time decision for your whole company. It's a product-by-product, segment-by-segment call. Here's how to think through it.
Step 1: Segment Your Catalog
Break your products into three tiers based on competitive intensity and your differentiation level.
| Tier | Characteristics | Typical % of SKUs | Best Model |
|---|---|---|---|
| Commodity | Available from 5+ competitors, price-transparent, low switching cost | 50-65% | Price Matcher or Follower |
| Standard | Available from 2-4 competitors, moderate differentiation possible | 20-35% | Price Follower or Leader |
| Specialty | Few competitors, high switching cost, technical or proprietary | 10-20% | Value Differentiator |
Step 2: Assess Your Competitive Position
For each product tier, honestly evaluate where you stand.
Market share. If you hold 30%+ of the local market in a category, you can lead pricing. Under 15%, you're a follower.
Cost position. Compare your landed cost to what you know about competitors. If your costs are 10%+ lower, you can sustain aggressive pricing. If they're higher, you need to differentiate on value.
Service level. Do you deliver faster, stock deeper, provide better technical support? These are the inputs to your Value Differentiator premium. If your service is comparable to everyone else's, your pricing model needs to reflect that honesty.
Step 3: Map Models to Segments
A realistic model assignment for a $60M industrial distributor with 12,000 SKUs might look like this:
| Segment | SKU Count | Model | Target Margin | Competitive Approach |
|---|---|---|---|---|
| Commodity fasteners | 4,200 | Price Matcher | 18-22% | Stay within 3% of market average |
| Standard electrical | 3,800 | Price Follower | 22-28% | Track regional leader, follow within 30 days |
| Specialty bearings | 2,400 | Value Differentiator | 32-40% | Price 10-15% above market, justify with service |
| New category (safety) | 1,600 | Market Penetrator | 10-15% | Price 12% below market for first 12 months |
Step 4: Set Review Cadence
Different models need different refresh rates.
- Price Matcher: Monthly. You need to keep up with the market.
- Price Follower: Quarterly, or whenever the leader makes a significant move.
- Price Leader: Quarterly. You set the pace, so base updates on your cost changes and margin targets.
- Value Differentiator: Semi-annually. Your premium is based on service capabilities that don't change fast.
- Market Penetrator: Monthly review against a defined exit plan. When do you start migrating prices back toward market?
Step 5: Measure and Adjust
The competitive pricing formula gives you the mechanics. But the real measurement is whether each model is producing the margins you targeted.
Track these three metrics for each segment:
- Realized margin vs. target. Are you hitting the margin range you planned?
- Win rate. Are you winning the deals you should be winning in each tier?
- Price position. Where do your prices actually land versus the competitive set?
If your Price Matcher segment is running at 14% margin instead of the 18-22% target, something's wrong. Either your competitive data is stale, your sales team is discounting beyond what the model calls for, or you've misclassified products that should be in a different tier.
This is exactly the kind of gap a price waterfall analysis surfaces. You see the target margin, the invoiced price, and every discount, rebate, and concession that erodes the difference. Our pricing model guide covers how different models interact with price waterfall analysis.
Common Mistakes With Competitive Pricing Models
Applying one model to everything. A flat "match the market" approach across 10,000 SKUs means you're leaving margin on the 2,000 specialty items where you have real pricing power, while fighting for scraps on the 6,000 commodity items where everyone is doing the same thing.
Using stale data. Competitive pricing based on price sheets from six months ago isn't competitive pricing. It's guessing. In distribution, prices on commodity items can shift 5-10% in a quarter during volatile periods. If your data is stale, your prices are wrong.
Ignoring cost-to-serve. Two customers buying the same product at the same competitive price can have wildly different profitability. One places large, predictable orders. The other calls in emergencies, demands same-day delivery on small quantities, and returns 8% of what they buy. Your competitive pricing model needs to account for who you're selling to, not just what you're selling.
No exit plan for penetration pricing. If you're pricing below market to win business, write down when and how you'll bring prices back up. Pin it on the wall. Share it with the sales team. Because if you don't, "temporary" penetration pricing becomes permanent, and you've just bought yourself a portfolio of unprofitable accounts.
Putting It Together
No competitive pricing model works in isolation. The best mid-market distributors and manufacturers layer two or three models across their catalog, matched to the competitive dynamics of each product segment. They review pricing regularly, measure realized margins against targets, and adjust when the data says they should.
If you're not sure where to start, look at your highest-volume product categories first. Are you leading, following, matching, or just guessing? That answer tells you which model you're already running -- and whether it's the right one. For the fundamentals, start with what is competitive pricing and then work through the framework here to map models to your specific product segments.
The gap between what you charge and what you could charge is where hidden margin lives. Finding it doesn't require enterprise software or a six-month consulting engagement. It starts with knowing which competitive pricing model each part of your catalog deserves.
Last updated: February 14, 2026
Frequently Asked Questions

Want to analyze your entire product catalog?
Pryse automatically identifies margin leakage across thousands of SKUs. Upload your data and find hidden profit in 24 hours.
One-time $1,499 diagnostic. No subscription required.