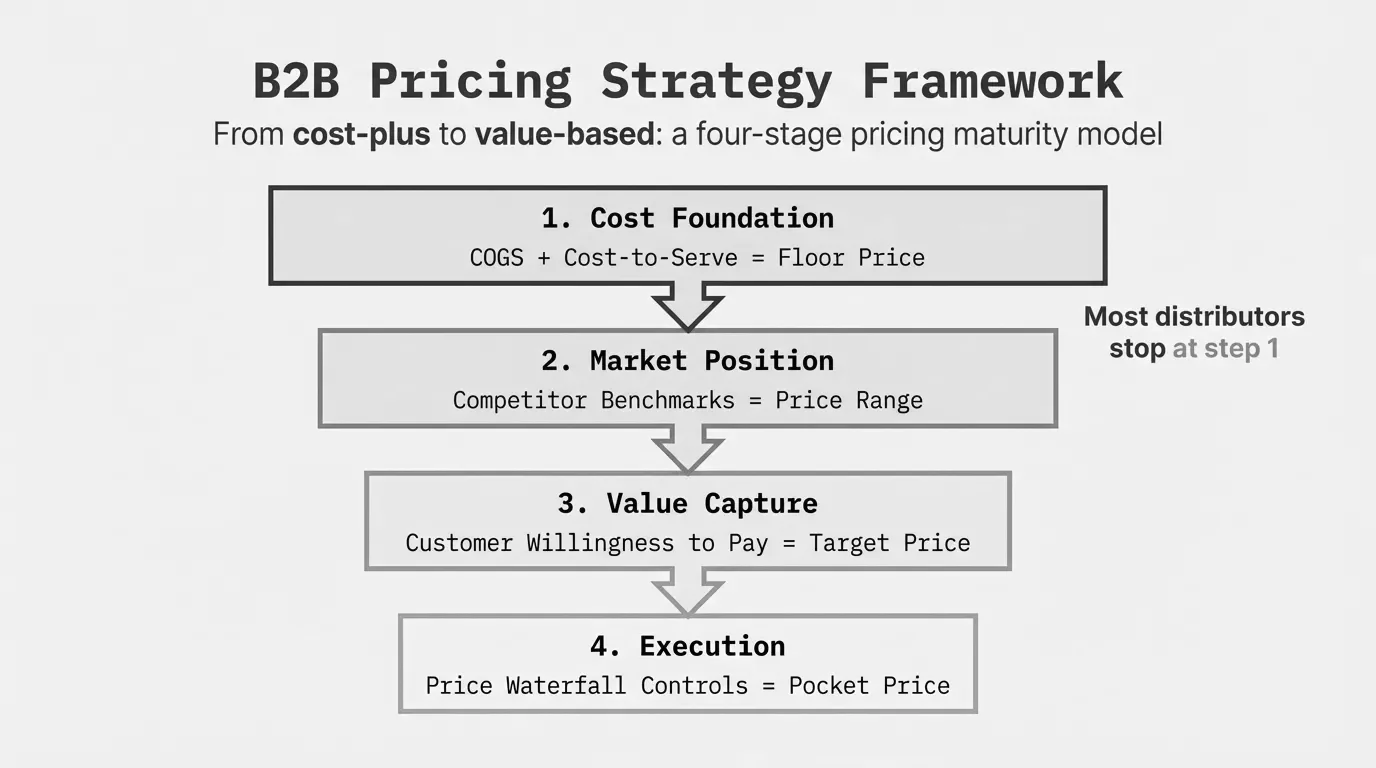
B2B Pricing Strategy: A Practical Guide for Distribution and Manufacturing
How distribution and manufacturing companies can move beyond cost-plus pricing to capture 2-8% more margin. Covers pricing models, price waterfalls, and execution.
A B2B pricing strategy is the system a company uses to determine what each customer pays for each product or service. It goes beyond slapping a markup on cost. It accounts for customer segments, competitive dynamics, product value, and margin targets across thousands of SKUs.
Here's the uncomfortable truth: most mid-market distributors and manufacturers don't really have a pricing strategy. They have a spreadsheet with cost-plus markups and a sales team with too much discount authority. According to McKinsey's 2003 article "The Power of Pricing" in The McKinsey Quarterly, a 1% price increase generates an 8% increase in operating profits for the average S&P 1500 company. For a $50M distributor running 4% operating margins, that 1% translates to $400K in additional profit. Same customers, same products, same headcount.
This guide covers the pricing models that actually work in distribution and manufacturing, where companies lose margin without realizing it, and how to build a strategy that doesn't require a $100K software platform or a year-long consulting engagement.
For the full framework, see our Pricing Strategy Guide.
Why Pricing Is the Highest-Leverage Profit Tool
Revenue growth gets the attention. Cost-cutting gets the quarterly focus. Pricing sits in the corner, untouched.
That's a mistake. As McKinsey's "Pricing: Distributors' most powerful value-creation lever" (2019) showed, a 1% price increase across the portfolio has more impact on EBITDA than a 1% uplift in volume or a 1% cut in procurement costs. A $100M manufacturer that improves realized prices by 2% adds $2M in pure profit. Achieving the same impact through volume would require roughly $40-50M in new sales at typical margins.
Here's what the math looks like:
Profit Impact of 1% Price Improvement = Revenue x 1% x (1 / Operating Margin %)
Example: $100M revenue x 1% = $1M / 5% operating margin = 20% profit increase
Yet most companies spend 10x more time on sales enablement than on pricing discipline. The reason is simple: pricing feels hard. You're managing 10,000+ SKUs across hundreds of customers with different contract terms, volume tiers, and competitive situations. So the default becomes "cost plus 25%" and let the sales team figure it out.
That default is expensive. Traditional distributors leak between 2% and 17.1% margin on average, according to Zilliant's 2020 Global B2B Benchmark Report. On a $75M book of business, that's $1.5M to $12.8M walking out the door every year.
The Three Core B2B Pricing Models
Every B2B pricing strategy builds on one or a combination of three models. Each has a place. None works perfectly alone.
Cost-Plus Pricing
Cost-plus pricing starts with your cost of goods and adds a fixed percentage markup. It's the most common approach in distribution and manufacturing for a reason: it's simple, it's defensible, and it keeps you from selling below cost.
Selling Price = Cost of Goods x (1 + Markup %)
Example: $50 cost x (1 + 0.30) = $65 selling price
When it works: Commodity products where differentiation is low. Pass-through cost increases during inflationary periods. New product categories where you don't have competitive data yet.
When it fails: Cost-plus ignores what customers will actually pay. A 30% markup on a $50 commodity widget might be aggressive. The same 30% on a specialized fitting that saves the customer hours of downtime leaves thousands on the table.
The core problem with pure cost-plus: it treats a $2 fastener and a $200 specialty valve the same way. Your cost structure doesn't determine your customer's willingness to pay.
Competition-Based Pricing
Competition-based pricing sets your prices relative to what competitors charge. You position as a premium, at parity, or below market.
When it works: High-transparency markets where customers actively shop prices. Online channels where comparison is easy. Commodity categories where you can't differentiate.
When it fails: Most distributors don't actually know what competitors charge. They hear anecdotes from sales reps ("the customer said XYZ is cheaper") and react. That's not competitive pricing. That's anecdotal discounting. And it leads to a race to the bottom that compresses everyone's margins.
Simon-Kucher's Global Pricing Study found that 70-80% of companies report a price war in their industry, and their 2017 analysis "Rethinking Price Wars" warns that focusing exclusively on competitors can trigger price wars where everyone loses profitability. In distribution, the better approach is to compete on service, availability, and reliability rather than trying to win every price comparison.
Value-Based Pricing
Value-based pricing sets prices based on the economic value your product or service delivers to the customer, not what it costs you.
When it works: Differentiated products. Technical expertise or value-added services. Situations where you solve a specific, quantifiable problem for the customer. Negotiated pricing for strategic accounts.
When it fails: Commodity products with no differentiation. Situations where the customer has easy substitutes and no switching cost.
Here's a practical example. You sell a specialty adhesive for $45 per unit. Your cost is $18, giving you a 60% gross margin. The next-best alternative costs the customer $30 but requires twice the application time, adding $25 in labor costs per use. The customer's true cost with the alternative: $55. Your $45 price actually saves them $10 per application. You could price at $50 and still deliver value, but at $45 you're leaving $5 per unit on the table because you priced to your cost, not their alternative.
Value-Based Price Ceiling = Next Best Alternative Cost + Switching Costs + Value Differential
Example: $30 + $0 + $25 labor savings = $55 ceiling
The Blended Approach
In practice, most successful distributors and manufacturers use all three. Cost-plus as the floor, competitive data as the reference, and value-based adjustments where you have differentiation. The proportion shifts by product category:
| Product Type | Primary Model | Typical Margin Range |
|---|---|---|
| Commodities (fasteners, wire, pipe) | Cost-plus / competitive | 15-22% |
| Standard products (motors, valves) | Blended | 22-30% |
| Specialty / technical items | Value-based | 28-40% |
| Value-added services (kitting, assembly) | Value-based | 35-50%+ |
The #1 Pricing Mistake: Peanut Butter Pricing
SPARXiQ CEO David Bauders coined the term "peanut butter pricing" and it's the most accurate description of what goes wrong in mid-market distribution. It means spreading the same markup across every product and every customer, like peanut butter on toast.
A flat 28% markup across your entire catalog means you're overcharging on price-sensitive commodities (where customers will switch suppliers over 2%) and undercharging on specialty products (where customers wouldn't blink at paying 15% more).
The impact compounds. Your sales team quotes the commodity items at list price and gets pushed back. They learn to offer discounts to win deals. Now your "28% markup" is really 22% on the items customers care about and 28% on the items they don't price-shop. Your overall realized margin drifts down, and nobody can explain why.
The fix is price segmentation: different strategies for different product-customer combinations. We'll cover how to build this below.
Price Waterfall: Where Your Margin Actually Goes
A price waterfall is the visual breakdown of every deduction between your list price and the cash you actually pocket. It's the single most useful diagnostic tool in B2B pricing, and most companies have never built one.
The waterfall moves through these stages:
- List price - Your published catalog price
- On-invoice adjustments - Volume discounts, contract pricing, promotional pricing, competitive match
- Invoice price - What appears on the customer's bill
- Off-invoice adjustments - Rebates, early payment discounts, freight allowances, returns, warranty claims
- Pocket price - The cash you actually collect
Most distributors stop tracking at the invoice level. They look at invoice price and think that's their margin. But off-invoice deductions typically add another 7-15 percentage points of erosion.
Here's a concrete example. A $100 list-price item:
| Waterfall Stage | Deduction | Running Price |
|---|---|---|
| List price | - | $100.00 |
| Volume discount (8%) | -$8.00 | $92.00 |
| Contract discount (5%) | -$4.60 | $87.40 |
| Competitive match (3%) | -$2.62 | $84.78 |
| Invoice price | $84.78 | |
| Cash discount 2/10 net 30 | -$1.70 | $83.08 |
| Free freight | -$3.50 | $79.58 |
| Restocking/returns (1.5%) | -$1.19 | $78.39 |
| Pocket price | $78.39 |
That's a 21.6% gap between list and pocket price. The invoice showed 15.2%. The real number is nearly 22%. Multiply that hidden 6.4% across millions in revenue and you see where the profit goes.
For a deeper walkthrough, see our guide on pocket price waterfall analysis.
Building a B2B Pricing Strategy: Step by Step
Here's the practical roadmap. This isn't a 12-month consulting project. A mid-market company with decent transaction data can get through this in weeks, not quarters.
Step 1: Map Your Current State
Before you optimize anything, you need to know what's actually happening. Pull 12 months of transaction data and calculate:
- Realized margin by product category. Not list margin. Actual pocket margin after all adjustments.
- Realized margin by customer. Your top 20 customers by revenue aren't necessarily your top 20 by profitability.
- Discount frequency and magnitude. How often are sales reps overriding prices? By how much?
Most companies are shocked by what they find. I've seen distributors where the top customer by revenue was the 47th most profitable customer. They were buying high-volume commodity products with heavy negotiated discounts, free freight, and extended payment terms. Revenue looked great. Margin was anemic.
Step 2: Segment Products and Customers
Not every SKU deserves the same pricing attention. Segment your catalog:
Product segments:
- A items (top 20% by revenue): High visibility, competitively shopped. Price tight to market.
- B items (middle 30%): Moderate volume, less price sensitivity. Opportunity for margin improvement.
- C items (bottom 50%): Long tail. Low volume, rarely compared. Highest margin opportunity.
Customer segments:
- Strategic (high volume, high growth potential): Tighter margins, longer-term view.
- Core (steady, reliable business): Target margins, standard terms.
- Opportunistic (low volume, high maintenance): Premium pricing or improve-or-exit.
The intersection of these two dimensions creates your pricing matrix. A strategic customer buying A items gets the sharpest pricing. An opportunistic customer buying C items gets full margin. This is the opposite of peanut butter pricing.
Step 3: Set Margin Targets by Segment
Now set specific margin targets for each cell in your matrix. These aren't aspirational. They're guardrails.
| Segment | A Products | B Products | C Products |
|---|---|---|---|
| Strategic customers | 18-22% | 24-28% | 28-34% |
| Core customers | 22-26% | 28-32% | 32-38% |
| Opportunistic customers | 26-30% | 32-36% | 36-42% |
These numbers will vary by industry. An electrical distributor's ranges will differ from an industrial MRO distributor's. The structure is what matters: differentiated targets that reflect the value exchange in each cell.
Step 4: Build Discount Guardrails
Sales rep discretion is where pricing strategy goes to die. Without guardrails, reps will discount to win every deal, because their incentives usually reward revenue, not margin.
Effective guardrails include:
- Floor prices per product-customer segment (non-negotiable minimums)
- Approval thresholds (reps can discount 3% freely, 3-7% needs manager approval, 7%+ needs VP approval)
- Deal scoring that factors margin into win/loss decisions
- Visibility so managers can see discount patterns in real time
The goal isn't to eliminate discounting. It's to make it intentional. A 5% discount to defend a strategic account against a competitive bid is smart. A 5% discount because the rep didn't want to push back on a price objection is margin leakage.
For more on managing contract pricing, see our dedicated guide.
Step 5: Tackle Off-Invoice Leakage
This is where the quick wins hide. Off-invoice costs are often set-and-forget policies that nobody's reviewed in years:
- Freight: Are you eating shipping costs on orders that don't justify it? Set minimum order thresholds for free freight. A $150 order with $12 in shipping costs at 25% margin generates $25.50 in gross profit. The freight eats 47% of that.
- Payment terms: 2% for paying within 10 days (2/10 net 30) made sense when interest rates were low. At current rates, you're offering customers a 36% annualized return on early payment. Tighten or eliminate.
- Returns and restocking: A blanket returns policy with no restocking fee invites abuse. Track return rates by customer and product. Charge restocking fees on non-defective returns.
- Rebates: Ensure rebate thresholds actually require stretch behavior. If 80% of customers hit the top tier automatically, you're just reducing price with extra paperwork.
Step 6: Review and Adjust Quarterly
Pricing isn't a set-it-and-forget-it exercise. During the 2022-2024 inflation spike, some manufacturers adjusted prices nine times in a single year. The old model of annual price increases is dead.
Build a quarterly pricing review that covers:
- Cost changes from suppliers (pass through within 30 days, not 90)
- Competitive shifts in key product categories
- Margin performance vs. targets by segment
- Discount override frequency and magnitude
- New product introductions that need pricing
Pricing Strategy for Distributors vs. Manufacturers
While the fundamentals overlap, distributors and manufacturers face different pricing challenges.
Distribution-Specific Considerations
Distributors sit between manufacturers and end customers. Your pricing strategy has to account for:
- Supplier price changes that you need to pass through without eating margin
- Customer-specific pricing across hundreds of accounts with different negotiated rates
- Competitive transparency where customers can check prices across multiple distributors
- Rebate complexity with both supplier rebates (earned on purchases) and customer rebates (paid on sales)
- Cost-to-serve variation where a $500 order delivered to a job site costs you more than a $5,000 order picked up at your counter
For distributor-specific margins and benchmarks, see our distributor margins analysis. For channel-specific pricing, check out our dealer pricing strategy guide.
Manufacturing-Specific Considerations
Manufacturers have different levers:
- Product cost variability based on raw materials, batch sizes, and production complexity
- Volume-price relationships that reflect actual cost economies of scale
- Channel pricing across direct sales, distributors, and OEM relationships
- Custom/configured products where each quote is unique
- International pricing with currency exposure and regional market dynamics
Manufacturers often have more pricing power than they think, particularly on engineered or specialty products. The key is quantifying the value you deliver relative to alternatives.
Common B2B Pricing Strategy Mistakes
After six years of pricing work across distribution and manufacturing, these are the patterns I see repeatedly:
Treating all discounts as equal. A volume discount that rewards purchase commitment is fundamentally different from an ad-hoc competitive match. One builds loyalty. The other trains customers to ask for discounts.
Ignoring the tail. The bottom 50% of your SKUs often represent less than 10% of revenue but carry the highest potential margin. Nobody price-shops a $4 specialty fitting. Yet companies apply the same "competitive" markup as they do on high-visibility items.
Reacting to sales rep feedback as market data. When a rep says "the customer says they can get it cheaper," that's one data point filtered through someone whose compensation depends on closing the deal. Verify competitive claims before adjusting price.
Annual price increases as a strategy. Sending out a blanket 3-5% increase letter once a year isn't a strategy. It's a ritual. Strategic pricing means different increases for different products based on cost changes, competitive position, and margin performance.
No visibility into pocket price. If you can't calculate your pocket margin on any given customer-product combination within 30 seconds, you don't have a pricing strategy. You have a pricing hope.
Getting Started Without Enterprise Software
You don't need PROS, Vendavo, or Zilliant to improve your B2B pricing. Those platforms make sense at scale, but a $50M distributor can start with what they have.
Week 1-2: Export 12 months of transaction data from your ERP. Calculate realized margin by customer and product category. Identify your top 10 margin leakage sources.
Week 3-4: Build your product-customer segmentation matrix. Set target margins for each cell. Identify the biggest gaps between current and target.
Month 2: Implement discount guardrails. Start with the sales reps who override prices most frequently. Track override frequency weekly.
Month 3: Tackle the top 3 off-invoice leakage sources. Usually it's freight policy, payment terms, and one customer-specific accommodation that's grown beyond its original intent.
Ongoing: Quarterly pricing reviews. Monthly margin reporting by segment. Continuous refinement.
The companies that see the fastest results aren't the ones that buy the fanciest tools. They're the ones that start measuring what's actually happening to their prices between list and pocket. Pryse builds that visibility in 24 hours from a CSV upload, not six months.
For more on pricing strategy fundamentals, see our complete Pricing Strategy Guide.
Last updated: Invalid Date
Frequently Asked Questions

Want to analyze your entire product catalog?
Pryse automatically identifies margin leakage across thousands of SKUs. Upload your data and find hidden profit in 24 hours.
One-time $1,499 diagnostic. No subscription required.