Pricing Methodology: How to Pick the Right One for Distribution and Manufacturing
A pricing methodology is the structured system behind how you set, adjust, and defend prices. Here's how distributors and manufacturers choose the right one.
A pricing methodology is the structured, repeatable system behind how a company sets its prices. It's not a gut feeling. It's not "whatever the sales rep thinks will close the deal." It's the defined process that takes inputs — cost data, market signals, customer value — and produces a defensible price for every SKU in the catalog.
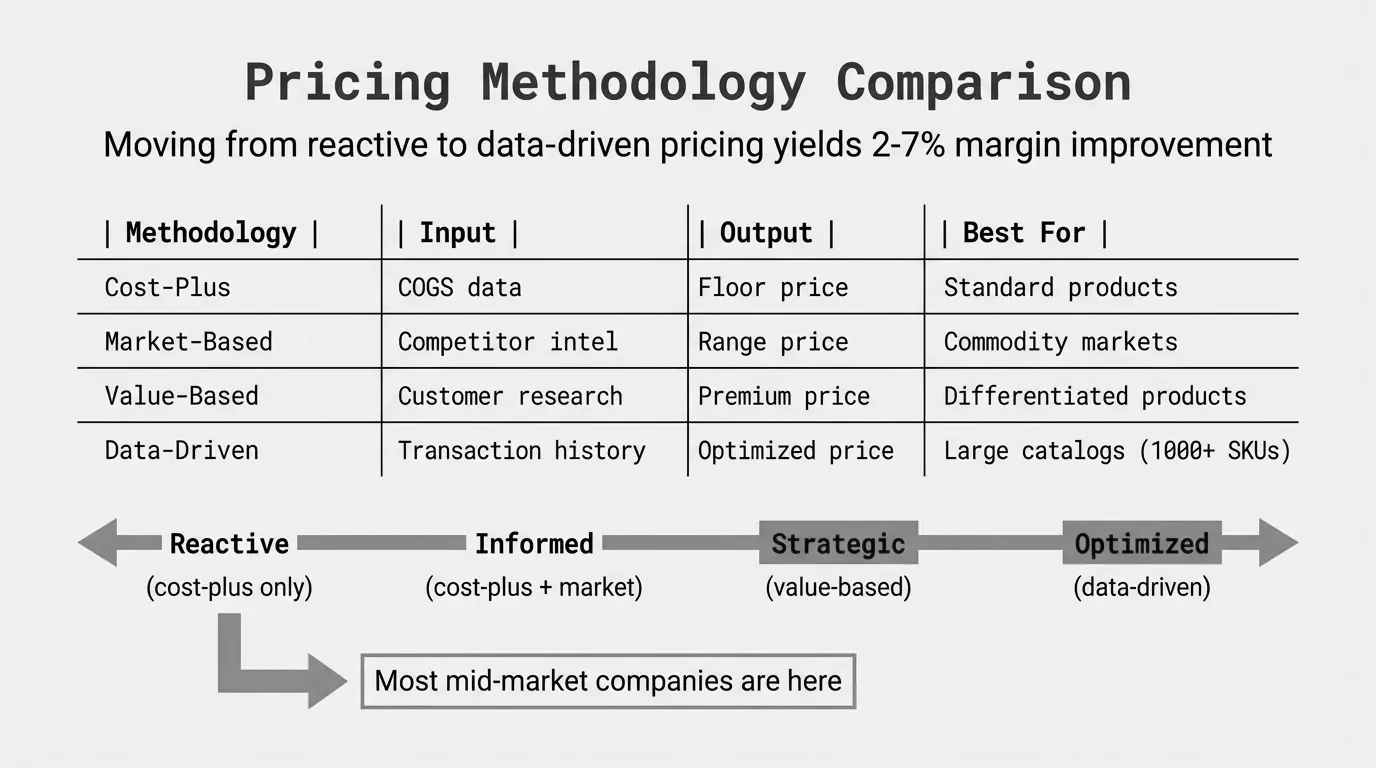
Most mid-market distributors and manufacturers don't actually have a pricing methodology. They have a markup percentage in a spreadsheet and a collection of informal rules that vary by sales rep. That's not a methodology. That's institutional habit. And it's costing real money.
According to Bain & Company's 2018 survey of 1,700 B2B companies, published in Harvard Business Review as "A Survey of 1,700 Companies Reveals Common B2B Pricing Mistakes," a 1% improvement in realized price drives an 8% increase in operating profit. For a $50M distribution business running 4% operating margins, that 1% translates to roughly $400K in additional profit. Same customers. Same products. The only thing that changed was how prices were set.
This guide walks through the pricing methodologies that actually work in distribution and manufacturing, how to pick the right one for your business, and how to implement it without a $100K software platform. For the broader strategic framework, see our Pricing Strategy Guide.
Pricing Methodology vs. Pricing Strategy: They're Not the Same Thing
People use these terms interchangeably. They shouldn't.
Pricing strategy is the plan. It answers questions like: Are we a premium player or a value competitor? Are we optimizing for volume or margin? Which customer segments matter most? Your strategy is directional. It sets the destination.
Pricing methodology is the engine. It's the specific system — formulas, rules, data inputs, approval workflows — that translates strategy into thousands of individual prices across your catalog. Methodology is execution.
A distributor might have a strategy that says "maximize margin on specialty products while staying competitive on commodity items." The methodology is what makes that operational: cost-plus at 20% for commodity SKUs, value-based pricing for specialty items, competitive benchmarking for the top 200 products by volume.
You can have a great strategy and a broken methodology. That's a company where leadership talks about "value-based pricing" but every quote still starts with cost times 1.30. Strategy without methodology is a PowerPoint deck.
The Four Core Pricing Methodologies
Every pricing approach in B2B distribution and manufacturing traces back to one of four methodologies. Each uses different inputs, produces different outcomes, and fits different situations.
1. Cost-Plus Pricing Methodology
Cost-plus is the starting point for most companies. Calculate your landed cost, add a fixed markup, and that's your selling price.
Selling Price = Landed Cost x (1 + Markup %)
Example: $42.00 landed cost x (1 + 0.30) = $54.60 selling price
Where it works well: Commodity products with low differentiation. Pass-through pricing during inflationary periods. New products where you don't have competitive data or value benchmarks yet.
Where it breaks down: Cost-plus doesn't account for what customers will actually pay. A 30% markup on a $3 fastener produces $0.90 in gross profit. The same 30% on a $300 specialty valve produces $90. But the specialty valve might easily sell at 45% markup — the customer has no alternative and isn't price-shopping it. Cost-plus leaves that money on the table.
The deeper problem is what SPARXiQ calls "peanut butter pricing" — spreading the same markup across the entire catalog like peanut butter on toast. It overprices commodities where customers will switch over 2%, and underprices specialty items where customers wouldn't blink at 15% more.
Typical margin outcome: 20-28% gross margin, but with significant variance between what you could capture and what you actually do.
2. Competitive Pricing Methodology
Competitive pricing sets your prices relative to what competitors charge. You position above, at parity, or below market depending on your value proposition and the specific product category.
Where it works well: High-transparency markets where customers actively shop prices. E-commerce channels where comparison is one click away. Standard products where multiple distributors carry the same manufacturer's SKUs.
Where it breaks down: Most distributors don't actually have reliable competitive data. They have anecdotes. A sales rep says "the customer told me ABC Supply is $2 cheaper." That's not competitive intelligence. That's a negotiating tactic from a buyer who wants a discount.
Simon-Kucher, the pricing consultancy, warns that reactive competitive pricing often triggers a race to the bottom. You drop to match a rumored competitor price. They hear about your new price and drop further. Everyone's margins compress and nobody wins.
The real issue with pure competitive pricing in distribution: your costs are different from your competitor's costs. Their freight structure, their supplier rebate tiers, their cost-to-serve model — none of it matches yours. Pricing to their number without understanding their economics is guessing with extra steps.
Typical margin outcome: 18-25% gross margin, heavily dependent on competitive intensity in your market.
3. Value-Based Pricing Methodology
Value-based pricing sets prices according to the economic value your product or service delivers to the customer, rather than what it costs you to provide it.
Value-Based Price Ceiling = Customer's Next Best Alternative Cost + Switching Costs + Quantified Value Differential
Example: $30 alternative + $5 switching cost + $25 labor savings = $60 ceiling
Here's a concrete scenario. You sell a specialty cutting fluid for $85 per gallon. Your cost is $34, giving you a 60% gross margin. The next-best alternative costs the customer $55 but requires twice the changeover time, adding $40 in downtime costs per application. The customer's true cost with the alternative: $95. Your $85 price already delivers $10 in savings. But you could price at $90 and still give the customer a better deal than the alternative.
Where it works well: Differentiated products. Value-added services like kitting, custom assembly, or technical support. Situations where you solve a specific, quantifiable problem. Products with no direct commodity equivalent.
Where it breaks down: Commodity products where substitution is easy and switching costs are zero. Markets where the customer genuinely has five identical options. And practically speaking, value-based pricing requires understanding your customer's economics, which takes more work than pulling up a cost sheet.
Typical margin outcome: 30-50%+ gross margin on products where it applies, but it won't apply to the full catalog.
4. Margin-Based Pricing Methodology
Margin-based pricing works backward from a target profit outcome. Instead of starting with cost and adding markup, or starting with competitor prices and matching them, you define the margin you need to hit by product-customer segment and set prices accordingly.
Target Selling Price = Cost / (1 - Target Margin %)
Example: $42.00 cost / (1 - 0.35) = $64.62 selling price for 35% target margin
This is subtly different from cost-plus. Cost-plus says "add 30%." Margin-based says "we need 35% gross margin on this segment, what price achieves that?" The distinction matters because margin-based pricing forces you to think about the outcome (profitability) rather than the input (markup percentage).
Where it works well: Companies with clear profitability targets by segment. Businesses where different product categories need different margin floors. Situations where you need to work backward from an operating profit target.
Where it breaks down: If your target margins aren't grounded in market reality, you'll set prices that customers won't pay. Margin-based pricing needs competitive and value-based data as guardrails.
Typical margin outcome: Depends entirely on how well the targets are calibrated. Done right, 25-40% gross margin across the blended catalog.
How to Choose the Right Methodology for Your Business
The answer for almost every mid-market distributor and manufacturer is the same: you don't pick one. You pick several and apply each where it fits.
Here's a practical framework for segmenting your catalog by methodology:
| Product Category | Recommended Methodology | Why |
|---|---|---|
| Commodities (fasteners, wire, pipe fittings) | Competitive + cost floor | Customers actively price-shop these items |
| Standard products (motors, valves, pumps) | Cost-plus with margin targets | Moderate price sensitivity, stable costs |
| Specialty / technical items | Value-based | Low substitutability, high value delivered |
| Value-added services (kitting, assembly, VMI) | Value-based | Service value far exceeds your cost |
| New / unproven products | Cost-plus initially | No market data yet; adjust as data accumulates |
The key insight from L.E.K. Consulting's Pricing & Revenue Optimization practice, which has documented profit improvements of 300-600 basis points at national retailers through targeted pricing segmentation, is that optimal segmentation — matching the right methodology to the right product-customer combination — drives more profit improvement than any single methodology applied uniformly.
Matching Methodology to Customer Segments
Product type isn't the only dimension. Customer segments need different treatment too:
- Strategic accounts (high volume, growth potential): Tighter margins, longer-term view. Competitive methodology ensures you hold the business.
- Core accounts (steady, reliable): Margin-based methodology hits your profitability targets without over-discounting.
- Opportunistic accounts (low volume, transactional): Value-based pricing captures the full margin these accounts can support.
For more on how to structure this by customer tier, see our B2B pricing strategy breakdown and our guide on tiered pricing.
Implementing a Pricing Methodology: The 90-Day Playbook
You don't need enterprise software to implement a pricing methodology. A mid-market company with 12 months of transaction data in their ERP can get this done in a quarter.
Weeks 1-2: Diagnose the Current State
Pull your transaction data and answer three questions:
-
What's your realized margin by product category? Not list margin. Actual pocket margin after every discount, rebate, freight charge, and credit memo. Most companies are shocked by the gap between what they think they're making and what they actually pocket.
-
What's your realized margin by customer? Your top 10 revenue customers are almost never your top 10 profit customers. Revenue without margin data is a vanity metric.
-
How much price variation exists within the same product-customer segment? If you're charging Customer A $54 and Customer B $67 for the same SKU with similar volumes, you don't have a methodology. You have chaos.
This diagnostic phase is exactly what Pryse automates. Upload your transaction CSV and get margin leakage analysis in 24 hours instead of weeks of spreadsheet work.
Weeks 3-4: Segment and Set Targets
Build your product-customer segmentation matrix. Start simple — three product tiers (A/B/C by volume) and three customer tiers (strategic/core/opportunistic). That gives you nine cells. Assign a pricing methodology and target margin range to each.
| Segment | A Products (Commodities) | B Products (Standard) | C Products (Specialty) |
|---|---|---|---|
| Strategic customers | Competitive, 18-22% | Cost-plus, 24-28% | Value-based, 28-34% |
| Core customers | Cost-plus, 22-26% | Margin-based, 28-32% | Value-based, 32-38% |
| Opportunistic customers | Cost-plus, 26-30% | Margin-based, 32-36% | Value-based, 36-42% |
These ranges will vary by industry. An electrical distributor's ranges differ from an industrial MRO distributor's. The structure is what matters.
Weeks 5-8: Build Guardrails and Reprice
Take the biggest gaps between current realized margins and targets. Reprice those first. In most catalogs, 20% of SKUs drive 80% of the margin leakage.
Build discount guardrails so sales reps can't immediately erode the new prices:
- Floor prices per segment (non-negotiable minimums)
- Approval thresholds (rep discretion up to 3%, manager to 7%, VP above that)
- Visibility into override patterns (weekly reporting on discount frequency and magnitude)
For specific guidance on structuring contract pricing within this framework, see our contract pricing guide.
Weeks 9-12: Tackle Off-Invoice Leakage
Your pricing methodology might be perfect on paper and still leak margin through off-invoice channels. These are the costs that don't show up on the invoice but eat your pocket margin:
- Freight absorption on small orders. A $150 order with $12 in shipping at 25% margin generates $25.50 in gross profit. Freight eats 47% of it. Set minimum order thresholds.
- Early payment discounts. 2/10 net 30 gives customers a 36% annualized return. At current interest rates, that's a gift.
- Unearned rebates. If 80% of customers automatically hit the top rebate tier, you've just reduced your price with extra paperwork.
For a full breakdown of the price waterfall from list to pocket, see our pocket price waterfall analysis.
Why Most Pricing Methodology Transitions Fail
I've watched companies invest months in selecting a new pricing methodology, build beautiful segmentation matrices, and then watch the whole thing collapse within a quarter. The methodology wasn't the problem. The execution was.
Failure mode #1: No sales team buy-in. If your sales reps don't understand why prices changed and how to defend them, they'll override every new price within a week. Include them in the process. Give them talk tracks for price objections. Show them how the new methodology protects their commission on high-margin deals.
Failure mode #2: Setting it and forgetting it. A pricing methodology needs feeding. Cost data changes. Competitors adjust. Customer mix shifts. Build a quarterly review cycle where you recalibrate targets and address drift. During inflationary periods, monthly isn't overkill.
Failure mode #3: Perfect is the enemy of done. Some companies spend a year building a 47-segment matrix with custom formulas for each cell. By the time they launch, the market has moved. Start with a 9-cell matrix. Get it into production. Refine from there.
Failure mode #4: Ignoring the data foundation. Every pricing methodology is only as good as the data behind it. If your cost data is 90 days stale, your ERP has duplicate customer records, and your rebate accruals are tracked in someone's personal spreadsheet, no methodology will save you. Clean the data first. It doesn't need to be perfect — SPARXiQ's distribution pricing research notes that data management doesn't have to be perfect to measurably improve pricing accuracy — but it needs to be directionally reliable.
Measuring Whether Your Methodology Works
You need three metrics to know if your pricing methodology is producing results:
1. Realized margin vs. target margin by segment. Track the gap between what your methodology says you should earn and what you actually pocket. This is your methodology effectiveness score. Below 85% realization means something is broken — either the targets are unrealistic or the guardrails aren't holding.
2. Price variance within segments. For any given product-customer segment, how much do actual transaction prices vary? High variance means the methodology isn't being followed consistently. A standard deviation above 5% of the target price signals a problem.
3. Override frequency and magnitude. What percentage of quotes involve a price override? What's the average discount depth on overrides? A healthy range is 15-25% override rate with average discounts under 5%. Above that, your methodology exists on paper but not in practice.
Methodology Effectiveness = (Actual Realized Margin / Target Margin) x 100
Example: 26.4% realized / 30% target = 88% effectiveness
Track these monthly. Share them with sales leadership. When methodology effectiveness dips, investigate before it becomes a trend.
Pricing Methodology by Industry Vertical
While the four core methodologies apply broadly, their mix shifts by industry:
Industrial distribution: Heavy on competitive pricing for A items (customers shop these aggressively). Value-based for specialty items and services. Typical blended gross margin target: 24-30%.
Building materials distribution: Cost-plus dominates due to volatile commodity pricing. Quick pass-through of cost changes is more important than methodology sophistication. Typical target: 22-28%.
Electrical distribution: Competitive methodology for wire and commodity items. Margin-based for lighting, controls, and automation products. Growing use of value-based pricing for energy efficiency solutions. Typical target: 20-26%.
Manufacturing (discrete): Cost-plus for standard catalog products. Value-based for engineered-to-order and configured products. Margin-based for spare parts (which often carry 50%+ margins). Typical target: 30-40%.
Manufacturing (process): Formula-based pricing tied to raw material indices. Cost-plus with automatic escalation clauses. Less room for value-based pricing on commodity outputs. Typical target: 25-35%.
For industry-specific margin benchmarks, see our analyses of distributor margins by industry and manufacturer profit margins.
Getting Started Today
If you've read this far and your current pricing methodology is "cost plus whatever feels right," here's the single highest-impact thing you can do this week: export 12 months of transaction data and calculate your realized pocket margin by customer.
Not list margin. Not invoice margin. Pocket margin — after every discount, rebate, freight charge, early payment deduction, return, and credit memo.
Most companies find 2-7% of margin they didn't know they were losing. On a $50M book, that's $1M to $3.5M in annual profit hiding in plain sight.
Pryse does this analysis in 24 hours from a CSV upload. No implementation. No six-month consulting engagement. Upload your data, see where the margin goes, and decide which methodology fixes the biggest leaks first.
For the complete strategic framework that wraps around your methodology choices, see our Pricing Strategy Guide.
Last updated: February 1, 2026
Frequently Asked Questions

Want to analyze your entire product catalog?
Pryse automatically identifies margin leakage across thousands of SKUs. Upload your data and find hidden profit in 24 hours.
One-time $1,499 diagnostic. No subscription required.