Competitive Pricing Formulas: CPI, Price Position, and Gap Analysis (With Excel)
The 4 competitive pricing formulas you actually need: CPI, Price Position %, Price Gap, and Price Band. Worked examples with Excel formulas for distributors.
There's no single "competitive pricing formula." There are four, and each one answers a different question about where you stand relative to the market.
I've spent years watching mid-market distributors try to price competitively using gut feel and whatever their reps heard on the last sales call. That doesn't scale when you've got 10,000+ SKUs. What scales is math. Specifically, four formulas that give you a real, repeatable read on your competitive position.
This is the reference page. Bookmark it. Every formula below includes the math, a worked distribution example, and an Excel formula you can copy straight into your spreadsheet.
For the broader strategy behind when and how to use these numbers, see our competitive pricing guide.
Formula 1: Competitive Price Index (CPI)
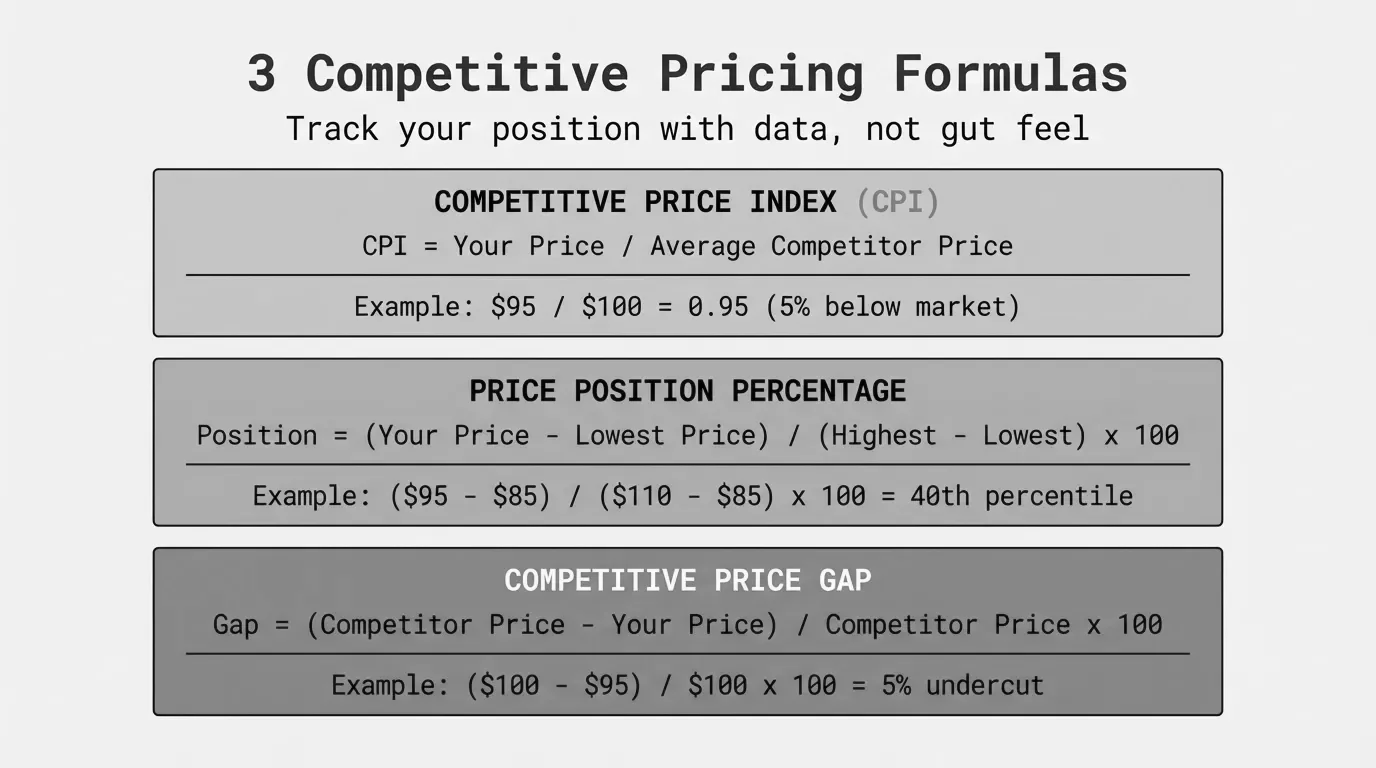
The Competitive Price Index is the single most useful number in competitive pricing. It tells you, on a scale around 100, where your price sits relative to the market average.
CPI = (Your Price / Market Average Price) x 100A CPI of 100 means you're priced exactly at the market average. Above 100, you're more expensive. Below 100, you're cheaper.
Worked example: Industrial fastener distributor
You sell a 100-pack of hex bolts for $18.75. You track four competitors:
| Competitor | Price |
|---|---|
| Competitor A | $17.50 |
| Competitor B | $19.20 |
| Competitor C | $18.00 |
| Competitor D | $17.80 |
Market Average = ($17.50 + $19.20 + $18.00 + $17.80) / 4 = $18.13
CPI = ($18.75 / $18.13) x 100 = 103.4
Your CPI is 103.4. You're priced 3.4% above the competitive average on this SKU. Whether that's a problem depends on context. If you offer same-day delivery and the others ship in 3-5 days, a 3.4% premium is easily justified. If you're all selling the exact same product with identical service, you'll lose the price shoppers.
Excel formula:
Assuming your price is in B2 and competitor prices are in C2 through F2:
=ROUND((B2/AVERAGE(C2:F2))*100, 1)
Interpreting CPI at scale:
The real power of CPI shows up when you calculate it across your entire catalog. Sort by CPI and you'll see three groups:
| CPI Range | What It Means | Action |
|---|---|---|
| Below 95 | You're significantly cheaper than market | Investigate. You may be leaving money on the table. |
| 95 to 105 | You're in line with market | Monitor. No urgent action needed. |
| Above 105 | You're priced above market | Check if differentiation justifies it. If not, adjust. |
A distributor I worked with ran CPI on their top 500 SKUs and found 120 of them sitting below 92. They'd been underpricing those items for years because their cost-plus markup hadn't kept pace with competitor price increases. Adjusting just those 120 SKUs added $340,000 in annual gross profit without losing a single customer.
Formula 2: Price Position Percentage
CPI compares you to the average. Price Position Percentage tells you where you fall within the range from cheapest to most expensive competitor.
Price Position % = ((Your Price - Min Price) / (Max Price - Min Price)) x 100A result of 0% means you're the cheapest. 100% means you're the most expensive. 50% puts you in the middle of the pack.
Worked example: Electrical supply distributor
You sell a 200-amp panel for $312. Competitor prices range from $285 to $345.
Price Position % = (($312 - $285) / ($345 - $285)) x 100
Price Position % = ($27 / $60) x 100
Price Position % = 45%
You're positioned at 45%: slightly below the midpoint of the competitive range. That's a solid position for a distributor that competes on reliability and availability rather than rock-bottom price.
Excel formula:
Assuming your price is in B2 and competitor prices are in C2 through G2:
=ROUND(((B2-MIN(C2:G2))/(MAX(C2:G2)-MIN(C2:G2)))*100, 1)
Why this matters more than CPI sometimes:
CPI can mislead you when there's an outlier. Say four competitors price a product at $50, $51, $52, and $90. The average is $60.75, and your $53 price gives you a CPI of 87.2, making it look like you're way below market. But Price Position % tells a more honest story:
Price Position % = (($53 - $50) / ($90 - $50)) x 100 = 7.5%
You're at the very bottom of the range. That CPI of 87 wasn't because you're cheap. It was because one expensive outlier skewed the average. Price Position % catches that.
Formula 3: Price Gap Analysis
Price Gap tells you the percentage difference between your price and a specific competitor's price. It's the most granular of the four formulas: one-to-one, not one-to-many.
Price Gap % = ((Your Price - Competitor Price) / Competitor Price) x 100Positive means you're more expensive. Negative means you're cheaper.
Worked example: Plumbing supply distributor
You want to understand your position against your top 3 competitors on a commercial faucet valve:
| Your Price | Comp A | Comp B | Comp C | |
|---|---|---|---|---|
| Price | $67.50 | $62.00 | $69.00 | $64.50 |
| Gap vs. You | -- | +8.9% | -2.2% | +4.7% |
Gap vs. Comp A = (($67.50 - $62.00) / $62.00) x 100 = +8.9%
Gap vs. Comp B = (($67.50 - $69.00) / $69.00) x 100 = -2.2%
Gap vs. Comp C = (($67.50 - $64.50) / $64.50) x 100 = +4.7%
You're 8.9% above Competitor A (the low-price leader), 2.2% below Competitor B, and 4.7% above Competitor C. If A is winning deals away from you, that 8.9% gap is the number your sales team needs to understand.
Excel formula:
Assuming your price is in B2 and a competitor's price is in C2:
=ROUND(((B2-C2)/C2)*100, 1)
Using gaps to set pricing rules:
Once you've calculated gaps across your catalog, you can build rules into your pricing matrix. For example:
- On commodity SKUs: maintain a gap of -2% to +3% against the market leader
- On specialty SKUs: allow gaps up to +15% if you're the stocking distributor
- On private label: price at -5% to -10% vs. the branded equivalent
These gap-based rules are more market-aware than flat cost-plus markups. A 30% markup might put you 12% above market on one product and 8% below on another. Gap-based rules keep you positioned consistently.
For more on how to build a complete competitive pricing analysis, see our step-by-step breakdown.
Formula 4: Competitive Price Band
The Price Band defines the range within which competitors price a given product. It's not about where you are. It's about where everyone is.
Price Band Width = Max Competitor Price - Min Competitor Price
Band Width % = ((Max Price - Min Price) / Min Price) x 100
Midpoint = (Max Price + Min Price) / 2
Worked example: HVAC parts distributor
You're analyzing a condensate pump across 6 competitors:
| Competitor | Price |
|---|---|
| A | $142.00 |
| B | $155.00 |
| C | $148.50 |
| D | $139.00 |
| E | $161.00 |
| F | $144.75 |
Price Band Width = $161.00 - $139.00 = $22.00
Band Width % = (($161.00 - $139.00) / $139.00) x 100 = 15.8%
Midpoint = ($161.00 + $139.00) / 2 = $150.00
The competitive band is $22 wide, spanning a 15.8% range. The midpoint is $150.
Excel formulas:
Assuming competitor prices are in C2 through H2:
Band Width:   =MAX(C2:H2)-MIN(C2:H2)
Band Width %: =ROUND(((MAX(C2:H2)-MIN(C2:H2))/MIN(C2:H2))*100, 1)
Midpoint:     =(MAX(C2:H2)+MIN(C2:H2))/2
What the band width tells you:
Narrow bands (under 10%) signal commodity products where the market has converged on a price. There's little room to differentiate on price alone. Wide bands (over 20%) usually mean there's real differentiation happening: some suppliers bundle services, carry premium brands, or serve different customer tiers.
Here's a framework I've seen work well:
| Band Width % | Product Type | Your Strategy |
|---|---|---|
| Under 8% | Pure commodity | Price at or just below midpoint. Compete on availability and service. |
| 8% to 15% | Standard competitive | Position based on your service level vs. competitors. |
| 15% to 25% | Differentiated | Price above midpoint if you add value. Below if you don't. |
| Over 25% | Fragmented market | Segment by customer type. Different customers tolerate different price points. |
Putting the four formulas together
Each formula gives you one angle. Used together, they give you a complete competitive pricing picture. Here's how they connect on a single SKU:
Product: 3/4" brass ball valve
| Metric | Value | What It Tells You |
|---|---|---|
| Your Price | $24.50 | -- |
| Market Average | $23.20 | -- |
| CPI | 105.6 | You're 5.6% above the market average |
| Price Position % | 62.5% | You're in the upper third of the range |
| Gap vs. Low-Price Leader | +14.1% | You're notably more expensive than the cheapest |
| Gap vs. Premium Competitor | -6.8% | You're cheaper than the most expensive |
| Band Width % | 22.3% | Moderate differentiation in this market |
Now you can make an informed call. A CPI of 105.6 on a commodity item with a 22% band is reasonable if your fill rate is 95%+ and you ship same-day. It's not if you're selling the exact same product with identical service levels. The formulas don't make the decision. They give you the numbers to make a good one.
Building a competitive pricing tracker in Excel
Here's a practical layout for tracking competitive pricing across your key SKUs. Set it up once, update the competitor prices periodically, and the formulas do the rest.
Column layout:
| Column | Content |
|---|---|
| A | SKU / Part Number |
| B | Your Price |
| C-G | Competitor 1-5 Prices |
| H | Market Average: =AVERAGE(C2:G2) |
| I | CPI: =ROUND((B2/H2)*100,1) |
| J | Min Price: =MIN(C2:G2) |
| K | Max Price: =MAX(C2:G2) |
| L | Price Position %: =ROUND(((B2-J2)/(K2-J2))*100,1) |
| M | Band Width %: =ROUND(((K2-J2)/J2)*100,1) |
| N | Gap vs. Comp 1: =ROUND(((B2-C2)/C2)*100,1) |
Copy row 2's formulas down for every SKU. Add conditional formatting: red when CPI exceeds 110, green when it drops below 90. That gives you a visual dashboard of your competitive position across the entire catalog without any fancy software.
Pro tip: Don't try to track every SKU. Start with your top 100 by revenue. Those likely represent 40-60% of your total sales. Get the competitive picture right on those first, then expand.
Common mistakes with competitive pricing formulas
I've seen these trip up pricing teams at companies of every size.
Mistake 1: Comparing different units of measure. Your price is per box of 100. The competitor quotes per piece. Your CPI looks like 8,500 and you panic. Always normalize to the same UOM before calculating. In distribution, this is a constant headache with different pack sizes, case quantities, and per-foot vs. per-roll pricing.
Mistake 2: Using list price when the market trades on net. If your competitors' published list prices are $50 but every customer gets a 15% discount, the real market price is $42.50. Your CPI against list prices is meaningless. Use street price (what customers actually pay) whenever possible.
Mistake 3: Ignoring freight and delivery terms. A competitor's price is $100 delivered; yours is $95 plus $8 freight. You think you're cheaper. The customer sees $103 vs. $100. For a deep look at how these hidden costs erode margin, see our guide on the cost-plus pricing formula.
Mistake 4: Calculating CPI on stale data. A competitive price from 6 months ago isn't a competitive price. Markets move. If you're running competitive analysis quarterly, you're making decisions on where the market was, not where it is. The highest-impact SKUs need monthly or even weekly updates.
Mistake 5: Averaging across too many SKUs. An average CPI of 101 across 5,000 SKUs sounds great. But if 500 are below 85 (leaving money on the table) and 500 are above 115 (losing deals), the average hides the real problem. Always look at the distribution, not just the mean.
When competitive pricing formulas aren't enough
These formulas tell you where you stand. They don't tell you where you should be. That's a strategy question.
A CPI of 112 on a specialty part where you're the only local stocking distributor might be exactly right. A CPI of 98 on a commodity where you have higher costs than the competition might be unsustainable.
Competitive pricing formulas work best alongside other inputs:
- Your cost floor. The gross margin formula tells you the minimum price you can accept. Pricing below cost-plus just to match a competitor is a losing game.
- Customer willingness to pay. Some segments will pay a premium for availability, technical support, or consolidated billing. Competitive data alone can't tell you that.
- Strategic intent. Are you defending share, gaining share, or maximizing margin? Different objectives demand different positions within the competitive band.
For a full breakdown of how competitive pricing fits with other competitive pricing models, see our detailed comparison.
Next steps
If you're tracking competitor prices in a spreadsheet today, plug these four formulas in. Start with CPI on your top 100 SKUs. That alone will show you where you're leaving money on the table and where you're overpriced.
The hard part isn't the math. It's getting current, accurate competitive data and maintaining it across thousands of SKUs. If your pricing team is spending more time collecting data than acting on it, that's a sign your process needs to change.
Pryse helps mid-market distributors and manufacturers spot exactly where their prices are out of line, without the 6-month implementation of enterprise pricing tools. Upload your data and see your competitive position in 24 hours.
Last updated: February 14, 2026
Frequently Asked Questions

Want to analyze your entire product catalog?
Pryse automatically identifies margin leakage across thousands of SKUs. Upload your data and find hidden profit in 24 hours.
One-time $1,499 diagnostic. No subscription required.