Competitive Pricing Strategy Example: How to Build One from Scratch
Step-by-step competitive pricing strategy examples for distributors and manufacturers. Includes product segmentation, pricing rules, and worked math.
A competitive pricing strategy example shows how a company uses competitor prices as a primary input to set and adjust its own pricing. It's not about blindly matching every price you see. It's about deciding, product by product and segment by segment, where you match, where you undercut, and where you charge more.
I've helped mid-market distributors build competitive pricing strategies from scratch, and the pattern is almost always the same. They come in with a flat markup across the catalog. Some products are priced 30% above the nearest competitor. Others are priced below cost once you factor in freight and handling. They're winning deals on the wrong products and losing deals on the right ones. According to McKinsey's "The Power of Pricing" (McKinsey Quarterly, 2003), a 1% improvement in realized price drives an 8% increase in operating profits. For a $50M distributor at 4% operating margins, that's $400K in pure profit from getting pricing right.
This article walks through the full process of building a competitive pricing strategy, with three worked examples that show the actual math and decision-making behind each step. For background on what competitive pricing is and when it applies, see our guide to competitive pricing.
Step 1: Segment Your Catalog
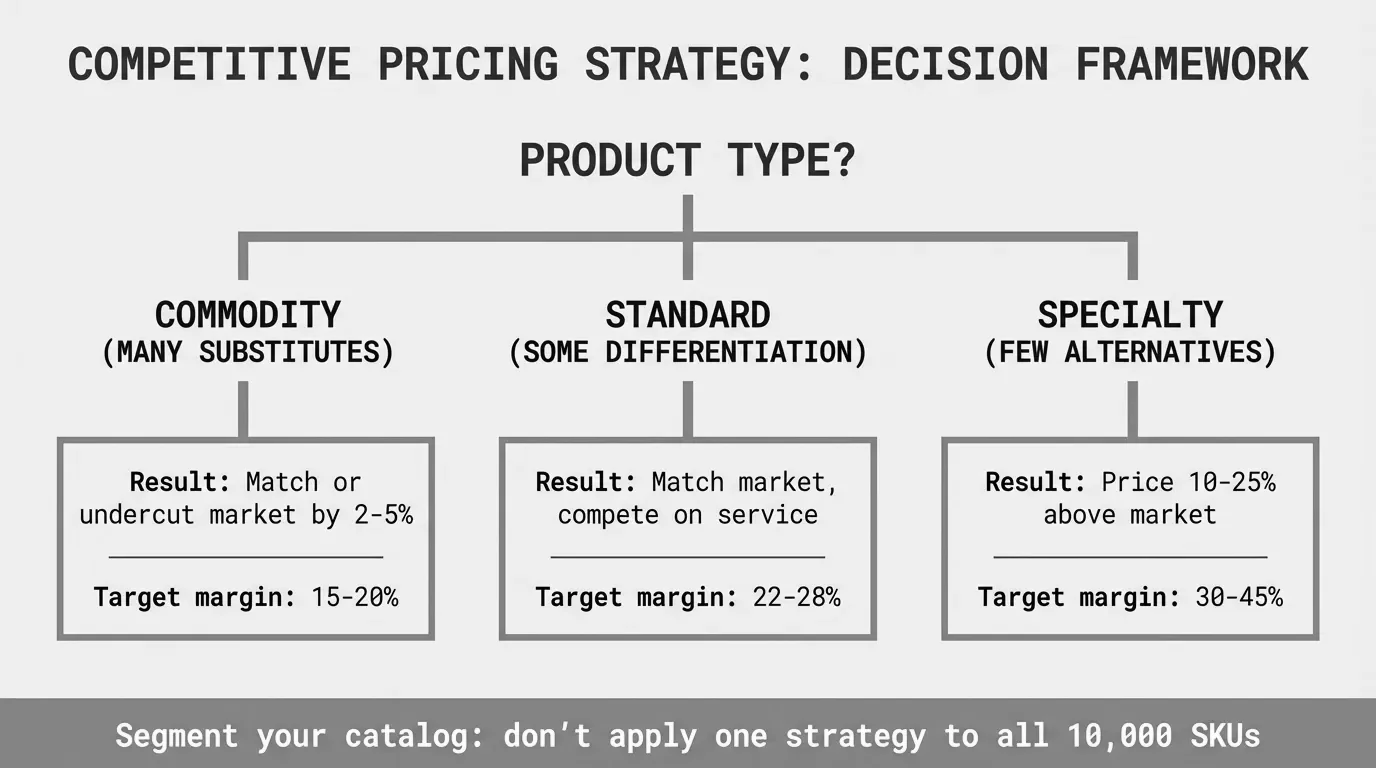
You can't apply one pricing rule to 15,000 SKUs. The first step is splitting your catalog into segments based on competitive exposure and differentiation. Most distributors end up with three tiers:
| Tier | Description | % of SKUs | Pricing Approach |
|---|---|---|---|
| Commodity | Widely available, multiple suppliers, high price transparency | 20-30% | Match or undercut market |
| Competitive | Several suppliers, moderate differentiation, customers compare | 40-50% | Price within a target band |
| Specialty | Few or sole-source, high switching costs, technical differentiation | 20-30% | Premium pricing based on value |
The split matters because each tier has a completely different competitive dynamic. Let me show you what this looks like with a real example.
Worked Example 1: An Electrical Distributor with 12,000 SKUs
A $65M electrical distributor I worked with had been running a flat 32% markup across everything. Here's how they segmented:
Commodity tier (2,800 SKUs, 23%): Standard wire, basic conduit, common breakers. These are the products every customer knows the price of before they call. Three other local distributors stock the same items.
Competitive tier (5,500 SKUs, 46%): Mid-range lighting fixtures, panel boards, standard motor controls. Multiple suppliers exist, but product specs vary enough that not every competitor carries the exact same SKU.
Specialty tier (3,700 SKUs, 31%): Custom switchgear components, specialized industrial connectors, explosion-proof fixtures. High switching costs, longer lead times, and customers buy based on availability and technical support rather than price alone.
The flat 32% markup meant they were overpriced on commodity wire (where competitors ran at 18-22% margin) and underpriced on specialty connectors (where they could've commanded 40-50% margins). They were losing bids on the high-volume commodity products that get customers in the door, while giving away margin on the specialty products those same customers also needed.
Step 2: Gather Competitor Data
You don't need perfect data. You need directional data on the products that matter most.
For most mid-market distributors, competitor pricing data comes from four sources:
- Customer quotes and lost-deal feedback. Your sales team already has this. They just aren't recording it systematically. Start requiring a competitor price field on every lost deal.
- Supplier pricing intelligence. Some suppliers will share market pricing data or pricing band recommendations. Ask.
- Published pricing and online catalogs. More B2B pricing is visible online than it was five years ago. Distributor websites, Amazon Business, and marketplace listings provide real reference points.
- Industry pricing studies. Trade associations and research firms publish margin benchmarks by product category. The Profit Planning Group publishes annual distribution benchmarks that break out margin by line.
You don't need pricing data on every SKU. Focus on your top 500 SKUs by revenue first. They likely represent 60-80% of your sales volume. Get your commodity and competitive tiers covered, then work outward.
Step 3: Set Pricing Rules by Tier
This is where the strategy takes shape. Each tier gets a different set of rules.
Commodity Tier Rules
The goal with commodity products isn't margin. It's customer acquisition and retention. You price these to stay in the game.
Rule: Price at or within 2% of the lowest local competitor. Accept 15-22% gross margin.
Target Price = Lowest Competitor Price × (1.00 to 1.02)
Floor Price = Unit Cost × (1 + Minimum Margin %)
Actual Price = MAX(Target Price, Floor Price)
Never price below your floor. If a competitor is pricing below your cost, they're either buying at a lower tier from the supplier, they're loss-leading, or they made a mistake. Don't chase them off a cliff.
Competitive Tier Rules
This is where you have the most room to maneuver. Customers compare, but product-to-product comparisons are harder because specs aren't identical.
Rule: Price within a band of -5% to +8% of the competitor average. Position based on your service differentiators (availability, delivery speed, technical support, terms).
Price Band Low = Competitor Average Price × 0.95
Price Band High = Competitor Average Price × 1.08
Target Price = Position within band based on service level
If you offer next-day delivery and your competitor ships in three days, that's worth 5-8% on most industrial products. If you bundle technical support or inventory management, that's another 3-5%.
Specialty Tier Rules
You don't compete on price here. You compete on availability, expertise, and solving problems.
Rule: Price based on value delivered, using competitor pricing only as a reference floor. Target 35-50% gross margin.
Value-Based Price = Customer's Next Best Alternative Cost + Switching Cost Savings
Reference Floor = Highest Competitor Price × 1.05
Target Price = MAX(Value-Based Price, Reference Floor)
If a customer's alternative is ordering direct from a manufacturer with an 8-week lead time and your lead time is 3 days, the value of that 7.5 weeks of avoided downtime or project delay is real and quantifiable. Price for it.
For more on how to size these opportunities, check our competitive pricing analysis framework.
Step 4: Apply the Strategy (Worked Examples)
Let's put all of this together with two more worked examples.
Worked Example 2: A Fastener Distributor Repricing Commodity Products
A $40M fastener distributor was losing bids on standard hex bolts and nuts. They had 1,200 commodity fastener SKUs priced at a flat 38% markup. Their realized margin was 27.5%, but it should've been lower on commodities and higher on specialty items.
The situation:
- Their price on a standard 3/8"-16 Grade 5 hex bolt (100-pack): $14.82
- Competitor A (local): $12.40
- Competitor B (online): $11.95
- Their unit cost: $8.50
They were 19% above Competitor A and 24% above Competitor B on a product every buyer price-shops.
Applying the commodity rule:
Target Price = Lowest Competitor Price × 1.02 = $11.95 × 1.02 = $12.19
Floor Price = $8.50 × 1.18 = $10.03 (18% minimum margin)
Actual Price = MAX($12.19, $10.03) = $12.19
New Gross Margin = ($12.19 - $8.50) / $12.19 = 30.3%
They dropped the price from $14.82 to $12.19. Margin went from 42.6% to 30.3% on that SKU. That sounds painful until you see the second-order effects.
The result after six months: They won back three accounts that had left over price. Those accounts didn't just buy commodity fasteners. They bought specialty fasteners, anchoring systems, and custom kits at 42-48% margins. The commodity price drop cost $180K in gross profit. The account wins generated $620K in incremental gross profit. Net gain: $440K.
This is why you don't optimize each product in isolation. Commodity pricing is a customer acquisition tool.
Worked Example 3: An Industrial Supplies Distributor on Competitive-Tier Products
A $55M industrial supplies distributor had 6,000 SKUs in the competitive tier. They wanted to reprice their safety equipment category (800 SKUs) using competitor data.
The situation for a mid-range hard hat (a popular SKU):
- Their price: $28.50 (flat 35% markup from $21.11 cost)
- Competitor A: $26.75
- Competitor B: $27.90
- Competitor C: $29.50
- Competitor average: $28.05
They were 1.6% above the competitor average. Not terrible, but they were also offering same-day shipping and dedicated safety compliance support that none of the three competitors matched.
Applying the competitive tier rule:
Price Band Low = $28.05 × 0.95 = $26.65
Price Band High = $28.05 × 1.08 = $30.29
Service Premium (same-day shipping + compliance support) = +6%
Target Price = $28.05 × 1.06 = $29.73
Gross Margin = ($29.73 - $21.11) / $29.73 = 29.0%
They moved the price from $28.50 to $29.73. A 4.3% increase. They tested this on the full safety equipment category and saw zero customer churn. Their service differentiation supported the premium.
The result: Across 800 safety SKUs, the average price increase was 3.8%. On $4.2M in category revenue, that added $160K in annual gross profit. No new customers needed. No new products. Just pricing that reflected their actual competitive position.
For more real-world scenarios like these, see our competitive pricing examples.
Step 5: Monitor and Adjust
A competitive pricing strategy isn't a one-time project. Markets move. Competitors adjust. Costs change. Here's a practical cadence:
| Tier | Review Frequency | Trigger for Off-Cycle Review |
|---|---|---|
| Commodity | Monthly | Competitor price change > 5%, cost increase > 3% |
| Competitive | Quarterly | Lost deal spike, new competitor entry |
| Specialty | Semi-annually | Supplier change, customer feedback shift |
Track three metrics to know if your strategy is working:
- Win rate by tier. Commodity win rate should be 60%+ since you're pricing to compete. Specialty win rate dropping below 80% means you might be overpriced.
- Gross margin by tier. Commodity margins will be lower (15-22%), competitive margins in the middle (25-35%), and specialty margins highest (35-50%). If the tiers are converging, your segmentation is off.
- Customer-level margin mix. A healthy account buys across all three tiers. If a customer only buys commodity items, they're using you as a price benchmark. That's a relationship worth examining.
The Simon-Kucher Global Pricing Study (2025), which surveyed over 2,200 business leaders across 39 industries, found that companies where leadership actively drives pricing decisions see stronger alignment between pricing strategy and business outcomes. Translation: this can't live in a spreadsheet that nobody looks at. Someone has to own it.
Common Mistakes to Avoid
After working through competitive pricing strategies with a range of distribution companies, these are the mistakes I see most often:
Matching every price. Not every product needs to be competitively priced. If you match prices on specialty items where you're the only local source, you're donating margin.
Using stale data. Competitor prices from six months ago are worse than no data at all. They give you false confidence. As our B2B pricing strategy guide covers, pricing discipline requires current information.
Ignoring total cost to serve. A competitor's price might be lower, but if they charge for shipping, don't stock locally, or require minimum orders, the customer's total cost is higher. Factor this in.
Treating it as a race to the bottom. Competitive pricing doesn't mean cheapest pricing. It means informed pricing. The electrical distributor in Example 1 increased overall gross margin by 2.1 percentage points while becoming more competitive on commodities. That's the whole point.
Skipping the floor price. Without a minimum margin threshold, it's easy for competitive pricing rules to push you below cost on low-value items. Always set a floor.
Getting Started
You don't need to reprice your entire catalog on day one. Here's a practical starting sequence:
- Week 1-2: Segment your top 500 SKUs by revenue into commodity, competitive, and specialty tiers.
- Week 3-4: Gather competitor pricing on your commodity and competitive tiers. Start with whatever your sales team already knows.
- Week 5-6: Set pricing rules for each tier. Run the math. Identify the biggest gaps between current price and target price.
- Week 7-8: Implement changes on your commodity tier first. These are the lowest-risk, most visible wins.
- Month 3+: Roll out competitive and specialty tier pricing. Monitor results. Adjust.
If you want to see where your biggest pricing gaps are before you start, Pryse's pricing diagnostic can map your current margin distribution and flag the products where competitive misalignment is costing you the most.
For more examples of how different pricing strategies work in practice, explore the rest of our pricing library.
Last updated: February 14, 2026
Frequently Asked Questions

Want to analyze your entire product catalog?
Pryse automatically identifies margin leakage across thousands of SKUs. Upload your data and find hidden profit in 24 hours.
One-time $1,499 diagnostic. No subscription required.