Gross Margin Formula: How to Calculate Gross Profit Margin
The gross margin formula explained with examples. Calculate gross profit margin percentage and dollar amount.
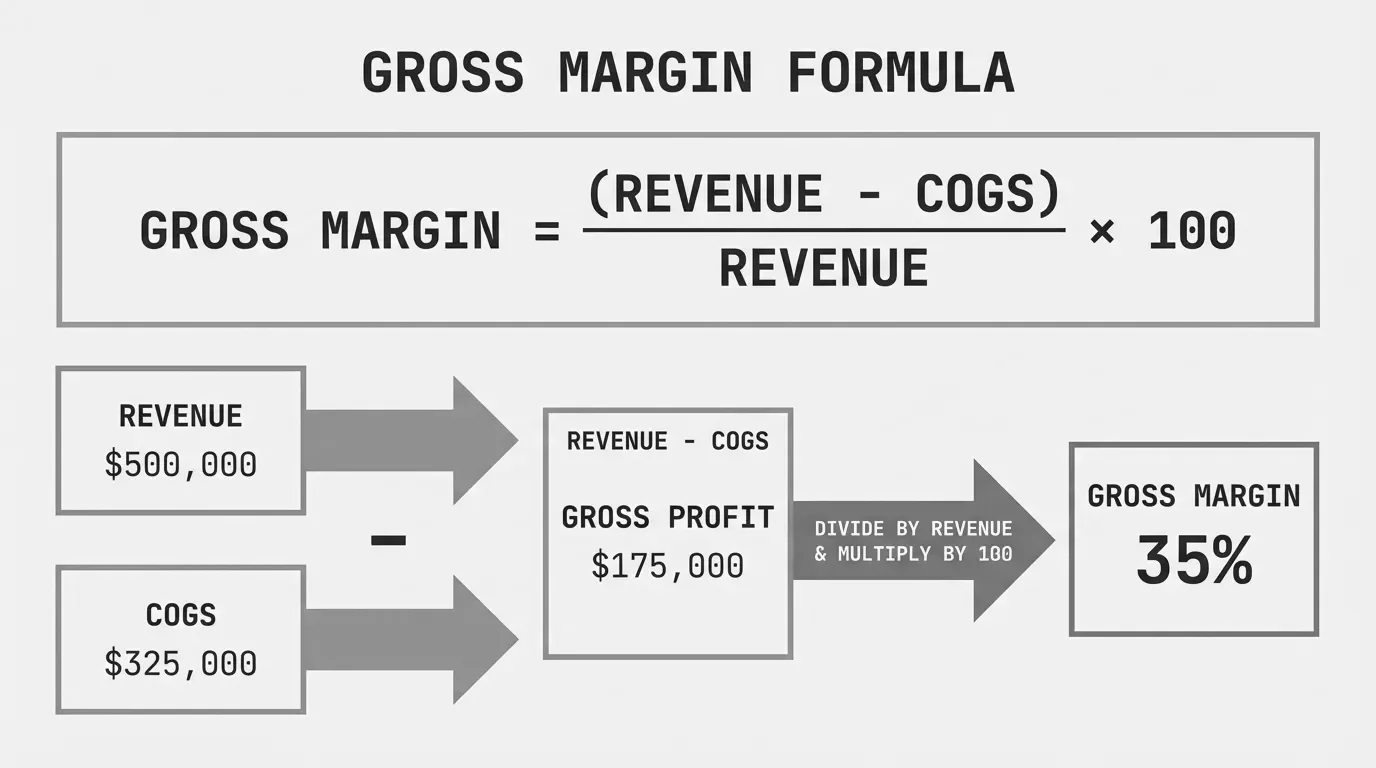
The gross margin formula tells you what percentage of revenue remains after subtracting the direct costs of producing your goods.
Gross Margin % = (Revenue - Cost of Goods Sold) / Revenue × 100This single number reveals how efficiently you convert sales into profit before operating expenses. A 35% gross margin means you keep $0.35 from every dollar of revenue after paying for the product itself.
The Two Gross Margin Formulas
There are two ways to express gross margin: as a dollar amount and as a percentage. Most financial analysis uses the percentage because it allows comparison across products, time periods, and competitors of different sizes.
Gross Margin Percentage Formula
Gross Margin % = (Revenue - COGS) / Revenue × 100Or equivalently:
Gross Margin % = Gross Profit / Revenue × 100This percentage shows your production efficiency. A distributor with $10 million in revenue and a 22% gross margin keeps $2.2 million after paying suppliers.
Gross Profit (Dollar Amount) Formula
Gross Profit = Revenue - Cost of Goods SoldGross profit gives you the actual dollars available to cover operating expenses, pay down debt, and generate net income. Both numbers matter—the percentage for benchmarking, the dollar amount for budgeting.
Step-by-Step Calculation Example
A mid-market industrial parts distributor wants to calculate gross margin for Q3.
Given:
- Revenue: $4,200,000
- Cost of Goods Sold: $3,108,000
Step 1: Calculate Gross Profit
$4,200,000 - $3,108,000 = $1,092,000Step 2: Calculate Gross Margin Percentage
$1,092,000 / $4,200,000 × 100 = 26%This distributor operates at a 26% gross margin. For every million in sales, they retain $260,000 after product costs.
What Goes Into Cost of Goods Sold
The accuracy of your gross margin depends entirely on what you include in COGS. Get this wrong and your margin numbers become meaningless.
Include in COGS:
- Raw materials and components
- Direct labor (production floor workers)
- Manufacturing overhead (factory utilities, equipment depreciation)
- Inbound freight and shipping to warehouse
- Packaging materials
- Subcontractor costs for production
Exclude from COGS (these are operating expenses):
- Sales and marketing costs
- Administrative salaries
- Office rent and utilities
- Research and development
- Interest and taxes
A common mistake: including warehouse labor in COGS. If workers are picking and packing for outbound shipment, that's an operating expense. If they're receiving and putting away inbound inventory, some companies allocate that to COGS. Be consistent in your classification.
Gross Margin vs. Gross Profit: The Difference
These terms get used interchangeably, but they measure different things:
| Metric | Type | Formula | Use Case |
|---|---|---|---|
| Gross Profit | Dollar amount | Revenue - COGS | Budgeting, cash flow planning |
| Gross Margin | Percentage | (Gross Profit / Revenue) × 100 | Benchmarking, trend analysis |
Gross profit tells you the money story—how many actual dollars you have left. Gross margin tells you the efficiency story—how well you're converting revenue into profit.
A $50M manufacturer with $15M gross profit and a $200M manufacturer with $50M gross profit both operate at 25% gross margin. The percentage lets you compare apples to apples regardless of company size.
Industry Benchmarks: What's a Good Gross Margin?
Gross margin varies widely by industry. Comparing your margin to the wrong benchmark leads to bad decisions.
| Industry | Typical Gross Margin |
|---|---|
| SaaS / Software | 70% - 90% |
| Professional Services | 50% - 70% |
| Specialty Manufacturing | 35% - 50% |
| General Manufacturing | 25% - 35% |
| Wholesale Distribution | 15% - 25% |
| Grocery / Food Distribution | 10% - 15% |
For distribution and manufacturing companies in the $20M-$200M range, margins between 20% and 35% are typical. Below 20% often signals pricing problems or excessive discounting. Above 40% may indicate room to invest in growth or competitive vulnerability from premium pricing.
The average gross margin across all industries sits around 36%, but this number is skewed by high-margin sectors like software and pharmaceuticals. For product-based businesses, 25-35% is a reasonable target.
Calculating Gross Margin by Product or Customer
Company-wide gross margin masks what's actually happening in your business. The real insights come from calculating margin at the product and customer level.
Product-Level Gross Margin
Product Gross Margin = (Unit Price - Unit COGS) / Unit Price × 100Example: A fastener distributor sells a box of bolts for $24.50. Their cost is $17.15.
($24.50 - $17.15) / $24.50 × 100 = 30%Run this calculation across your product catalog. You'll likely find 20% of products generating 80% of your margin dollars while other SKUs barely break even.
Customer-Level Gross Margin
Customer Gross Margin = (Customer Revenue - Customer COGS) / Customer Revenue × 100Two customers buying $500,000 annually might have wildly different margins if one demands custom packaging, expedited shipping, or heavy technical support. Customer-level margin analysis often reveals that your largest accounts aren't your most profitable.
For a deeper look at breaking down margins by segment, see our complete guide to margin analysis.
Why Your Gross Margin Matters
Gross margin is the foundation of your pricing strategy. It determines:
Pricing power: Low margins mean you're competing on price. Every discount cuts into thin profit. High margins give you room to negotiate, offer volume discounts, or invest in service.
Operational leverage: Fixed costs get covered by gross profit. A 30% margin business needs $3.33M in revenue to cover $1M in operating costs. A 20% margin business needs $5M.
Growth capacity: Gross profit funds everything else—sales teams, marketing, R&D, debt service. Thin margins constrain your ability to invest in growth.
Acquisition risk: Private equity and strategic buyers pay multiples of EBITDA. Your gross margin sets the ceiling on what EBITDA can be.
Finding Margin Leakage
Most distribution and manufacturing companies have 3-7 percentage points of gross margin hiding in their data. Common sources of leakage:
- Untracked discounts: Sales reps giving away margin that never gets measured
- Cost increases not passed through: Supplier prices went up; customer prices didn't
- Product mix drift: Selling more low-margin items over time
- Customer concentration: Your biggest customers negotiated the lowest margins
- Freight and handling absorption: Eating costs that should be billed
Calculating overall gross margin is step one. Finding where margin disappears requires drilling into the transaction-level data—something spreadsheets struggle to do at scale.
Next Steps
Understanding the gross margin formula is straightforward. The harder work is applying it across thousands of SKUs, hundreds of customers, and years of transaction history to find where your margin is actually going.
If you're running pricing analysis in Excel and suspect there's margin hiding in your data, that's exactly what Pryse is built for—upload your data and see your margin breakdown in 24 hours, not 6 months.
Last updated: January 3, 2026
Frequently Asked Questions

Want to analyze your entire product catalog?
Pryse automatically identifies margin leakage across thousands of SKUs. Upload your data and find hidden profit in 24 hours.
One-time $1,499 diagnostic. No subscription required.