Pricing Models Explained: A Practical Guide for Distributors and Manufacturers
The 7 pricing models that matter for distribution and manufacturing. Learn which ones actually work for 5K-100K SKU catalogs and how to pick the right approach.
A pricing model is the structured method a business uses to determine what it charges for products or services. It takes inputs like costs, market data, and customer value, then produces a number that appears on an invoice. The model you choose shapes your margins, your competitiveness, and ultimately whether you're leaving money on the table.
Here's what most mid-market distributors and manufacturers get wrong: they think they've chosen a pricing model. They haven't. They've inherited one. Someone set up a cost-plus spreadsheet years ago, slapped 25-30% on everything, and now that markup percentage has become gospel. Nobody questions it. Nobody tests it. And according to Bain & Company's 2018 brief "Dynamic Pricing: Building an Advantage in B2B Sales," that complacency costs companies 2-7 percentage points in margin they'll never see.
This guide covers the pricing models that actually matter for distribution and manufacturing companies managing 5,000 to 100,000 SKUs. Not the textbook list of 14 theoretical approaches. The ones you can implement, measure, and profit from.
For the full strategic framework, see our Pricing Strategy Guide.
Why Your Pricing Model Matters More Than Your Sales Team
A 1% improvement in realized price drives an 8-11% increase in operating profit, depending on your margin structure. No sales hire, marketing campaign, or cost-cutting initiative comes close to that leverage.
Profit Impact of 1% Price Improvement = Revenue x 1% x (1 / Operating Margin %)
Example: $75M revenue x 1% = $750K / 5% operating margin = 15% profit increase
For a $75M distributor running 5% operating margins, that 1% means $750K in pure profit. Same customers, same products, same warehouse. The difference is entirely in how you calculate the number on the invoice.
Yet most companies spend less than 10 hours per year evaluating their pricing model. They'll run a two-day offsite on sales strategy but won't question why they're marking up a proprietary industrial valve the same as a commodity fitting that's available from six competitors.
The pricing model is the foundation. Everything else -- discounting, negotiations, contract terms -- sits on top of it. Get the foundation wrong and no amount of sales discipline fixes the problem.
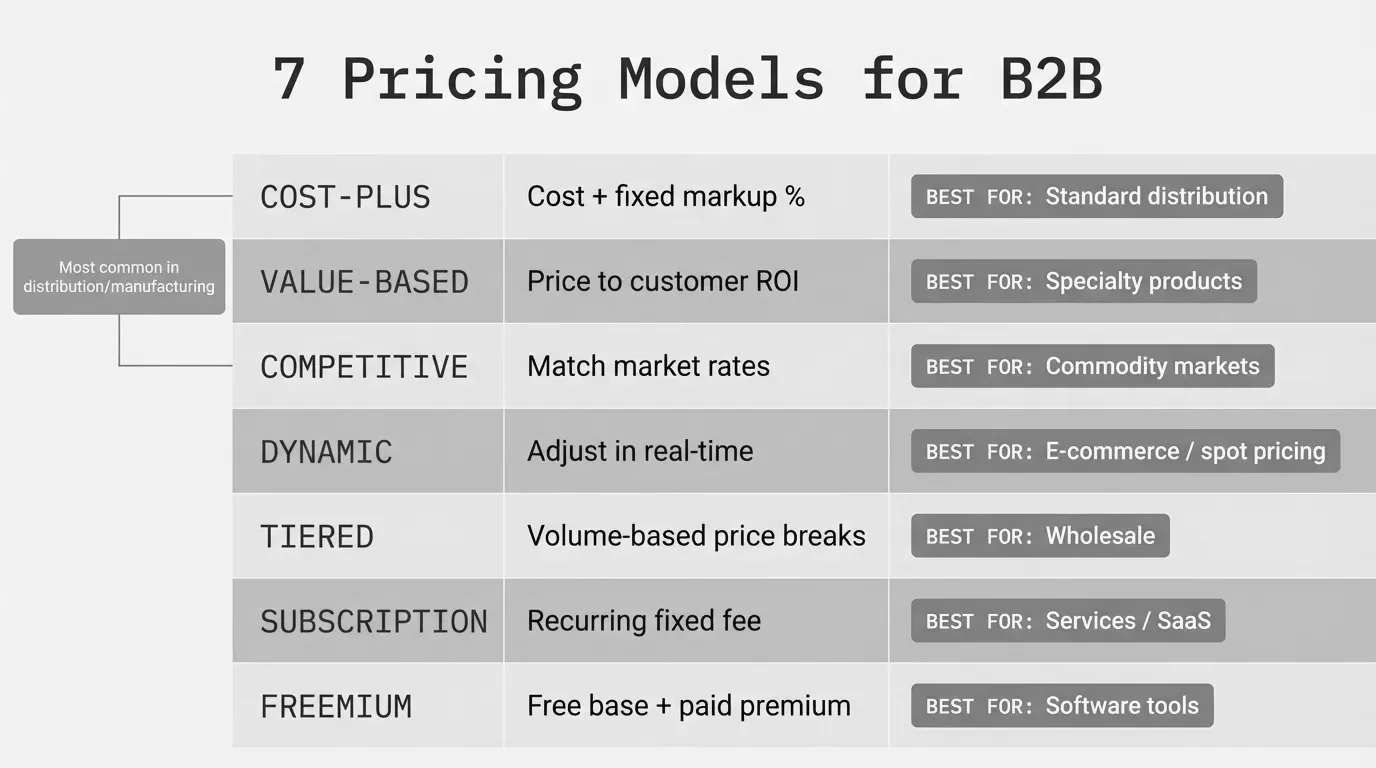
The 7 Pricing Models That Matter for Distribution and Manufacturing
Every pricing model you'll encounter falls into one of these categories. Each works for certain products, certain customers, and certain competitive situations. None works for everything.
1. Cost-Plus Pricing
Cost-plus pricing is the most widely used model in distribution and manufacturing. You take your cost of goods, add a fixed markup percentage, and that's your selling price. It's simple, transparent, and ensures you don't sell below cost.
Selling Price = Cost of Goods x (1 + Markup %)
Example: $80 cost x (1 + 0.30) = $104 selling price
Gross Margin = ($104 - $80) / $104 = 23.1%
Where it works: Commodity products, stable-cost categories, and situations where pricing transparency matters (government contracts, cooperative purchasing agreements). Manufacturers with predictable bill-of-materials costs use it as a reliable baseline.
Where it fails: It completely ignores what customers will actually pay. A 30% markup on a product with no competitive alternative is leaving margin on the table. That same 30% markup on a commodity available from five other distributors might be too high.
The typical manufacturer markup runs 15-20% over BOM costs. Distributors add another 20-40% on top, depending on the sector. But those averages hide enormous variation. Commodity distributors might run 15-20% gross margins on thin markups, while specialty distributors with value-added services reach 30-40%.
The hidden cost: Cost-plus pricing creates what pricing consultants call "peanut butter pricing" -- you spread the same margin evenly across everything. Zilliant's Global B2B Industry Benchmark Report shows distributors using uniform markups leak 2-11.7% of margin annually through stale pricing, uncontrolled overrides, and siloed discount decisions. On a $50M revenue base, that's $1M to $3.5M or more per year in profit you never capture.
2. Value-Based Pricing
Value-based pricing sets prices based on what the product is worth to the customer, not what it costs you to source or produce. It's the model with the highest margin potential and the hardest to execute.
Value-Based Price = Customer's Next Best Alternative + Value of Differentiation
Example: Competitor price $100 + your faster delivery saves customer $15/order = $115 value-based price
Where it works: Proprietary products, sole-source items, products bundled with services (technical support, kitting, custom fabrication), and any situation where switching costs are high. If a customer can't easily buy the same thing from someone else, value-based pricing applies.
Where it fails: Commodity markets with price transparency. If the buyer can pull up five competing quotes in ten minutes, value-based pricing isn't relevant for that SKU.
Here's the practical reality for distributors: you probably can't apply value-based pricing to your entire catalog. But you don't need to. Most mid-market distributors find that 15-30% of their SKUs have enough differentiation to support value-based prices. Those SKUs often account for a disproportionate share of margin improvement.
A building materials distributor we've seen moved 2,400 of their 18,000 SKUs to value-based pricing. Those 2,400 items represented 13% of the catalog but generated 40% of the margin improvement. The rest stayed on cost-plus. No massive overhaul required.
3. Competitive Pricing
Competitive pricing sets your prices relative to what your competitors charge. You might match, undercut by a fixed percentage, or price at a premium with justification. The key input isn't your cost -- it's the market.
Where it works: High-visibility products that customers actively price-shop. In distribution, these are typically the A-items: the top 200-500 SKUs that buyers know by heart and compare across vendors. The electrical distributor who prices Romex wire or PVC conduit 8% above the market will hear about it.
Where it fails: Products where market price data doesn't exist or where your offering isn't comparable. A manufacturer selling a custom-engineered solution can't benchmark against off-the-shelf competitors.
The challenge for mid-market companies is data. Enterprise competitors use tools like PROS, Vendavo, or PriceFx to pull real-time competitive intelligence. A $50M distributor relying on sales reps' anecdotes about "what the market will bear" isn't doing competitive pricing. They're guessing.
A practical approach: identify your top 300-500 most price-sensitive SKUs. Track competitor pricing on those items monthly. Price them to market. Then apply cost-plus or value-based models to the remaining 90-95% of the catalog where competitive data either doesn't exist or doesn't matter.
4. Tiered Pricing
Tiered pricing offers different prices based on volume commitments, customer segments, or service levels. Buy more, pay less. Commit longer, get a better rate.
Tier Structure Example:
Tier 1 (1-99 units): $50/unit → 30% margin
Tier 2 (100-499 units): $45/unit → 22% margin
Tier 3 (500+ units): $41/unit → 15% margin
Where it works: Any distributor or manufacturer with a wide range of customer sizes. A regional HVAC distributor serving both one-truck contractors and multi-branch mechanical firms needs different price points. Tiered pricing gives structure to what's otherwise ad-hoc discounting.
Where it fails: When the tiers aren't based on real data. Too many companies set tier thresholds arbitrarily. If your Tier 2 break starts at 100 units but 80% of customers buy between 50 and 90, you've set a threshold that benefits almost no one. Tiers should reflect actual purchasing patterns and your cost-to-serve at each volume level.
The margin leakage risk with tiered pricing comes from tier assignment. When sales reps can override customer tier placement -- bumping a Tier 3 customer to Tier 1 pricing as a "relationship discount" -- the entire structure breaks down. According to NAW and SPARXiQ's distributor profitability benchmarks, the average wholesale distributor earns about 4% EBITDA on sales, while elite distributors reach 8-12%. The difference isn't the tier structure. It's the discipline in enforcing it.
5. Dynamic Pricing
Dynamic pricing adjusts prices based on real-time factors: supply and demand, inventory levels, competitor moves, or market conditions. It's the opposite of "set it and forget it."
Where it works: Products with volatile input costs (steel, copper, lumber, chemicals), seasonal demand patterns, or perishable/limited inventory. A fastener distributor whose steel costs swing 15-20% quarter over quarter can't afford to reprice annually.
Where it fails: Contract-bound relationships where price stability matters. If you've quoted a $2M project with fixed pricing and your cost-plus model says you should raise prices mid-contract, you've got a customer problem.
For most mid-market distributors, "dynamic" doesn't mean algorithmic real-time repricing like Amazon. It means updating prices more often than once a year. During the 2022-2024 inflation spike, some manufacturers changed prices nine times per year instead of the traditional annual adjustment. That's dynamic enough to protect margins without alienating customers.
The minimum viable version: review and update pricing quarterly for your top 500 SKUs by revenue. Update everything else semi-annually. That cadence catches most cost changes before they eat your margin.
6. Margin-Based Pricing
Margin-based pricing works backward from a target gross margin instead of forward from a markup percentage. The distinction matters more than it sounds.
Markup Pricing: $100 cost x 1.25 markup = $125 price → 20% margin
Margin Pricing: Target 25% margin → Price = $100 / (1 - 0.25) = $133.33
Notice the difference. A 25% markup produces a 20% margin. A 25% target margin produces a 33.3% markup. Companies that confuse the two -- and many do -- systematically underprice by 3-5 percentage points.
Where it works: Companies with firm margin targets by category or product line. A distributor that needs 25% gross margin across the board to cover operating costs and hit profitability targets should price to margin, not markup.
Where it fails: When applied uniformly without considering what the market will actually pay. Margin targets are internal goals. If the market for a product only supports 18% margin, hitting 25% means losing the deal. The target should be a portfolio average, not a line-item mandate.
Check your ERP settings. Many systems let you enter "margin" or "markup" as the pricing method, and the person who configured it five years ago may have picked the wrong one. We've seen distributors discover a 3-4% margin gap just from correcting this setting.
7. Contract and Negotiated Pricing
Contract pricing sets fixed prices for specific customers over a defined period, typically 6-12 months. It's the dominant model for large B2B accounts.
Where it works: Key accounts that demand price stability and commit to volume. A manufacturer supplying an OEM with 50,000 units per quarter needs predictable pricing. The OEM needs predictable costs. Contracts serve both.
Where it fails: When contracts auto-renew without review. A 2023 contract with 2023 costs that's still in force in 2026 has been silently leaking margin for three years. Every cost increase that wasn't passed through is margin you'll never recover.
The biggest risk in contract pricing isn't the initial negotiation. It's the decay. According to McKinsey's 2014 ebook "The Hidden Power of Pricing: How B2B Companies Can Unlock Profit," up to 30% of pricing decisions fail to capture revenue customers were willing to pay, and contract renewals are a leading culprit because companies don't systematically review every term and escalation clause.
For distributors managing 200+ contract accounts, the math compounds. If each contract leaks 1% per year through unreviewed renewals, and contracts cover 40% of revenue, that's 0.4% of total margin gone. On $100M, that's $400K annually.
For more on contract pricing approaches, see our contract pricing guide.
How to Choose the Right Pricing Model
There's no universal answer. But there is a decision framework that works for most mid-market distributors and manufacturers.
Step 1: Segment Your Catalog
Not every SKU deserves the same pricing approach. Split your catalog into three or four segments:
| Segment | % of SKUs | Characteristics | Recommended Model |
|---|---|---|---|
| Commodity / A-items | 10-15% | High visibility, price-shopped, many alternatives | Competitive pricing |
| Standard catalog | 60-70% | Moderate competition, predictable costs | Cost-plus or margin-based |
| Specialty / sole-source | 15-25% | Few alternatives, high switching costs | Value-based pricing |
| Contract / key account | Varies | Volume commitments, negotiated terms | Contract pricing with annual review |
Step 2: Set Margin Floors
Whatever model you use, establish minimum margins by category. This prevents the "race to zero" on competitive items and ensures cost-plus markups don't dip below breakeven when costs spike.
Margin Floor = Direct Cost + Allocated Operating Cost + Minimum Profit Target
Example: $60 COGS + $12 operating cost allocation + $3 profit target = $75 minimum price → 20% floor margin
Step 3: Build Escalation Rules
Define what triggers a price change and who can authorize it. Without rules, you get ad-hoc discounting. With rules, you get pricing discipline.
Practical escalation rules for mid-market companies:
- Cost increases over 5%: Automatic price adjustment within 30 days
- New competitor enters market: Review pricing on affected SKUs within 2 weeks
- Customer requests discount over 10%: Requires manager approval with documented justification
- Contract renewal: Full margin review 90 days before expiration
Step 4: Measure What Leaks
Whatever pricing model you choose, you need visibility into what's actually happening between your list price and the cash that hits your account. That's what a price waterfall analysis reveals.
Most distributors lose 15-45% between list price and pocket price through discounts, rebates, freight absorption, payment terms, and returns. Knowing your model is cost-plus at 30% doesn't matter if the customer's effective price after all concessions reflects a 12% margin.
Common Pricing Model Mistakes in Distribution
These aren't theoretical. They show up in the data every time a distributor or manufacturer runs a margin analysis.
Mistake 1: One Model for Everything
A 40,000-SKU distributor using flat 28% markup across all products is guaranteed to be overpriced on 30% of their catalog and underpriced on another 30%. The products with alternatives are overpriced (losing deals to competitors). The products without alternatives are underpriced (giving away margin).
Mistake 2: Confusing Markup and Margin
This is more common than anyone admits. A 25% markup produces a 20% margin. A 33.3% markup produces a 25% margin. If your ERP says "25% margin" but calculates it as a markup, every price in your system is lower than intended. We've covered the math in detail in our markup to margin calculator.
Mistake 3: Ignoring Cost-to-Serve
Two customers both buy $500K per year. Same pricing tier. But Customer A orders in full pallets with 30-day payment terms. Customer B orders in broken cases, demands next-day delivery, calls your inside sales team weekly, and pays at 60 days. Your cost-to-serve Customer B is 8-15% higher, but your pricing model doesn't know that.
Mistake 4: Annual Pricing Reviews
Costs don't move once a year. Raw material prices fluctuate monthly. Freight rates shift quarterly. A pricing model built on January costs is wrong by March. During volatile periods, quarterly reviews are the bare minimum.
Mistake 5: No Discount Governance
The pricing model sets a number. The sales team negotiates a different one. Without visibility into the gap between model price and invoiced price, you can't measure margin leakage. And what you can't measure, you can't fix.
Pricing Models Compared: Quick Reference
| Model | Best For | Margin Potential | Complexity | Common In |
|---|---|---|---|---|
| Cost-plus | Commodity, stable-cost products | Low-medium | Low | Manufacturing, general distribution |
| Value-based | Specialty, sole-source, bundled services | High | High | Specialty distribution, OEM |
| Competitive | High-visibility, price-shopped items | Low | Medium | Commodity distribution |
| Tiered | Multi-segment customer base | Medium | Medium | Broad-line distribution |
| Dynamic | Volatile-cost categories | Medium-high | High | Steel, lumber, chemicals |
| Margin-based | Companies with firm profit targets | Medium | Low | All distribution sectors |
| Contract | Key accounts, OEM relationships | Varies | Medium | Manufacturing, industrial distribution |
How Pryse Helps You Evaluate Your Pricing Model
Most mid-market distributors and manufacturers don't know how their pricing model performs at the SKU level. They know their overall gross margin. They don't know which products are overpriced, which are underpriced, and where the model itself is creating leakage.
Pryse takes your transaction data (a CSV export from your ERP), runs it through a price waterfall analysis, and shows you exactly where your pricing model breaks down. You'll see the gap between your intended margin and your realized margin, broken out by product, customer, and channel.
No six-month implementation. No $100K platform. Upload your data and see results within 24 hours.
See how your pricing model performs -- start your diagnostic
Frequently Asked Questions
What is a pricing model?
A pricing model is a structured method for determining what to charge for a product or service. It defines the inputs (costs, competitor prices, customer willingness to pay), the logic (markup percentage, value assessment, market comparison), and the output (selling price). Most distribution and manufacturing companies use one model as their base and layer others on top for specific product segments.
What's the best pricing model for distributors?
No single model fits every distributor. The most effective approach combines cost-plus as a margin floor, competitive pricing on high-visibility items, and value-based adjustments for differentiated products. A $50M electrical distributor with 15,000 SKUs shouldn't apply one formula to everything. The top 300 price-sensitive items need market-based pricing. Specialty items with few alternatives support higher margins.
What's the difference between a pricing model and a pricing strategy?
A pricing model is the mechanism for calculating price. A pricing strategy is the broader plan: which models to use for which segments, target margins by category, discount governance, and exception handling. The model answers "how do we calculate this price?" The strategy answers "what should our prices achieve?"
How do I switch from cost-plus to value-based pricing?
Don't switch entirely. Segment your catalog first. Identify the 15-30% of SKUs where you have low competition and customers aren't actively price-shopping. Apply value-based pricing there. Keep cost-plus for commodities. That partial shift alone typically adds 1-3% to overall margin without the risk of a full pricing overhaul.
Does my pricing model cause margin leakage?
It very likely contributes. Uniform cost-plus models are the single biggest driver of margin leakage in distribution. When you mark up every product by the same percentage, you overprice commodities (losing deals) and underprice specialties (losing margin). Running a price waterfall analysis shows exactly where model mismatches create leakage.
How often should I reevaluate my pricing model?
Review the model structure annually. Review the prices it produces quarterly at minimum, monthly for high-velocity items. The model itself shouldn't change often, but the cost inputs, competitive data, and customer segmentation that feed into it must stay current. Static annual pricing hasn't been viable since 2022.
Last updated: Invalid Date
Frequently Asked Questions

Want to analyze your entire product catalog?
Pryse automatically identifies margin leakage across thousands of SKUs. Upload your data and find hidden profit in 24 hours.
One-time $1,499 diagnostic. No subscription required.