Value-Based Pricing Model: 4 Frameworks to Price on Customer Value
How to implement value-based pricing using EVE, Van Westendorp, conjoint analysis, and Good-Better-Best tiering. Practical frameworks for B2B companies.
A value-based pricing model sets prices based on the economic value a product or service delivers to the customer, not what it costs to produce. Instead of marking up costs or matching competitors, you quantify the monetary benefit customers receive and price accordingly.
This sounds straightforward. In practice, it's where most mid-market distributors and manufacturers get stuck. You know your specialty product saves customers time, reduces downtime, or improves yield. But how do you translate that into a defensible price? And how do you avoid the trap of claiming "value" while customers just see a higher number?
According to McKinsey's 2003 article "The Power of Pricing" in The McKinsey Quarterly, a 1% price improvement generates an 8% increase in operating profits for the average S&P 1500 company. Value-based pricing is how you find that 1%. For a $75M manufacturer at 5% operating margin, capturing just 1% more through better value pricing adds $600K to the bottom line.
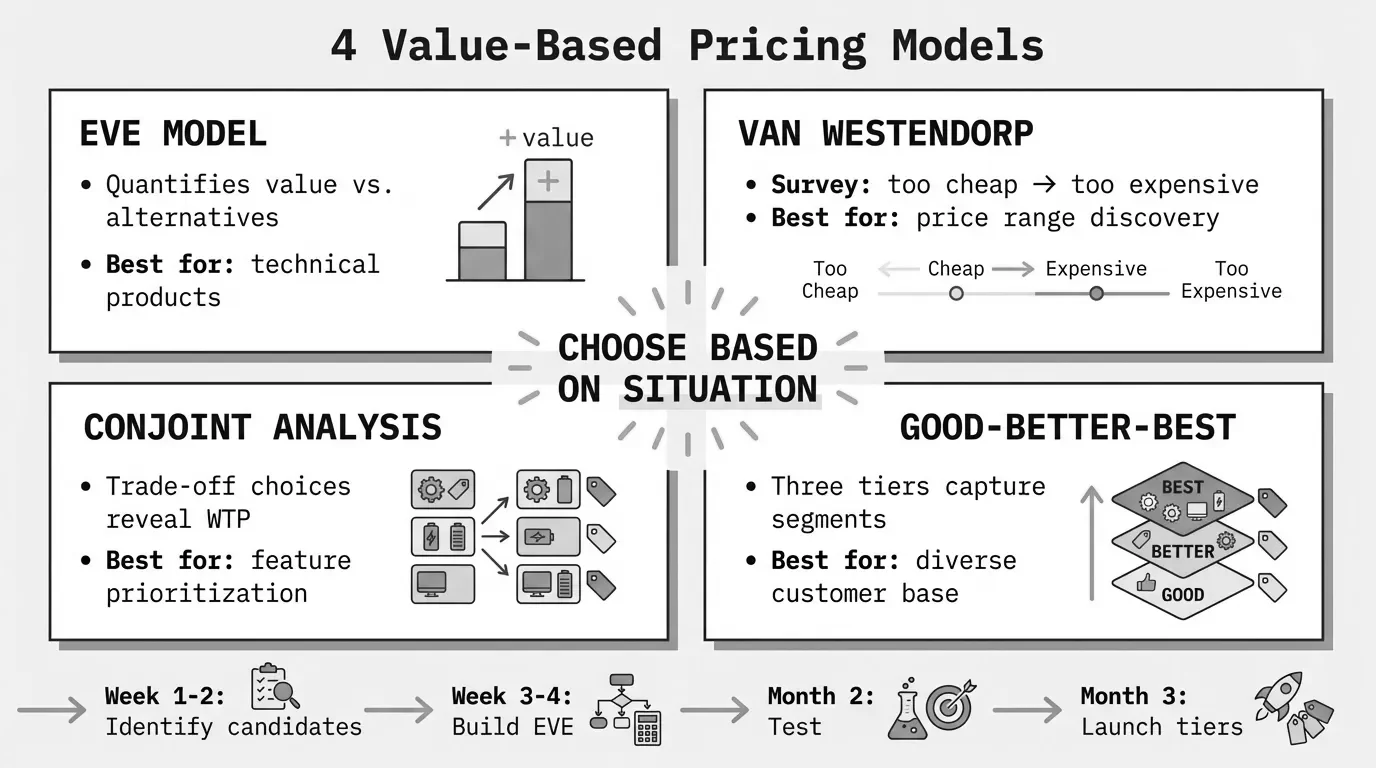
This guide covers four practical frameworks for implementing value-based pricing: Economic Value Estimation (EVE), Van Westendorp Price Sensitivity Meter, conjoint analysis, and Good-Better-Best tiering. Each has specific use cases. None requires a six-figure consulting engagement to implement.
Economic Value Estimation (EVE)
Economic Value Estimation is a framework introduced by Thomas Nagle in The Strategy and Tactics of Pricing (1987). It quantifies the monetary value your offering creates for a customer compared to their next best alternative.
The EVE model has four components, as detailed by LeveragePoint:
- Reference Value: The price customers pay for the next best competitive alternative (NBCA)
- Positive Differentiation Value: The monetary value your offering creates above the NBCA (cost savings, revenue gains, risk reduction)
- Negative Differentiation Value: Additional costs customers incur with your offering (switching costs, training, implementation)
- Net Differentiation Value: Positive minus negative differentiation
Total Economic Value = Reference Value + Positive Differentiation - Negative Differentiation
How to Build an EVE Model
Start by identifying your customer's next best alternative. For a specialty industrial adhesive, that might be a cheaper commodity adhesive plus additional labor. For a precision machined component, it might be sourcing from three separate vendors instead of your single-source solution.
Then quantify each value driver. A value driver is a formula that translates a product feature into customer financial impact. According to pricing experts at Ibbaka, the basic format is:
Value Driver = Customer Financial Metric x Percent Impact of Offering
Example: $50,000 annual maintenance cost x 15% reduction = $7,500 value
Here's a practical example for a $45M electrical distributor selling motor control centers:
| Component | Calculation | Value |
|---|---|---|
| Reference value (competitor quote) | - | $28,000 |
| Positive differentiation: | ||
| - Faster delivery (2 weeks vs 6 weeks) | $8,000/week downtime cost x 4 weeks | +$32,000 |
| - Pre-wired configuration | 40 hours labor saved x $75/hour | +$3,000 |
| - Single-source warranty | Avoided coordination cost | +$1,500 |
| Negative differentiation: | ||
| - Staff training required | 8 hours x 3 people x $50/hour | -$1,200 |
| Total Economic Value | $63,300 |
Your value-based price ceiling is $63,300. You could price at $45,000 and still deliver $18,300 in documented value to the customer. At $35,000, you're leaving significant money on the table.
When EVE Works Best
EVE works for differentiated B2B products where you can quantify specific customer outcomes. Technical products, value-added services, and solutions that reduce customer costs or increase productivity are ideal candidates.
It fails for commodities where customers have easy substitutes, or when the value is subjective (brand preference, relationship comfort) rather than economic.
The key is "never dollarize a product feature, always dollarize a customer benefit," as the Professional Pricing Society's golden rules state. "Corrosion-resistant coating" is a feature. "$12,000 in avoided replacement costs over five years" is a benefit.
Van Westendorp Price Sensitivity Meter
The Van Westendorp Price Sensitivity Meter (PSM) is a survey-based method developed by Dutch economist Peter van Westendorp in 1976. It identifies acceptable price ranges by measuring how customers perceive price at different levels.
Unlike EVE, which calculates value from your perspective, Van Westendorp captures what customers think about price directly. According to SurveyMonkey's market research methodology guide, respondents answer four questions:
- At what price would this product be so expensive you wouldn't consider buying it?
- At what price would this product be expensive but still worth considering?
- At what price would this product be a bargain or good value?
- At what price would this product be so cheap you'd question its quality?
Plot the cumulative responses on a graph. Four lines intersect at meaningful price points:
| Intersection | Price Point | Meaning |
|---|---|---|
| "Too cheap" crosses "Expensive" | Point of Marginal Cheapness (PMC) | Below this, quality concerns dominate |
| "Too expensive" crosses "Bargain" | Point of Marginal Expensiveness (PME) | Above this, price resistance dominates |
| "Too cheap" crosses "Too expensive" | Optimal Price Point (OPP) | Equal proportion find it too cheap vs. too expensive |
| "Expensive" crosses "Bargain" | Indifference Price Point (IDP) | Equal proportion find it expensive vs. bargain |
The acceptable price range falls between PMC and PME. The OPP suggests where to start.
Implementing Van Westendorp for B2B
B2B applications require modifications from consumer research. According to ClearOpinion Insights Hub, key adjustments include:
Qualify respondents carefully. In B2B, the person answering must have purchase authority or influence. A plant engineer's price perception differs from a procurement manager's.
Frame questions for business context. Instead of "would you buy," ask "would your organization approve this purchase" or "how would this compare to your current solution's total cost."
Smaller sample sizes work. Consumer studies need 200-400 respondents. B2B research with 50-100 decision-makers from your target segment produces valid results, especially for niche industrial products.
Segment results. Price sensitivity varies by company size, industry, and use case. An SMB maintenance shop and an enterprise OEM will have different acceptable ranges for the same product. Run separate analyses.
Van Westendorp Limitations
Van Westendorp tells you what customers say, not what they'll do. Stated price tolerance doesn't always match actual purchase behavior. It works best for products customers understand well. For new or technically complex products, respondents may struggle to evaluate prices meaningfully.
The method also assumes customers actually know what they'd pay. In B2B, where purchases involve committees and budget cycles, individual survey responses may not reflect real buying decisions.
Use Van Westendorp as one input, not the final answer. It's most useful for validating EVE-derived prices or narrowing a price range before launch.
Conjoint Analysis
Conjoint analysis measures how customers make trade-offs between product features and price. Instead of asking directly about willingness to pay, it presents choices between different product configurations at different prices. The pattern of choices reveals what customers actually value.
According to Qualtrics' pricing research methodology, conjoint analysis works by decomposing preferences. If price is included as an attribute, you can calculate the dollar value customers place on each feature.
For example, a survey might show:
Option A: Standard motor, 2-year warranty, $1,200 Option B: Premium motor, 1-year warranty, $1,400 Option C: Standard motor, 3-year warranty, $1,350
Respondents choose repeatedly. Statistical analysis reveals that customers value the premium motor at $180 more than standard, and an extra year of warranty at $75. This quantifies willingness to pay for specific features.
B2B Conjoint Challenges
Conjoint was designed for consumer products. Applying it to B2B requires care. According to GLG Insights, B2B conjoint faces two problems:
Complex solutions don't reduce easily. A consumer choosing between cell phone plans can evaluate 4-5 attributes. An industrial equipment buyer considers dozens of factors: lead time, warranty terms, service response, technical support, spare parts availability, installation support, and more. Boiling this down to survey-able attributes loses nuance.
Respondents lack reference points. Consumers have experience with many similar purchases. B2B buyers may purchase a specific type of equipment once every five years. They lack the intuition to make confident trade-offs.
When Conjoint Makes Sense
Conjoint works in B2B when:
- The product has clear, discrete features customers understand
- Buyers have recent experience with similar purchases
- You're comparing a manageable number of attributes (typically 4-6)
- Sample size is sufficient (typically 100+ respondents for reliable results)
It's particularly useful for Good-Better-Best tier design, where you need to understand which features justify premium pricing and which should be in the base tier.
For many mid-market industrial companies, the cost and complexity of rigorous conjoint studies outweigh the benefits. EVE models built from customer interviews often yield similar insights with less overhead.
Good-Better-Best Tiering
Good-Better-Best (G-B-B) pricing creates three tiers at different price points, each with distinct feature sets. According to Harvard Business Review's 2018 analysis, this structure addresses a common problem: companies crimp profits by using discounts to attract price-sensitive customers while failing to give high-end customers reasons to spend more.
The three tiers serve different purposes:
- Good: Stripped-down version to attract price-sensitive buyers and compete with low-cost alternatives
- Better: Your standard offering for the core market
- Best: Feature-laden premium version for customers who want more and will pay for it
Designing Effective Tiers
The challenge is deciding what goes in each tier. Get it wrong and you either cannibalize your Better tier (everyone buys Good) or create a Best tier nobody wants.
According to Stripe's tiered pricing guide, effective tier design follows these principles:
Each tier must have a clear "fence." The Good tier needs limitations that make it genuinely unsuitable for customers who can afford Better. This might be volume limits, feature restrictions, or service levels. Without fences, price-insensitive customers trade down.
The Best tier needs obvious value. Premium pricing works when customers can clearly see what they're getting. Vague "enhanced support" doesn't justify 50% higher prices. Specific benefits do: dedicated account manager, 4-hour response time, annual on-site review.
Price gaps should reflect value gaps. If Better is 30% more than Good, it needs to deliver at least 30% more perceived value. Zendesk's tiered structure (Essential through Enterprise) helped them grow revenue from $430.5 million in 2017 to $1.03 billion in 2020, according to company filings, by capturing both SMB and enterprise segments.
G-B-B for Distribution and Manufacturing
For distributors, tiering often applies to service levels rather than product features:
| Tier | Service Level | Typical Premium |
|---|---|---|
| Good | Standard delivery, web ordering, email support | Base price |
| Better | Priority delivery, dedicated rep, phone support | +8-15% |
| Best | Same-day availability, technical support, on-site service | +20-35% |
For manufacturers, tiering works on product configurations:
| Tier | Product Configuration | Margin |
|---|---|---|
| Good | Standard spec, minimum order quantity, standard lead time | 22-26% |
| Better | Modified spec, flexible quantities, expedited available | 28-34% |
| Best | Custom engineering, single-piece orders, guaranteed lead time | 35-45% |
The key insight: you're not just tiering products. You're tiering the value of working with you. A customer who needs guaranteed 48-hour delivery and technical phone support is getting more value than one who orders standard items online. Price should reflect that.
Choosing the Right Model
Different situations call for different frameworks:
| Situation | Recommended Model | Why |
|---|---|---|
| Differentiated product, quantifiable benefits | EVE | Lets you calculate value ceiling and build sales tools |
| New product launch, unknown price tolerance | Van Westendorp | Quick read on acceptable range before launch |
| Feature prioritization, tier design | Conjoint | Reveals which features drive willingness to pay |
| Diverse customer base, mixed needs | Good-Better-Best | Captures different segments without discounting |
Many companies use multiple models. EVE to set the ceiling, Van Westendorp to validate with customers, and G-B-B to structure the offer for different segments.
Implementation Steps
Here's how to move from cost-plus to value-based pricing without a year-long project:
Week 1-2: Identify candidates. Not everything should be value-priced. Look for products where you have differentiation, customers have low price sensitivity, and you can quantify the benefit. Usually 10-20% of your catalog fits.
Week 3-4: Build EVE models. Pick your top 5 candidates. Interview customers about their alternatives, quantify value drivers, and calculate total economic value. This becomes your sales tool and your price ceiling.
Month 2: Test and adjust. Run Van Westendorp surveys with 30-50 customers in your target segment. Compare stated acceptable ranges to your EVE-derived prices. Adjust if there's a major gap.
Month 3: Structure the offer. Design Good-Better-Best tiers for your value-priced products. Create clear fences between tiers. Train sales on value-based selling.
Ongoing: Measure and refine. Track win rates, margin realization, and customer feedback by tier. Value-based pricing is iterative, not static.
Common Mistakes
Claiming value without quantifying it. "Our product delivers superior performance" isn't value-based pricing. "$12,400 in annual maintenance savings, documented in customer X's case study" is. Without numbers, customers see marketing fluff.
Overcomplicating tier structures. Three tiers is enough. Five tiers creates confusion. As Railsware's B2B SaaS analysis notes, successful companies keep tier names simple (Starter, Professional, Enterprise) and describe each in one sentence.
Ignoring the "too cheap" signal. Van Westendorp reveals a floor price below which customers question quality. Pricing below this floor to win deals can backfire. In B2B, suspiciously low prices trigger procurement audits and risk concerns.
Assuming all customers value the same things. A plant maintenance manager values uptime. A procurement manager values total cost. An engineer values specs. Your EVE model needs to speak to whoever influences the purchase.
Making Value Pricing Stick
Value-based pricing fails when it lives only in the pricing team's spreadsheets. For it to work, sales needs tools and training.
Create value calculators sales reps can use in customer meetings. Build case studies with specific ROI numbers from real customers. Train reps to lead with value before discussing price.
Most importantly, align incentives. If sales reps are compensated on revenue without margin weighting, they'll default to discounting. Value-based pricing requires value-based selling, and that requires compensation structures that reward margin, not just volume.
For more on building a complete pricing strategy, see our B2B Pricing Strategy guide.
Last updated: Invalid Date
Frequently Asked Questions

Want to analyze your entire product catalog?
Pryse automatically identifies margin leakage across thousands of SKUs. Upload your data and find hidden profit in 24 hours.
One-time $1,499 diagnostic. No subscription required.