Dynamic Pricing Strategy: How to Implement It in 2026 (With Real Results)
Learn how to build a dynamic pricing strategy that works. Includes implementation steps, data requirements, algorithm types, and real B2B results showing 1-5% margin gains.
A dynamic pricing strategy adjusts product prices automatically based on real-time market conditions—demand, supply, competitor moves, inventory levels, and customer behavior. The right strategy can lift margins 1-5% without losing volume. The wrong one damages customer relationships and generates pricing chaos.
The difference between success and failure isn't the algorithm. It's the strategy: clear objectives, smart constraints, clean data, appropriate update frequency, and human oversight. Airlines generate billions using dynamic pricing updated twice daily. B2B distributors using the same algorithms but updating prices hourly have seen sales teams revolt and customer churn spike.
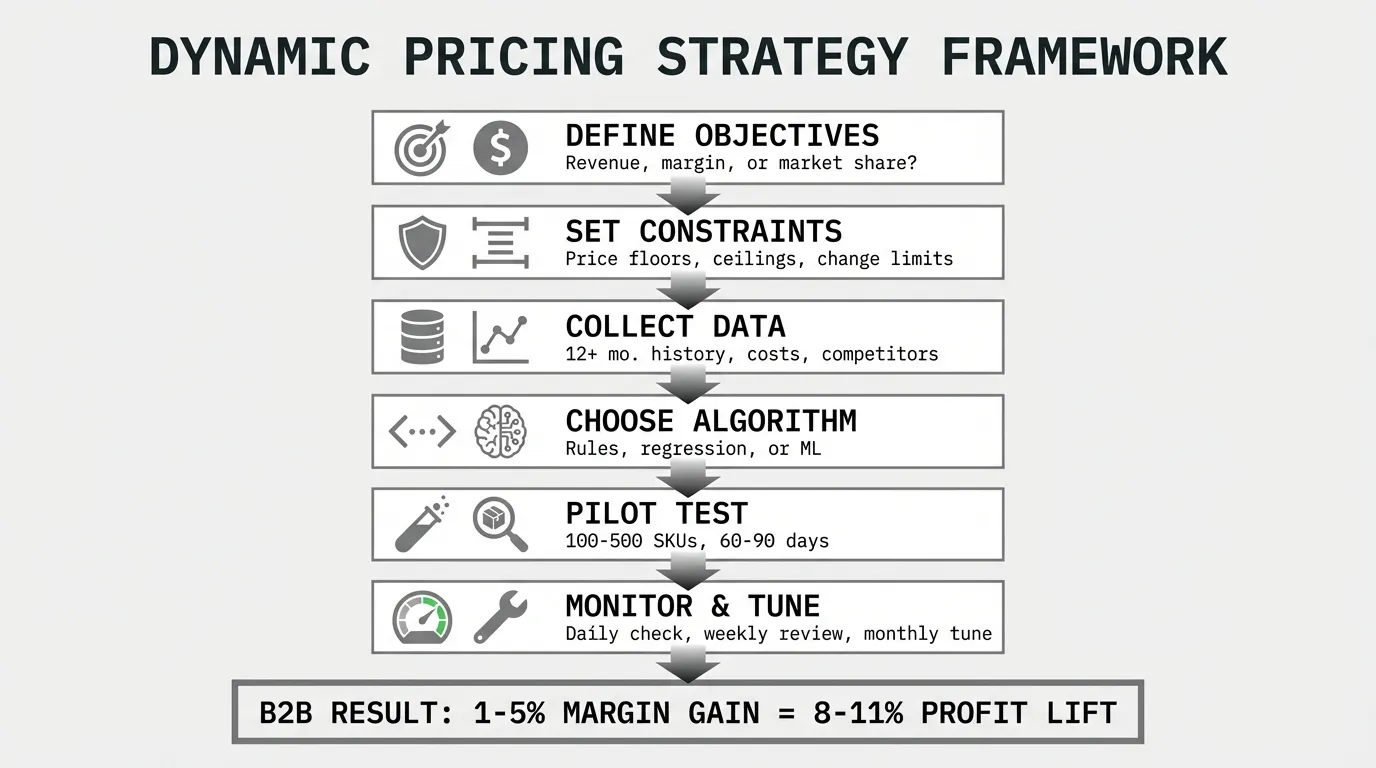
This guide walks through building a dynamic pricing strategy that works for your business model: defining goals, collecting data, choosing algorithms, launching pilots, and monitoring results. You'll see what B2B distributors achieve (1-5% margin gains according to Revology Analytics), where implementations fail, and how to avoid expensive mistakes.
What is a Dynamic Pricing Strategy?
A dynamic pricing strategy is a framework for automatically adjusting prices in response to market conditions using algorithms that monitor data inputs and apply pricing logic to optimize outcomes.
The strategy defines:
- Objectives: What you're optimizing for (revenue, profit, market share, inventory clearance)
- Constraints: Boundaries preventing bad outcomes (price floors, ceilings, maximum daily changes)
- Data inputs: What the algorithm monitors (competitor prices, demand signals, inventory)
- Pricing logic: How the algorithm calculates optimal prices (rules, regression, machine learning)
- Update frequency: How often prices change (hourly, daily, weekly)
- Oversight: Who monitors results and when humans intervene
According to Harvard Business School research, dynamic pricing allows businesses to adjust prices in real-time, maximizing revenue by raising prices during peak demand and offering discounts during slower periods to optimize profitability throughout the sales cycle.
What makes it strategic (not just reactive):
A strategy connects pricing decisions to business goals. Airlines use dynamic pricing to maximize revenue per flight. Hotels use it to optimize occupancy rates. E-commerce uses it to win the Buy Box while protecting margins. B2B distributors use it to maintain target margins despite volatile commodity costs.
Without strategy, you have automated repricing that chases competitor moves without considering whether those moves make sense, or algorithms that maximize short-term revenue by alienating long-term customers.
Dynamic Pricing Strategy Types
Different businesses need different dynamic pricing approaches. Choosing the wrong type for your business model causes most implementation failures.
Time-Based Dynamic Pricing
Prices change on a schedule based on predictable patterns.
How it works:
- Set prices in advance based on time of day, day of week, or season
- Higher prices during known peak periods (Friday evenings, holidays)
- Lower prices during known slow periods (Tuesday mornings, off-season)
Examples:
- Electricity utilities charging more during 4-9 PM peak demand
- Hotels raising weekend rates, lowering midweek rates
- Restaurants offering early-bird discounts before 6 PM
Best for: Businesses with predictable demand cycles and customers who can shift purchase timing if price-sensitive.
Implementation: Simplest to implement. Doesn't require real-time data feeds or complex algorithms. Can be managed in spreadsheets or basic pricing software.
Demand-Based Dynamic Pricing (Surge Pricing)
Prices respond to real-time demand signals.
How it works:
- Monitor current demand vs. available supply
- Increase prices when demand exceeds supply
- Decrease prices when supply exceeds demand
Examples:
- Uber surge pricing during bad weather or events
- Broadway show tickets priced higher for Saturday evenings
- Disney park admission varying by expected crowd size
Best for: Fixed capacity businesses (rides, hotel rooms, event seats) where unsold inventory has zero value after the moment passes.
Implementation: Requires real-time demand monitoring. Works best when customers understand supply constraints create legitimate price differences.
Competitor-Based Dynamic Pricing
Prices respond to competitor moves.
How it works:
- Monitor competitor prices via web scraping or data feeds
- Set pricing rules relative to competitors (match, beat by X%, stay within range)
- Update prices when competitors change theirs
Examples:
- Amazon matching Walmart and Target on popular products
- Gas stations matching prices within a few blocks
- E-commerce sellers undercutting to win Buy Box
Best for: Commoditized products where customers easily compare prices and will switch for small differences. High transaction volume with limited customer relationships.
Implementation: Requires competitor price feeds and repricing automation. Works well for e-commerce. Dangerous in B2B where customer relationships matter more than being $0.50 cheaper.
Inventory-Based Dynamic Pricing
Prices respond to inventory levels.
How it works:
- Monitor days-on-hand for each SKU
- Increase discounts as inventory ages
- Raise prices on fast-moving items with low stock
Examples:
- Airlines discounting seats as departure nears (if undersold)
- Grocery stores discounting produce approaching expiration
- Distributors clearing slow-moving or obsolete inventory
Best for: Perishable products, fashion/seasonal items, or products with obsolescence risk. Prevents write-offs by capturing some value before inventory becomes worthless.
Implementation: Requires accurate real-time inventory visibility. Set discount schedules based on shelf life or days-on-hand thresholds.
Customer Segment-Based Dynamic Pricing
Different customer segments see different prices based on characteristics or behavior.
How it works:
- Segment customers by order volume, margin contribution, or purchase frequency
- Apply different pricing strategies to each segment
- High-value segments get stable pricing, transactional segments face dynamic pricing
Examples:
- B2B distributors offering contract pricing to high-volume customers, dynamic spot pricing to occasional buyers
- SaaS companies charging SMBs list price, negotiating enterprise pricing
- Airlines offering stable corporate rates, dynamic consumer rates
Best for: B2B companies with mixed customer types—some relationship-based, some transactional.
Implementation: Requires customer segmentation and different pricing workflows by segment. More complex operationally but protects key relationships while optimizing transactional business.
Cost-Plus Dynamic Pricing
Prices maintain target margins despite cost fluctuations.
How it works:
- Monitor supplier costs or commodity indices
- Adjust customer prices to maintain target margin percentage
- Update prices daily, weekly, or monthly based on cost movements
Price = Current COGS × (1 + Target Margin %)Examples:
- Metals distributors linking prices to London Metal Exchange indices
- Fuel distributors passing through refinery cost changes
- Chemical distributors adjusting for raw material volatility
Best for: Distribution businesses selling commodity products with volatile supplier costs. Customers understand prices must reflect current replacement costs.
Implementation: Requires timely cost data feeds (from suppliers or commodity exchanges). Set target margins by product category and update prices on a schedule customers accept.
Step 1: Define Your Pricing Objectives and Constraints
Before choosing algorithms or software, clarify what you're trying to accomplish and what boundaries prevent disaster.
Choose Your Primary Objective
You can't optimize for everything simultaneously. Pick one primary objective:
Maximize revenue:
- Focus on capturing willingness to pay during high demand
- Accept some customer complaints about "price gouging"
- Best for: Airlines, hotels, events with fixed capacity and perishable inventory
Maximize profit margin:
- Focus on maintaining or improving margin percentage
- Accept some volume loss if margin increases compensate
- Best for: B2B distributors competing on value, not just price
Maximize market share:
- Focus on competitive positioning and volume growth
- Accept lower margins to win customers from competitors
- Best for: New entrants, product launches, or businesses with network effects
Clear excess inventory:
- Focus on converting aging inventory to cash
- Accept margin erosion to prevent write-offs
- Best for: Seasonal products, perishable goods, or obsolescence-prone SKUs
Maintain consistent margins despite cost volatility:
- Focus on passing cost changes through to customers
- Accept that volumes will fluctuate with market prices
- Best for: Commodity distributors with transparent cost structures
According to research on dynamic pricing implementation, it's important to have clear objectives so you can come up with ways to meet them using dynamic pricing. Whether you're aiming to gain market share, boost revenue, or introduce a new product, defining your business goals helps you know where to place effort and what metrics to track.
Set Hard Constraints
Constraints prevent algorithms from making decisions that technically optimize the objective but destroy your business.
Price floors (minimum prices):
- Never price below cost + minimum margin
- Never price below brand positioning thresholds (luxury brands can't discount 70%)
- Set different floors by customer segment (protect margins with small buyers)
Minimum Price = COGS × (1 + Minimum Margin %)Price ceilings (maximum prices):
- Never exceed 2x median competitor price (prevents pricing out of market)
- Cap maximum daily price increase (prevents sticker shock)
- Set maximum "surge" multiplier (Uber caps emergency surge at 1.5x)
Change frequency limits:
- Maximum price changes per day/week
- Minimum time between changes for same SKU
- Different frequencies by customer type (contracts get annual changes, spot market gets daily)
Relationship protection:
- Exclude strategic accounts from automated pricing
- Require sales manager approval for prices above threshold
- Lock contract pricing for duration of agreement
Balance Multiple Objectives with Weighted Scoring
If you have multiple objectives, assign weights:
Price Score = (0.5 × Revenue Impact) + (0.3 × Margin Impact) + (0.2 × Competitive Position)This approach selects prices that optimize the weighted combination rather than single-mindedly chasing one metric.
Step 2: Collect and Clean the Data
Dynamic pricing lives or dies on data quality. According to implementation guides, you need "clean" data to make your prices effectively dynamic. Bad data creates bad prices.
Internal Historical Data (Required)
Transaction history: 12+ months minimum
- SKU/product identifier
- Customer identifier
- Transaction date and time
- Quantity sold
- Price charged (invoice price and pocket price after discounts)
- Cost of goods sold (COGS)
- Freight/shipping costs
- Payment terms
Why you need this much: Algorithms learn price elasticity from historical patterns. One quarter isn't enough to separate seasonal effects from price sensitivity. Two years is better than one.
Common data quality issues:
- Duplicate SKU identifiers (same product with multiple SKU numbers)
- Missing or zero COGS (can't calculate margin)
- Inconsistent units (cases vs. each, pounds vs. kilograms)
- Bundled pricing (multiple SKUs sold as package with unclear individual prices)
Expect to spend 30-50% of implementation time on data quality issues.
Current Inventory Data (Required)
- SKU-level inventory on-hand
- Days of supply remaining
- Inventory location (if multi-warehouse)
- Inventory age (days on shelf)
- Reorder lead times
Why you need this: Inventory-based pricing requires real-time visibility. If your inventory data is updated weekly, you can't implement daily repricing without errors.
Competitor Pricing Data (Highly Recommended)
For e-commerce:
- Web scraping (automated bots checking competitor websites)
- Price intelligence platforms (Prisync, Competera, Price2Spy)
- Marketplace API data (Amazon, eBay)
For B2B:
- Manual price checks from published price lists
- Customer-reported competitive quotes
- Industry pricing indices (commodity markets)
Update frequency: Depends on market dynamics. E-commerce needs daily or hourly updates. B2B distribution can use weekly updates.
Caution: Scraping competitor websites may violate terms of service. Use third-party data providers or public price feeds when possible.
Demand Signal Data (Optional but Valuable)
- Website traffic and product page views
- Search volume trends (Google Trends, keyword tools)
- Cart abandonment rates
- Email open rates and click-through rates
- Social media mentions and sentiment
These signals predict demand changes before they appear in sales data, letting you adjust prices proactively.
External Market Data (Industry-Specific)
Commodity markets:
- London Metal Exchange (metals)
- NYMEX futures (energy, chemicals)
- Baltic Dry Index (shipping costs)
Economic indicators:
- Currency exchange rates (for importers/exporters)
- Fuel prices (affects freight costs)
- Housing starts (construction materials)
Link these to pricing automatically if your costs track these indices.
Step 3: Choose Your Pricing Algorithms
The algorithm translates your objectives and data into actual prices. Three main types, ranging from simple to sophisticated.
Rule-Based Pricing (Start Here)
Define explicit pricing logic:
Example rules:
- If competitor price < our price, match within 24 hours (subject to margin floor)
- If inventory > 60 days of supply, discount 15%
- If inventory > 90 days of supply, discount 30%
- If demand increases 50% week-over-week, raise price 10%
- Never price below cost + 12% margin
Advantages:
- Predictable and explainable
- Easy to test and debug
- Works in spreadsheets or basic software
- No "black box" concerns
Disadvantages:
- Can't handle complex multi-variable scenarios
- Doesn't learn from outcomes
- Requires manual tuning as market changes
Best for: Testing dynamic pricing before investing in sophisticated software. Small businesses (under 1,000 SKUs). Industries where pricing logic is transparent and straightforward.
According to dynamic pricing implementation research, when deciding on implementation method, you have to choose whether to use rule-based or AI-powered approaches to guide price determination.
Regression Models (Mid-Range Sophistication)
Statistical models predict optimal price based on historical data:
Optimal Price = Base Price + (Demand Factor × Coefficient₁) + (Inventory Factor × Coefficient₂) + (Competitor Factor × Coefficient₃)The model learns coefficients from historical data, answering "What price historically maximized profit when demand was high and inventory was low?"
Advantages:
- Handles multiple variables simultaneously
- Learns from historical patterns
- More sophisticated than rules, less opaque than neural networks
- Coefficients are interpretable
Disadvantages:
- Assumes linear relationships (real pricing often non-linear)
- Requires clean historical data with enough variation
- Doesn't adapt to market changes without retraining
Best for: Mid-market companies (1,000-10,000 SKUs) with clean historical data. Businesses wanting to scale beyond rules but not ready for full AI investment.
Machine Learning Models (AI-Powered)
Advanced algorithms (reinforcement learning, neural networks) experiment with prices and learn optimal strategies.
How reinforcement learning works:
- Algorithm tries a price
- Observes outcome (sales volume, margin, customer response)
- Adjusts strategy to maximize objective
- Repeats continuously
According to research on dynamic pricing algorithms, reinforcement learning is a goal-directed dynamic pricing model which aims to achieve the highest rewards by learning from environmental data.
Advantages:
- Handles complex non-linear relationships
- Discovers patterns humans wouldn't notice
- Adapts to changing market conditions automatically
- Scales to thousands or millions of SKUs
Disadvantages:
- "Black box"—hard to explain why specific prices were chosen
- Requires large datasets (typically 100K+ transactions)
- Expensive ($100K+ annually for enterprise platforms)
- Technical expertise needed to implement and tune
Best for: Large enterprises (10,000+ SKUs, millions in revenue). E-commerce with high transaction volumes. Companies with dedicated pricing analytics teams.
Hybrid Approach (Recommended for Most B2B)
Combine algorithm types:
- Use ML to recommend prices
- Apply rule-based guardrails (floor, ceiling, maximum change)
- Require human approval for strategic accounts or high-value transactions
This captures AI benefits while maintaining control and explainability.
Step 4: Select Software and Tools
Your algorithm choice determines software requirements.
For Rule-Based Pricing (Budget: $0-$20K)
Excel or Google Sheets:
- Build pricing formulas referencing cost data and inventory
- Conditional formatting flags outliers
- Manual export to ERP or e-commerce platform
Business intelligence tools (Tableau, Power BI, Looker):
- Connect to ERP and inventory systems
- Build pricing dashboards with recommended prices
- Export price lists for upload
Mid-market pricing tools:
- Pricefx (starts ~$20K annually)
- PROS (starts ~$50K annually for small implementations)
- Zilliant (B2B-focused, starts ~$40K annually)
For Regression/ML-Based Pricing (Budget: $50K-$500K)
Enterprise platforms:
- PROS (B2B and B2C, strong in manufacturing/distribution)
- Vendavo (B2B focus, distribution and manufacturing)
- Pricefx (B2B and B2C, modular pricing suite)
- Competera (e-commerce focus, retail and online)
- Zilliant (B2B focus, price optimization and management)
These platforms include:
- Automated data ingestion from ERP/e-commerce systems
- Pre-built ML models optimized for pricing
- Scenario testing and simulation
- Integration with quote and order systems
- User management and approval workflows
Budget $100K-$500K annually including software subscription plus implementation services.
Build vs. Buy Decision
Build custom solution if:
- You have unique data sources or algorithms
- Internal data science team with pricing expertise
- Existing analytics infrastructure to leverage
- Budget for 6-12 month development timeline
Buy platform if:
- Standard use case (e-commerce repricing, B2B optimization)
- No internal data science team
- Need to launch within 3 months
- Want vendor support and ongoing updates
Most companies should buy. Pricing platforms have invested millions in algorithm development and have seen thousands of implementations. Unless you're Amazon or Uber with unique requirements, buying is faster and lower risk.
Step 5: Start With a Low-Risk Pilot
Never roll out dynamic pricing across your entire catalog on day one.
Select Pilot Products
Choose 100-500 SKUs with these characteristics:
Good data quality:
- Clean historical sales data
- Accurate COGS
- Reliable inventory visibility
Low customer sensitivity:
- Not tied to long-term contracts
- Not strategic high-visibility products
- Transactional sales without deep customer relationships
Moderate volume:
- Enough transactions to learn quickly (10+ sales per week)
- Not so high-volume that errors cause major damage
Clear success metrics:
- Existing baseline margin and volume to compare against
Avoid for pilot:
- Your top 10 customers' preferred products
- New products without pricing history
- Products with complex bundling or discounting
- Products tied to contracts prohibiting price changes
Set Conservative Constraints
For the pilot, use tighter constraints than your long-term strategy:
- Limit price changes to ±5% (vs. ±10% long-term goal)
- Update prices weekly (vs. daily long-term)
- Cap number of price changes per SKU per month
- Require manager approval for changes above $X or Y%
Run for 60-90 Days
Monitor daily but judge results after sufficient time:
- 30 days: Spot obvious errors and customer complaints
- 60 days: See margin and volume trends emerge
- 90 days: Compare to control group with statistical confidence
Measure Against Control Group
Don't just measure pilot SKU performance in isolation. Compare to similar SKUs without dynamic pricing (control group) to isolate the impact.
Key metrics to track:
- Margin percentage (gross and net)
- Sales volume (units and revenue)
- Price realization (average selling price vs. list price)
- Customer complaints or objections
- Sales team adoption and feedback
According to Revology Analytics, clients typically achieve impressive gross profit margin gains, often realizing net price realization impacts in the 1-5% range, which flows directly to operating profits.
Decide: Expand, Adjust, or Abandon
Expand if: Margins improved, volume stayed stable or grew, no significant customer complaints, sales team can manage the process.
Adjust if: Results are mixed. Margin improved but volume dropped too much. Or volume grew but margins compressed. Tune constraints and run another 60 days.
Abandon if: Customers complained loudly, sales team refused to use it, operational friction was too high, or results were neutral or negative after 90 days.
Step 6: Monitor Daily, Tune Weekly, Review Monthly
Dynamic pricing isn't "set it and forget it." Plan for ongoing management.
Daily Monitoring Checklist
Spend 15-30 minutes daily reviewing:
Pricing errors and outliers:
- Any prices below cost?
- Any prices 3x+ higher than yesterday?
- Any SKUs with zero prices?
- Any competitor prices that look like data errors?
Customer complaints:
- Sales team reports of pricing objections
- Customer service tickets about pricing
- Lost orders due to price (vs. other reasons)
Competitive positioning:
- Are you losing Buy Box to competitors?
- Have competitors made major price moves?
Inventory issues:
- Automated discounts triggering for products that shouldn't be discounted
- Fast-moving products with low inventory priced too low
Weekly Performance Review
Spend 1-2 hours weekly analyzing:
Margin performance by product, customer, and category:
- Which SKUs saw margin improvement?
- Which saw margin erosion?
- Overall net margin change vs. baseline
Volume impact:
- Did sales volume increase, decrease, or stay stable?
- Is revenue up or down after accounting for price changes?
Price elasticity observations:
- Which products showed elastic demand (volume dropped when price increased)?
- Which showed inelastic demand (volume stable despite price changes)?
Competitive response:
- Did competitors match your price increases?
- Did they undercut your decreases?
Monthly Algorithm Tuning
Based on weekly observations, adjust strategy:
Tighten or loosen constraints:
- If you're consistently hitting ceiling prices, raise the ceiling
- If margins eroded, raise the floor
Adjust objectives:
- If volume dropped too much, weight market share higher
- If margins improved with stable volume, be more aggressive
Expand or contract SKU coverage:
- Add more SKUs if pilot succeeded
- Remove SKUs if causing problems
Update competitive positioning rules:
- If winning too much, test higher prices
- If losing share, adjust competitive logic
Quarterly Strategic Review
Every 90 days, step back and assess:
Are objectives still correct?
- Has your business strategy changed?
- Should you shift from growth to margin focus (or vice versa)?
Is the software/algorithm still appropriate?
- Have you outgrown rule-based pricing?
- Is it time to upgrade to ML-based optimization?
What new data sources could improve results?
- Competitor price feeds you didn't have initially
- Demand signals (search trends, economic indicators)
Should you expand to more products or customer segments?
- After success with transactional SKUs, test with relationship-based products
- After success in one category, expand to adjacent categories
Dynamic Pricing Strategy for B2B Companies
Most B2B companies need a different approach than B2C businesses because relationships matter more than algorithmic optimization.
Why Standard Dynamic Pricing Fails in B2B
According to Simon-Kucher research, historically, B2B prices change once or twice a year, and buyers expect the same prices to be valid in the long term.
Customer relationship complexity: B2B buyers build relationships with suppliers over years. Pricing stability is part of that trust. Daily price changes signal unreliability.
Negotiated contracts: Many B2B customers have fixed pricing for 6-12 months. Dynamic pricing conflicts with contractual commitments.
Sales team resistance: Salespeople resist automated pricing that removes discretion. Simon-Kucher found that sales teams can view AI-driven pricing as a threat to their control or customer relationships.
Implementation complexity: B2B pricing has more variables than B2C: customer size, order volume, payment terms, freight, service levels, and negotiated rebates.
B2B Dynamic Pricing Strategy That Works
According to Copperberg, for manufacturers and distributors, dynamic pricing—enabled by AI, machine learning, and big data—offers a way to stay ahead of shifting costs, fluctuating demand, and evolving customer expectations.
Segment customers by relationship type:
Tier 1 (Strategic accounts):
- Annual contract pricing negotiated with sales leadership
- Prices locked for contract duration
- NO dynamic pricing
Tier 2 (Regular customers):
- Quarterly price reviews
- Prices update based on cost changes and market conditions
- Semi-dynamic pricing (algorithmic recommendations, manager approval)
Tier 3 (Transactional/spot buyers):
- Weekly or monthly price updates
- Algorithm-driven pricing with guardrails
- Full dynamic pricing
Use cost-plus dynamic pricing for commodity products:
Link prices to commodity indices or supplier costs:
Price = Current Commodity Index × Multiplier + Distribution MarginA metals distributor might price based on London Metal Exchange spot prices. A chemical distributor might link to raw material indices. Customers understand these cost pass-throughs.
Update prices weekly or monthly (not daily):
Match your industry norms. If competitors change prices quarterly, you can differentiate by updating monthly based on current costs. But updating daily when competitors update quarterly just confuses customers.
Give sales team override authority:
Algorithms recommend prices. Sales managers approve. Reps have override authority for strategic deals. This maintains relationships while benefiting from data-driven recommendations.
Measure net price realization, not just list price:
B2B companies leak margin through discounts, rebates, freight absorption, and payment terms. Dynamic pricing should optimize pocket price (net of all deductions), not just list price.
See our price waterfall guide for how to track pocket price.
B2B Results from Dynamic Pricing
According to research from PriceFX, B2B companies using dynamic pricing strategies have seen significant results:
- Chemical distributor: Maintained 18% gross margin despite 40% raw material volatility by linking prices to commodity indices
- Defense supplier: 22% improvement in RFQ win rate using competitive pricing intelligence
- Energy manufacturer: 2.8% margin improvement from region-specific dynamic pricing
- Specialized distributor: 15% margin enhancement in critical customer segments
Revology Analytics reports that for many wholesale distributors, a 1% improvement in average realized price translates directly into an 8-11% lift in operating profit.
Recent research found that 54% of manufacturers and distributors use price optimization strategies blending different methods, and 45% of manufacturing leaders prioritize revenue growth when adjusting pricing strategies.
Common Dynamic Pricing Strategy Mistakes
Learn from others' failures to avoid repeating them.
Mistake 1: Optimizing the Wrong Objective
The error: Maximizing revenue when you should maximize profit, or vice versa.
Example: An e-commerce seller maximized revenue by lowering prices and increasing volume. Revenue grew 15%. Profit dropped 20% because increased volume came from unprofitable sales below cost + fulfillment.
The fix: Be explicit about your primary objective before implementing. Test algorithms against historical data to verify they optimize what you want.
Mistake 2: No Price Floor or Ceiling
The error: Letting algorithms set any price within range of $0 to infinity.
Example: Amazon third-party sellers creating price loops where seller A prices 1% below seller B, and seller B prices 1% below seller A. Prices spiral to $0.01.
The fix: Set hard constraints before launch. Test with hypothetical extreme scenarios (what if competitor price is $0? What if competitor price is $1 million?).
Mistake 3: Updating Prices Too Frequently for Your Industry
The error: E-commerce frequency (multiple times per day) applied to B2B relationship sales.
Example: A B2B manufacturer updated prices daily. Sales team couldn't quote confidently. Customers complained about instability. The company abandoned dynamic pricing after 3 months.
The fix: Match update frequency to industry norms. Survey customers to understand acceptable change frequency.
Mistake 4: No Human Oversight
The error: Complete automation without monitoring.
Example: A retailer's algorithm priced a $200 item at $0.01 due to a data error. The mistake went unnoticed for 6 hours. Thousands of orders were placed before someone caught it.
The fix: Assign ownership. Someone checks daily for outliers, errors, and customer complaints. Build alerting for extreme prices.
Mistake 5: Poor Data Quality
The error: Implementing sophisticated algorithms on inaccurate data.
Example: A distributor's COGS data was 18 months old. The algorithm optimized margins based on old costs. When current costs were 30% higher, the company sold at a loss on hundreds of transactions.
The fix: Audit data quality before implementation. Spend 30-50% of project time on data cleaning. Set up data quality monitoring.
Mistake 6: No Sales Team Buy-In
The error: Implementing dynamic pricing without involving salespeople.
Example: A manufacturer rolled out dynamic pricing as a surprise. Sales team had no training on how to explain price changes. They stopped using the new prices and continued quoting from old price lists.
The fix: Involve sales leadership from day one. Provide training on how to explain price changes. Give override authority for strategic deals.
Mistake 7: Launching at Full Scale Without Testing
The error: Implementing dynamic pricing across the entire catalog on day one.
Example: A distributor applied dynamic pricing to 15,000 SKUs simultaneously. Errors affected hundreds of customers before anyone could fix them. The company lost 5% of customers during the first month.
The fix: Always pilot with 100-500 low-risk SKUs first. Test for 60-90 days before expanding. Use control groups to measure true impact.
Is Dynamic Pricing the Right Strategy for You?
Use this decision framework to assess fit.
When Dynamic Pricing Makes Sense
Strong fit:
- High transaction volume (1,000+ orders/month)
- Large product catalog (5,000+ SKUs)
- Volatile costs or competitive markets
- Perishable inventory or time-limited capacity
- Limited customer relationships (transactional sales)
- Strong price transparency and competitor monitoring
Moderate fit:
- Medium transaction volume (100-1,000 orders/month)
- Medium catalog (1,000-5,000 SKUs)
- Stable costs but dynamic competitor pricing
- Mix of transactional and relationship-based customers
- Some products where dynamic pricing makes sense, others where it doesn't
When Dynamic Pricing Doesn't Make Sense
Poor fit:
- Low transaction volume (under 100 orders/month)
- Consultative B2B sales with long-term relationships
- High order values with negotiated deals
- Customer contracts prohibit price changes
- Brand positioning emphasizes stability and trust
- Poor data quality or technical infrastructure
Alternative: Semi-Dynamic Pricing
If you're in the "moderate fit" category, consider semi-dynamic approaches:
Weekly or monthly price updates (not real-time):
- Update prices based on costs, inventory, and competition
- Change frequency customers can accept
Segment-based strategy:
- Dynamic pricing for transactional customers
- Fixed/contract pricing for strategic accounts
Category-based strategy:
- Dynamic pricing for commodity products
- Stable pricing for differentiated products
Algorithm recommendations, human approval:
- Software suggests prices based on data
- Managers review and approve before publication
Before Implementing Dynamic Pricing
Fix foundational pricing problems first:
- Analyze current margins by product, customer, and channel
- Fix obviously underpriced items (one-time adjustments)
- Reduce margin leakage from uncontrolled discounting
- Implement rule-based pricing (cost-plus with competitive positioning)
- Then evaluate whether remaining opportunities justify dynamic pricing
Most B2B companies recover 1-2% margin from steps 1-4 before needing sophisticated algorithms.
See our margin analysis guide to identify where you're leaving money on the table before investing in dynamic pricing.
Sources
- Dynamic Pricing: What It Is & Why It's Important - Harvard Business School Online
- Dynamic Pricing Algorithms in 2026: Top 3 Models - AIMultiple
- 6 Successful Dynamic Pricing Examples To Follow in 2026 - Mailmodo
- Pricing Strategy Optimization: Revenue Guide 2026 - Digital Applied
- How to Implement a Dynamic Pricing Strategy (With Examples) - Trellis
- What is a Dynamic Pricing Strategy and How to Implement It - Paddle
- Dynamic Pricing: How to Use It Without Losing Your Customers' Trust - Alphabridge
- Dynamic Pricing in B2B Manufacturing - Copperberg
- Using Dynamic Pricing Optimization in B2B Industries - Zilliant
- Dynamic Pricing for B2B: Real-Time Strategies - Revology Analytics
- Dynamic Pricing in B2B: 5 Successful Examples - PriceFX
- Dynamic Pricing in B2B: Challenge or Opportunity? - Copperberg
- AI and dynamic pricing in B2B industrial companies - Simon-Kucher
- B2B Pricing Guide - OmniBound AI
- Dynamic Pricing Tactics for B2B Tech Companies - Data-Mania
Last updated: February 24, 2026
Frequently Asked Questions

Want to analyze your entire product catalog?
Pryse automatically identifies margin leakage across thousands of SKUs. Upload your data and find hidden profit in 24 hours.
One-time $1,499 diagnostic. No subscription required.