Price Elasticity Examples: 12 Real-World Cases (Elastic vs Inelastic)
See real examples of elastic and inelastic demand across industries. Includes B2B distribution, consumer goods, tech, and transportation pricing case studies.
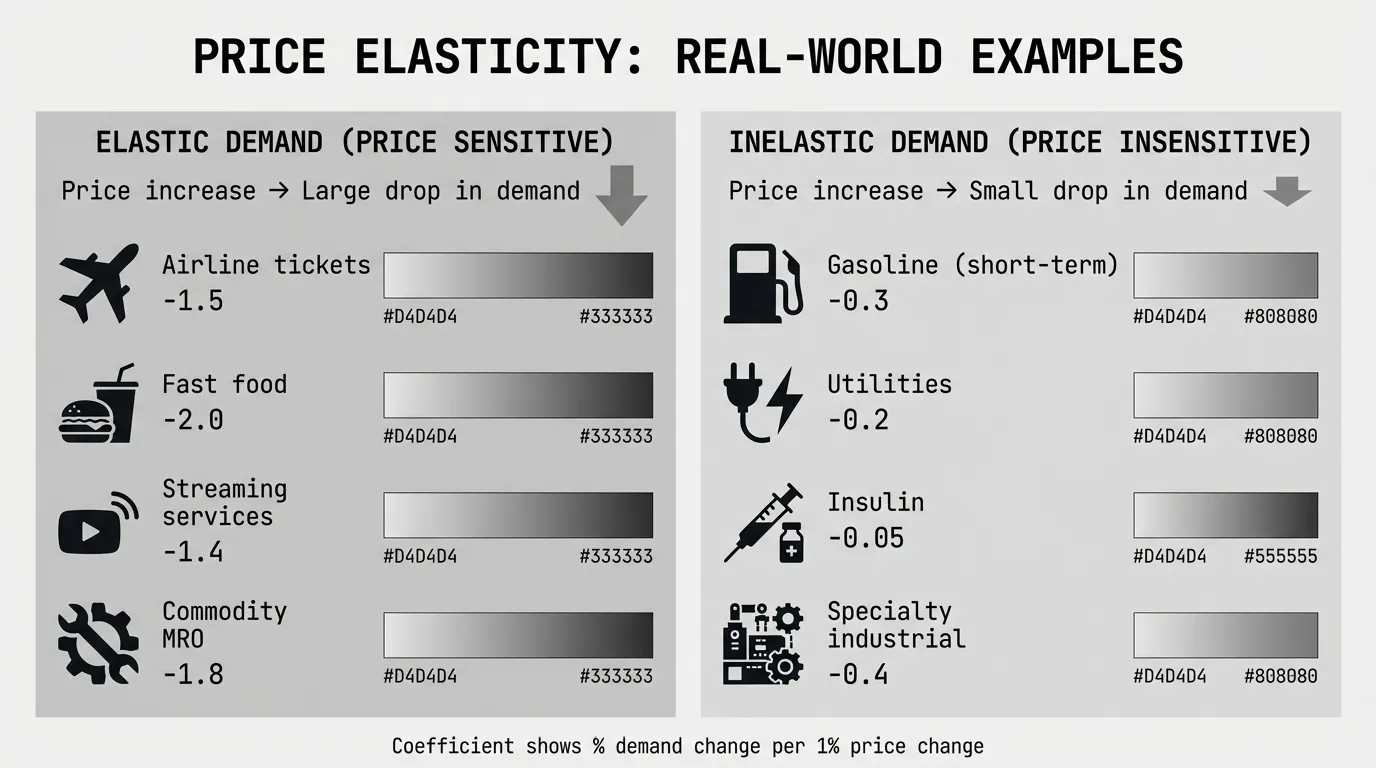
Price elasticity examples show how different products respond to price changes. Some products have elastic demand—a small price increase causes customers to buy much less. Other products have inelastic demand—even large price changes barely affect sales. The difference determines whether you can raise prices without destroying revenue.
The examples below cover consumer goods, B2B distribution and manufacturing, services, and technology. They show what elastic and inelastic demand look like in practice, with real numbers from case studies and research.
Elastic Demand Examples
Elastic demand means customers are price sensitive. A 10% price increase might cause a 15% drop in quantity demanded. Revenue falls when you raise price. Customers have alternatives, the product isn't essential, or purchases can be postponed.
1. Airline Tickets
Airline demand is elastic for leisure travel. When airfare increases, consumers postpone trips, choose cheaper destinations, or switch to driving or buses.
According to Lumen Learning's microeconomics course, when the cost of air travel rises, consumers can usually find alternatives like taking the train or bus or driving. Air travel is relatively elastic because there are substitutes.
A major airline case study found that reducing economy ticket prices by 15% increased demand by 20%, suggesting elastic demand where customers are highly price-sensitive. Business class tickets on the same flights showed inelastic demand—corporate travel budgets don't respond as much to price changes.
Elasticity coefficient: Around -1.3 to -2.0 for leisure travel.
Key driver: Abundant substitutes (other airlines, other travel modes, or skipping the trip entirely).
2. Fast Food (McDonald's, Burger King)
McDonald's hamburgers show elastic demand. Customers can easily switch to Burger King, Wendy's, Subway, or cook at home when prices increase.
According to MasterClass's elasticity guide, McDonalds hamburgers will probably have a relatively high elasticity of demand as customers can switch to other fast-food options.
Fast food chains use value menus and promotional pricing because they know demand is elastic. A 10% price increase on a Big Mac sends customers to the Whopper.
Elasticity coefficient: Estimated -1.5 to -2.5.
Key driver: Low switching costs and abundant alternatives at similar price points.
3. Streaming Subscriptions (Netflix, Spotify)
Streaming services have elastic demand. With abundant competition (Netflix, Disney+, Hulu, Max, Apple TV+), price increases drive cancellations.
According to Priceva's elastic demand guide, streaming or entertainment subscriptions have elastic demand because with abundant options and competition, price hikes often drive cancellations.
When Netflix raised prices by $2/month in 2022, subscriber growth slowed and cancellations increased. Customers downgraded to ad-supported tiers or canceled and rotated to other services. The abundance of alternatives creates price sensitivity.
Elasticity coefficient: Estimated -1.2 to -1.8.
Key driver: Low switching costs and abundant substitutes. Customers can cancel instantly and switch to competitors.
4. Consumer Electronics (Smartphones, TVs)
Consumer electronics show elastic demand for mid-range products. Customers can postpone purchases or choose cheaper alternatives when prices increase.
A smartphone manufacturer case study found that reducing the flagship model price by 10% increased demand by 15%, indicating elastic demand where customers are responsive to price changes.
Premium models (iPhone Pro, Samsung Galaxy Ultra) show less elastic demand due to brand loyalty and perceived quality. But mid-range electronics are highly elastic. Customers wait for sales or choose last year's model.
According to Lumen Learning, consumer durables like washing machines or automobiles have elastic demand and can be postponed if price rises. Automobile rebates have been very successful in increasing automobile sales by reducing price.
Elasticity coefficient: Mid-range products around -1.5; premium models closer to -0.8.
Key driver: Postponable purchases and brand differentiation effects.
5. Luxury Goods (Designer Handbags, High-End Watches)
Luxury items have elastic demand because they're not essential. When prices rise or economic conditions worsen, customers delay or skip purchases.
According to MasterClass, luxury goods are often considered examples of elastic demand because they are not essential items people need to survive, such as high-end clothing, jewellery, and designer handbags.
The 2008 financial crisis showed this clearly. Luxury goods sales collapsed while necessity goods stayed stable. A Rolex isn't essential. When discretionary income falls, luxury demand evaporates.
Elasticity coefficient: Estimated -1.5 to -3.0 depending on economic conditions.
Key driver: Non-essential nature of the product and income sensitivity.
6. Commodity MRO Supplies in Distribution
Standard maintenance, repair, and operations supplies show elastic demand in B2B markets. Items like PVC pipe, standard fasteners, common electrical components, and basic safety supplies are commodities. Customers know the market price and shop around.
A distributor sold 1,000 units of standard PVC pipe per month at $8/foot. They raised the price to $8.50/foot to recover margin. Sales dropped to 700 units. Revenue fell from $8,000/month to $5,950/month—a 25% drop. The demand curve was too elastic to support a price increase.
Elasticity coefficient: Estimated -1.5 to -2.5 for commodity items.
Key driver: Product standardization, transparent market pricing, and low switching costs.
7. Ride-Sharing (Uber Surge Pricing)
Uber's surge pricing demonstrates elastic demand in real time. The company uses dynamic pricing to balance supply and demand, measuring elasticity continuously.
According to a Toptal pricing analysis, when Uber went from 1.0x (no surge) to 1.2x surge, it resulted in a 27% drop in demand, implying a price elasticity of demand of 1.35.
A 20% price increase caused a 27% drop in ride requests. That's elastic demand. Customers chose to wait, take public transit, walk, or skip the trip when prices surged.
Elasticity coefficient: -1.35 based on Uber's data.
Key driver: Real-time availability of alternatives and non-essential nature of many trips.
Inelastic Demand Examples
Inelastic demand means customers aren't very price sensitive. A 10% price increase might cause only a 3% drop in quantity demanded. Revenue increases when you raise price. The product is essential, has few substitutes, or can't be postponed.
8. Gasoline (Short-Term)
Gasoline shows inelastic demand in the short run. When gas prices initially rise, people still need to get around so they reluctantly pay the higher price.
According to MasterClass, gasoline is quite inelastic in the short run because when gas prices initially rise, people still need to get around in their vehicles, but if gas prices were to stay extremely high for a long period of time, the gas would become a more elastic good.
Short-term elasticity is around -0.2 to -0.4. Long-term elasticity increases to -0.8 as people adjust by buying fuel-efficient cars, carpooling, or moving closer to work.
Elasticity coefficient: Short-term -0.2 to -0.4; long-term -0.8.
Key driver: Short-term necessity and lack of immediate alternatives.
9. Utilities (Electricity, Water)
Utilities show inelastic demand. Consumers don't greatly reduce usage when prices increase because electricity and water are necessities.
According to NetSuite's elasticity guide, necessities like food and fuel have inelastic demand, and healthcare, utilities, and certain "vices" like alcohol and tobacco tend to have consistent demand regardless of price or customer income.
You can't easily cut electricity usage by 20% when the rate increases 10%. You still need lights, refrigeration, heating, and air conditioning. Demand is relatively fixed in the short run.
Elasticity coefficient: Estimated -0.1 to -0.3.
Key driver: Essential nature and lack of substitutes.
10. Prescription Medications and Insulin
Life-saving medications show near-perfectly inelastic demand. Patients need the dose prescribed regardless of price. Insulin for Type 1 diabetics is the classic example.
A diabetic patient needs 20 units per day based on their medical condition. If price is $50/vial, they buy it. If price is $300/vial, they still need to buy it. Quantity is determined by medical necessity, not price.
Healthcare items like prescription drugs are inelastic because people's lives often depend on these items. There is no acceptable substitute.
Elasticity coefficient: Close to 0 (perfectly inelastic).
Key driver: Medical necessity and no substitutes.
11. Eggs (Food Staple)
Eggs show inelastic demand even during major price swings. Research from Purdue University tracked how egg prices affected sales over the past few years and found that even when prices surged by as much as 60%, sales remained steady.
According to Priceva's demand analysis, eggs are a staple food item with few direct substitutes for many cooking and baking applications. Consumers continued purchasing eggs despite significant price increases.
There may be shifts in the types of food consumers purchase (buying fewer organic eggs, switching brands), but total egg consumption stays relatively stable.
Elasticity coefficient: Estimated -0.2 to -0.4.
Key driver: Staple food status and limited substitutes for many uses.
12. Specialty Industrial Products in B2B
Mission-critical industrial components show highly inelastic demand in B2B markets. When a manufacturer has a specific adhesive, bearing, or chemical spec'd into their production process, they can't easily switch suppliers without re-engineering.
A chemical distributor sold 200 gallons per month of a specialty industrial adhesive at $120/gallon. They raised the price to $135/gallon. Sales dropped to 185 gallons. Revenue increased from $24,000/month to $24,975/month—a 4% gain. The demand curve was steep enough to support the price increase.
OEM customers with that specific formulation integrated into their production line can't switch without qualifying new materials, testing, and potentially redesigning products. Switching costs create inelastic demand.
Elasticity coefficient: Estimated -0.2 to -0.5 for mission-critical components.
Key driver: High switching costs, engineering specifications, and production integration.
How to Recognize Elastic vs Inelastic Demand in Your Business
You don't need to calculate exact elasticity coefficients to recognize the patterns.
Signs your product has elastic demand:
- Customers shop multiple suppliers before buying
- Price is the first objection in sales conversations
- Win rates drop sharply when competitors undercut your price
- Volume swings significantly when you adjust pricing
- Customers stockpile during promotions and disappear between them
- Substitutes are readily available
- Purchases can be delayed without consequences
Signs your product has inelastic demand:
- Customers order consistently regardless of small price changes
- Win rates stay stable when you're 5-10% above competition
- Volume changes little when you test price increases
- Customers don't stockpile during promotions
- Few or no direct substitutes exist
- Switching costs are high (integration, training, certifications)
- The product is mission-critical or time-sensitive
Why Elasticity Varies by Industry and Segment
The same product can be elastic for one customer segment and inelastic for another.
Example from gasoline: Overall gasoline demand is relatively inelastic. But strong local competition between filling stations makes demand elastic at the local level. If one station raises prices above nearby competitors, demand drops significantly. A customer won't drive across town to save 5 cents per gallon, but they will drive across the street.
Example from airlines: Leisure travelers show elastic demand—they postpone trips or find alternatives when prices rise. Business travelers show inelastic demand—they fly when they need to regardless of ticket price because the trip is time-sensitive and expense accounts cover the cost.
Example from B2B distribution: Large national accounts often have elastic demand because they leverage volume across multiple suppliers and have formal bid processes that emphasize price. Small local customers often have inelastic demand because relationships, service, and convenience matter more than saving 3% by switching suppliers.
Using Elasticity Examples to Improve Your Pricing
Once you recognize whether your products are elastic or inelastic, you can make better pricing decisions.
If your product is elastic (like commodity MRO supplies, fast food, streaming services):
- Don't chase margin through price increases—you'll lose volume faster than you gain margin
- Compete on service, convenience, selection, and total cost of ownership
- Use volume discounts and promotional pricing strategically
- Watch competitor pricing closely and respond quickly
- Focus on cost reductions to improve profitability without raising price
If your product is inelastic (like specialty chemicals, mission-critical components, utilities):
- Test price increases on customer segments—start with 3-5% and measure response
- Expand pricing power where you find it
- Focus on margin expansion, not volume protection
- Invest in differentiation that increases switching costs
- Pass through cost increases promptly—customers will accept them
If elasticity varies by segment:
- Price discriminate legally by offering different service levels, payment terms, order minimums, and contract lengths
- Protect pricing on inelastic segments (specialty, mission-critical, integrated customers)
- Compete aggressively on elastic segments (commodity, transactional, price-sensitive customers)
- Don't average elasticity across segments and apply the same strategy everywhere
Common Mistakes When Using Elasticity Examples
Mistake 1: Assuming your product is like the examples
Fast food is elastic. That doesn't mean your restaurant is elastic. Elasticity depends on your specific competitive position, customer relationships, and switching costs. Use the examples to understand the pattern, then measure your own elasticity with transaction data.
Mistake 2: Treating elasticity as static
Demand elasticity changes over time. During economic booms, customers become less price sensitive (more inelastic). During downturns, they become more price sensitive (more elastic). A product that was inelastic in 2022 might be elastic in 2026.
Mistake 3: Ignoring long-term vs short-term elasticity
Gasoline is inelastic in the short run but more elastic long-term. If you raise prices on a B2B product with annual contracts, you might not see the volume impact until contracts renew 6-12 months later. Short-term volume stability doesn't prove inelastic demand.
Mistake 4: Confusing correlation with causation
You raised price 8% and volume dropped 12%. That looks elastic. But maybe volume dropped because a competitor launched a better product, your lead times increased, or the customer's industry slowed. Isolating the price effect from other variables requires controlled testing or regression analysis.
Next Steps
The examples above show what elastic and inelastic demand look like across industries. You don't need perfect elasticity measurements to make better pricing decisions. You need to recognize the pattern: Are your customers price sensitive or not? Do they have alternatives? Can they postpone purchases?
For more on calculating your own price elasticity from transaction data, see our posts on the Price Elasticity Formula, Price Elasticity Calculator, and Price Elasticity of Demand Midpoint Formula.
To understand how elasticity shows up visually in demand curves, see our guide on the Price Elasticity of Demand Curve.
If you're trying to identify pricing opportunities across thousands of SKUs without manually analyzing each one, Pryse's margin diagnostic analyzes your transaction data to find margin leakage, pricing inconsistencies, and opportunities for price increases on products where you have pricing power.
Sources
- How to Calculate Price Elasticity of Demand - MasterClass
- Reading: Examples of Elastic and Inelastic Demand - Lumen Learning
- Elastic vs Inelastic Demand: Complete Guide - Priceva
- Price Elasticity 2.0: From Theory to The Real World - Toptal
- What Is Elasticity of Demand? - NetSuite
- 5 Price Elasticity of Demand Examples - Symson
Last updated: February 24, 2026
Frequently Asked Questions

Want to analyze your entire product catalog?
Pryse automatically identifies margin leakage across thousands of SKUs. Upload your data and find hidden profit in 24 hours.
One-time $1,499 diagnostic. No subscription required.