Price Elasticity Calculator: Calculate PED in Seconds
Use a price elasticity calculator to measure how demand changes when you adjust prices. Learn what to look for, how to interpret results, and when to build your own.
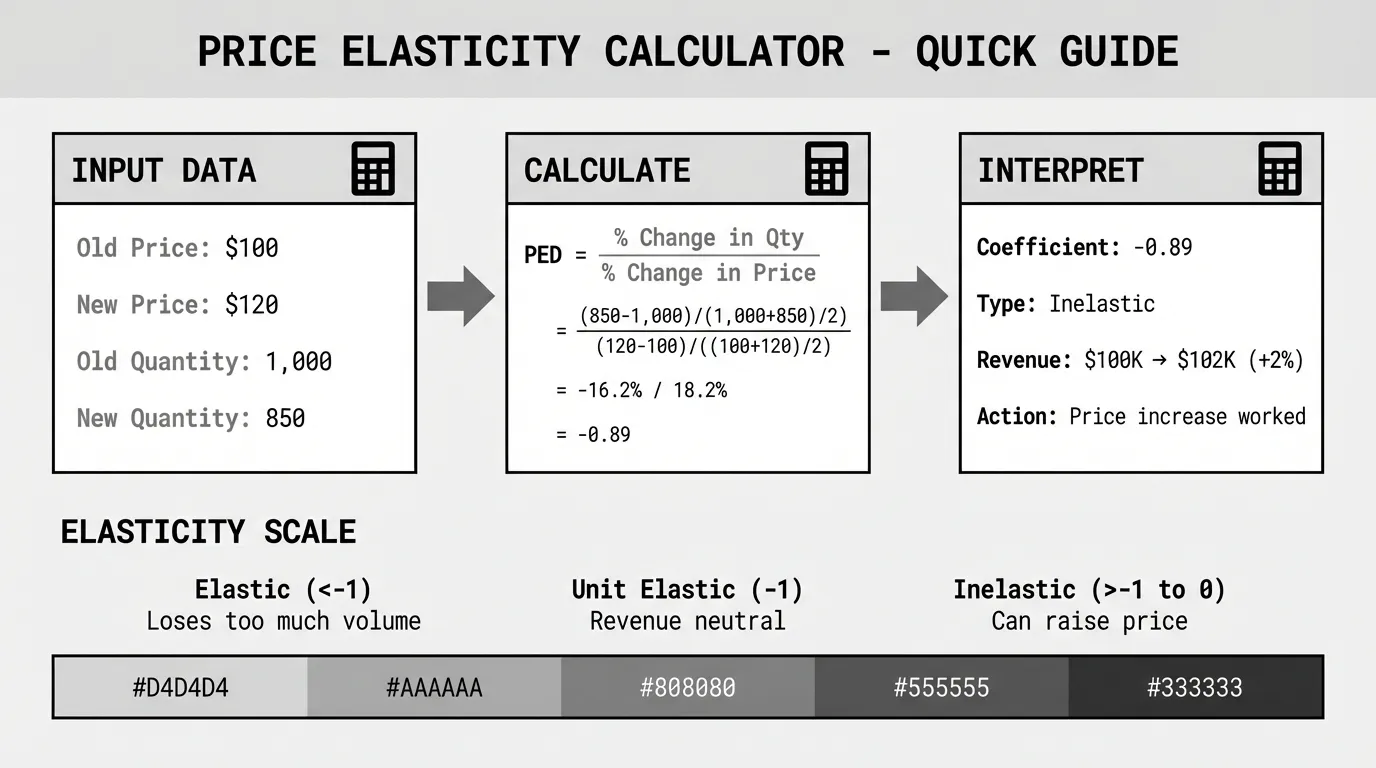
A price elasticity calculator measures how much quantity demanded changes when you change price. You input the old price, new price, old quantity, and new quantity, and the calculator outputs a coefficient showing whether demand is elastic or inelastic.
Most free online calculators use the midpoint method, which gives consistent results whether you're analyzing a price increase or decrease. The calculation takes 30 seconds. The interpretation is where the work is.
What a Price Elasticity Calculator Does
A price elasticity calculator applies this formula:
PED = ((Q₂ - Q₁) / ((Q₁ + Q₂) / 2)) / ((P₂ - P₁) / ((P₁ + P₂) / 2))
Where:
Q₁ = Original quantity demanded
Q₂ = New quantity demanded
P₁ = Original price
P₂ = New price
The calculator divides the percentage change in quantity by the percentage change in price. The result is the elasticity coefficient.
What the coefficient tells you:
- 0 to -1: Inelastic demand. Price increases don't lose much volume. Revenue goes up when you raise price.
- Exactly -1: Unit elastic. Price and quantity changes offset. Revenue stays constant.
- Less than -1 (e.g., -2.5): Elastic demand. Price increases lose too much volume. Revenue goes down when you raise price.
The calculator shows you the number. You decide what to do with it.
Best Free Price Elasticity Calculators
These calculators are free, require no signup, and use the midpoint formula.
Omni Calculator
Omni Calculator's price elasticity tool is clean and mobile-friendly. Enter initial and final prices and quantities. The calculator shows the elasticity coefficient, elasticity type (elastic/inelastic/unit elastic), and revenue impact.
What it does well: Shows percentage changes for price and quantity alongside the coefficient. Displays initial and final revenue so you can see if the price change helped or hurt total revenue.
Limitation: Only calculates elasticity for one price change at a time. If you have 50 products and want to analyze elasticity for all of them, you're entering data 50 times.
Good Calculators
Good Calculators' PED calculator uses the midpoint method. Simple four-field input. Shows the coefficient and interpretation.
What it does well: Fast and straightforward. No ads, no clutter. Just the calculator.
Limitation: Doesn't show revenue impact. You'll need to calculate that separately if you want to know whether a price change increased or decreased total revenue.
Inch Calculator
Inch Calculator's tool includes both the basic formula and midpoint method. You can toggle between them to see how results differ.
What it does well: Educational. Shows the calculation steps and explains the difference between methods. Good for learning.
Limitation: More fields to fill in if you just want a quick answer.
Calculator Online
Calculator Online's PED tool shows the coefficient, elasticity verdict, initial revenue, final revenue, and percentage revenue increase.
What it does well: Revenue analysis built in. You immediately see whether the price change was profitable.
Limitation: Interface is busy. Takes longer to find the relevant output.
How to Use a Price Elasticity Calculator
Step 1: Gather your data
You need four numbers:
- Original price
- New price (after a price increase, decrease, or test)
- Original quantity sold (units per month, quarter, or year)
- New quantity sold (same time period)
Example: An electrical distributor sells circuit breakers at $150 each. They sell 800 units per month. They raise the price to $165. Sales drop to 720 units per month.
Step 2: Enter the data
- Initial price: 150
- Final price: 165
- Initial quantity: 800
- Final quantity: 720
Step 3: Review the coefficient
The calculator returns: PED = -1.33
This product is elastic. A 1% price increase causes a 1.33% decrease in quantity demanded.
Step 4: Check revenue impact
- Original revenue: 800 × $150 = $120,000/month
- New revenue: 720 × $165 = $118,800/month
Revenue decreased by $1,200/month. The price increase lost more in volume than it gained in per-unit margin. That's what elastic demand looks like.
When to Use a Calculator vs Building Your Own
Use an online calculator when:
- You're testing a single price change or analyzing one product
- You have two data points (before and after)
- You need a quick answer
- You're explaining elasticity to someone who hasn't seen it before
Build your own (Excel or Google Sheets) when:
- You have dozens or hundreds of products to analyze
- You want to calculate elasticity across multiple time periods
- You need to segment by customer type, region, or product category
- You're presenting analysis to finance and want full control over formatting
Building a Price Elasticity Calculator in Excel
If you're analyzing elasticity for multiple products or customer segments, an Excel calculator saves time.
Setup:
Create these columns:
| Product | Old Price | New Price | Old Qty | New Qty | % ΔP | % ΔQ | PED | Elasticity Type |
|---|---|---|---|---|---|---|---|---|
| SKU-001 | 100 | 110 | 500 | 420 |
Formulas:
% Change in Price (midpoint method):
= (C2 - B2) / ((B2 + C2) / 2)
% Change in Quantity (midpoint method):
= (E2 - D2) / ((D2 + E2) / 2)
PED Coefficient:
= G2 / F2
Elasticity Type:
= IF(ABS(H2) < 1, "Inelastic", IF(ABS(H2) = 1, "Unit Elastic", "Elastic"))
Copy the formulas down. You now have elasticity coefficients for every product in your catalog.
Add conditional formatting: Highlight elastic products (coefficient < -1) in red and inelastic products (coefficient > -1 but < 0) in green. This makes it easy to see which products can handle price increases.
Interpreting Calculator Results for B2B Pricing
Most price elasticity calculators are built for consumer goods. Coffee, gas, movie tickets. B2B markets behave differently.
Problem 1: The coefficient is an average
A calculator gives you one number. But elasticity varies by customer segment. Large customers might have elasticity of -2.5 (very price sensitive). Small customers might have elasticity of -0.6 (less sensitive). The average is -1.5, but that's the wrong number to use for either segment.
Solution: Calculate elasticity by segment. Run the calculator separately for large customers, mid-size customers, and small customers. You'll get different coefficients and make better decisions.
Problem 2: B2B demand lags price changes
You raise price in January. Orders don't drop until March when customers finish their quarterly review. A calculator measuring January-February elasticity will show low sensitivity because demand hasn't adjusted yet.
Solution: Allow 60-90 days after a price change before measuring elasticity. B2B purchasing cycles are longer than consumer cycles. According to Zilliant's research on B2B price elasticity, transaction data can be used to segment customers into small groups that have similar price response and measure the price elasticity on an ongoing basis for each segment.
Problem 3: Elasticity reflects more than just price
You raise price by 8%. Volume drops 12%. The calculator says elasticity is -1.5. But maybe volume dropped because:
- A competitor launched a better product
- Your lead times increased
- The customer's production slowed
- The customer switched suppliers for reasons unrelated to price
The calculator can't separate price effects from other variables. You need judgment.
Solution: Look for patterns across multiple price changes, not single observations. If elasticity consistently shows -1.5 to -1.8 across different products and time periods, it's more reliable than one data point.
Common Calculator Mistakes
Mistake 1: Using list price instead of pocket price
Your list price is $100. You give the customer a 15% discount and absorb freight, so pocket price is $82. You raise list price to $110 but keep the same discounts. Pocket price moves to $90.50.
You didn't increase price by 10%. You increased it by 10.4% based on pocket price. The calculator needs pocket price, not list price. Otherwise, elasticity coefficients are wrong.
Mistake 2: Comparing different time periods
You measure elasticity using January-February data (winter, slow season). Then you apply that coefficient to a July price increase (summer, busy season). Elasticity changes with market conditions. Winter elasticity might be -2.0. Summer elasticity might be -0.8.
Use seasonal data when forecasting seasonal price changes.
Mistake 3: Trusting the coefficient without checking revenue
A calculator says PED = -0.9. Inelastic. You raise price by 5% expecting revenue to increase. But you didn't check the actual revenue impact. Original revenue was $50,000. New revenue is $49,200. Revenue went down even though demand was technically inelastic.
Always calculate revenue impact, not just the coefficient.
Mistake 4: Calculating elasticity with two similar prices
You test a price of $99 and $100. Quantity barely changes. The calculator shows PED = -0.2. Highly inelastic. You conclude customers don't care about price.
Wrong. The price change was too small to trigger a behavioral response. Test larger changes (5-10%) to measure meaningful elasticity.
What to Do With Your Calculator Results
Calculating elasticity is step one. Acting on it is where the value is.
If demand is inelastic (coefficient between 0 and -1):
You can raise prices without losing significant volume. Revenue will increase when you raise price.
Next step: Test a 3-5% price increase on a segment. Measure the response over 60-90 days. If volume loss is minimal, expand the price increase to other segments.
Example: A specialty fastener distributor calculated PED of -0.6 for titanium bolts. They raised price by 4%. Volume dropped 2.5%. Revenue increased 1.4%. They expanded the price increase to all titanium products and recovered $47,000/year in margin.
If demand is elastic (coefficient less than -1):
Price increases will cost you more volume than they're worth. Revenue will decrease if you raise price.
Next step: Don't chase margin with price. Defend volume. Look for cost reductions or product differentiation that justifies price.
Example: An HVAC distributor calculated PED of -1.8 for standard air filters. They raised price by 5%. Volume dropped 9%. Revenue decreased 4.2%. They reversed the increase and focused on faster delivery instead. Volume recovered within two months.
If demand is unit elastic (coefficient near -1):
Price changes don't affect total revenue much. A 10% price increase causes a 10% volume decrease. Revenue stays flat.
Next step: Focus on cost efficiency instead of price. Small price increases improve margin if your costs stay flat, but you won't grow revenue through pricing alone.
When Not to Trust the Calculator
Price elasticity calculators assume rational, consistent market behavior. B2B markets sometimes break those assumptions.
Contract pricing: If 60% of your volume is locked into annual contracts, elasticity calculations on spot pricing are misleading. The market can't respond to price changes until contracts renew.
Supply constraints: If you're sold out or on allocation, demand doesn't respond to price. You could raise price 15% and volume stays flat because you're capacity-limited anyway. The calculator will show low elasticity, but it's not measuring price sensitivity — it's measuring supply limits.
Bundled pricing: Customers buy products in bundles or hit minimum order quantities. You raise the price of Product A by 8%. Quantity doesn't change because customers need Product A to complete their $5,000 order. The calculator shows inelastic demand, but it's really just bundle mechanics.
According to B2B Frameworks, typical inelastic products are those used in industrial applications. If the price of nuts and bolts changes, customers cannot consume more because their need is determined by the volume output of whatever they're used in.
Calculators vs Pricing Software
Free online calculators work for analyzing individual products or simple scenarios. If you're managing thousands of SKUs, dozens of customer segments, or complex pricing structures, calculators won't scale.
What calculators can't do:
- Calculate elasticity for 10,000 SKUs automatically
- Segment customers by buying behavior and calculate elasticity per segment
- Isolate price effects from seasonality, competitor actions, and market trends
- Recommend optimal prices based on elasticity and margin targets
- Update elasticity coefficients continuously as new transaction data arrives
Pricing optimization software (like Zilliant, Vendavo, or PROS) uses regression models and machine learning to calculate segment-level elasticity from transaction data. According to Growth-onomics' 2025 review, Zilliant focuses on B2B markets with dynamic elasticity modeling and segmentation intelligence, and is best for manufacturing, distribution, and retail sectors.
The software costs $100K+/year. Most mid-market companies can't justify that for a pricing diagnostic.
The middle ground: Transaction data analysis. You don't need $100K software to measure elasticity patterns. You need transaction data (customer, product, price, quantity, date) and the formulas above. Export your ERP data to Excel, calculate elasticity by product category and customer segment, and identify which products can handle price increases.
For companies that aren't ready for enterprise pricing software, Pryse's margin diagnostic analyzes your transaction data to identify margin leakage and pricing opportunities — no manual elasticity calculations required.
Next Steps
Price elasticity calculators are useful for quick analysis. The best calculator is the one you'll actually use — whether that's a free online tool, an Excel template, or a dedicated pricing platform.
The hard part isn't the calculation. It's gathering reliable data, interpreting the results in the context of your market, and acting on what the coefficient tells you.
For more on how elasticity fits into your pricing strategy, see our complete Price Elasticity Guide. To understand the formulas these calculators use, see our posts on the Price Elasticity Formula and Price Elasticity of Demand Formula.
If you want to identify pricing opportunities across your product catalog without manually calculating elasticity for every SKU, Pryse analyzes your transaction data to find margin leakage and pricing inconsistencies — no elasticity calculations required.
Sources
- Price Elasticity of Demand Calculator - Omni Calculator
- Price Elasticity of Demand Calculator - Good Calculators
- Price Elasticity of Demand Calculator - Inch Calculator
- Price Elasticity of Demand Calculator - Calculator Online
- Price Elasticity in B2B: The Real Meaning of Optimization - Zilliant
- Price Elasticity - B2B Frameworks
- Top 7 Tools for Price Elasticity Analysis 2025 - Growth-onomics
Last updated: February 24, 2026
Frequently Asked Questions

Want to analyze your entire product catalog?
Pryse automatically identifies margin leakage across thousands of SKUs. Upload your data and find hidden profit in 24 hours.
One-time $1,499 diagnostic. No subscription required.