Cross Price Elasticity: How to Measure Demand Between Related Products
Learn how cross price elasticity measures demand relationships between substitute and complementary products. Includes formula, calculation examples, and B2B applications.
Cross price elasticity of demand measures how quantity demanded of one product changes when the price of another product changes. It's calculated as (% Change in Quantity of Product A) / (% Change in Price of Product B). A positive coefficient means the products are substitutes. A negative coefficient means they're complements.
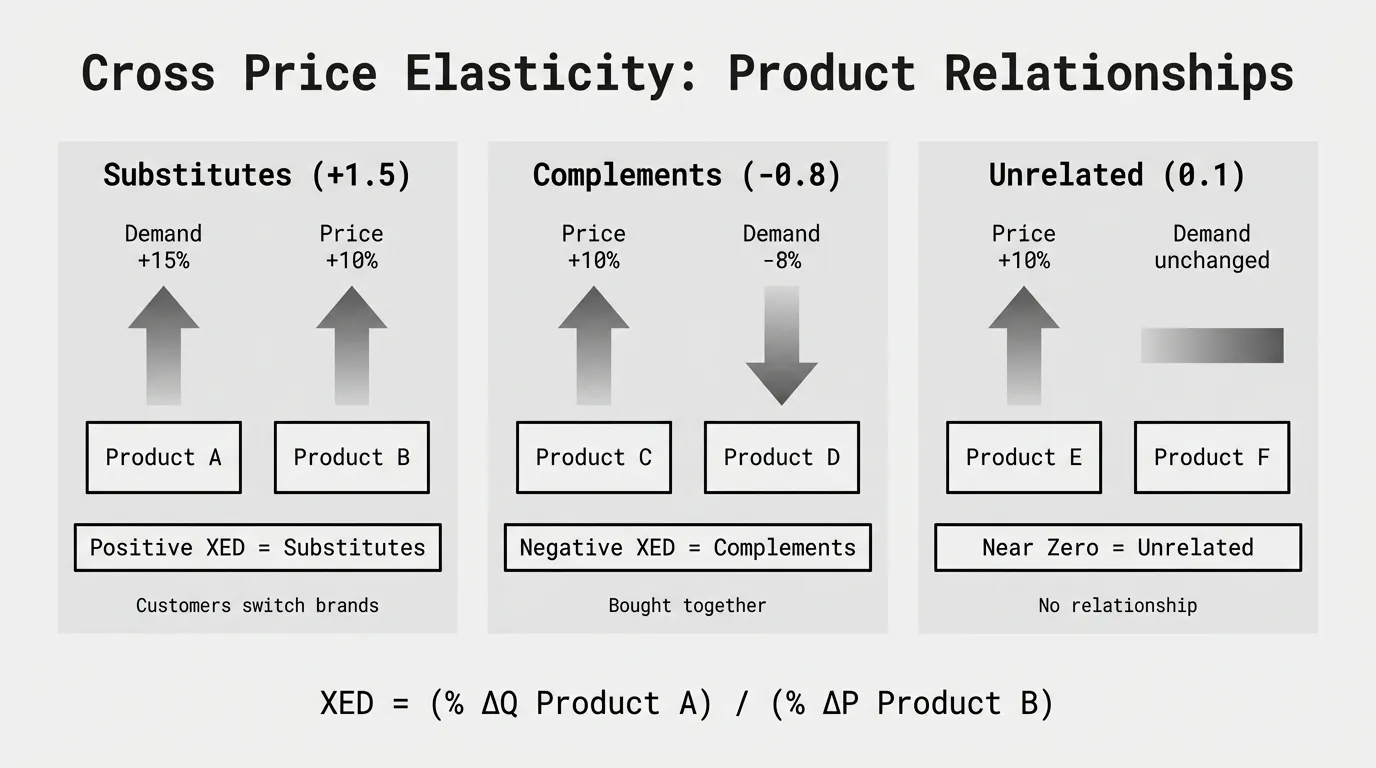
If an electrical distributor raises prices on Brand A breakers by 10% and sees demand for Brand B breakers increase by 15%, the cross price elasticity is +1.5. Customers are switching between brands. That's substitute behavior, and the positive coefficient confirms it.
Cross price elasticity reveals competitive dynamics and bundling opportunities that regular price elasticity can't show. It tells you which products compete for the same customers and which products are bought together.
The Cross Price Elasticity Formula
Cross price elasticity is calculated by dividing the percentage change in quantity demanded of one product by the percentage change in price of another product.
XED = (% Change in Quantity of Product A) / (% Change in Price of Product B)
Or with variables:
XED = ((QA₂ - QA₁) / QA₁) / ((PB₂ - PB₁) / PB₁)
Where:
QA₁ = Original quantity demanded of Product A
QA₂ = New quantity demanded of Product A
PB₁ = Original price of Product B
PB₂ = New price of Product B
Unlike regular price elasticity of demand, which is almost always negative, cross price elasticity can be positive, negative, or near zero. The sign tells you the relationship between products.
According to Sawtooth Software, cross-price elasticity measures the responsiveness of demand for one product when the price changes for a different product. This helps businesses understand how interrelated their products are within a market.
Worked Example: Substitute Products
A building materials distributor sells two brands of concrete mix: Brand X and Brand Y. Brand X sells 5,000 bags per month at $8 per bag. The distributor raises Brand Y's price from $7.50 to $9.00 per bag. After the price change, Brand X sales increase to 6,200 bags per month.
What's the cross price elasticity?
Step 1: Calculate percentage change in quantity for Brand X
(QA₂ - QA₁) / QA₁ = (6,200 - 5,000) / 5,000 = 1,200 / 5,000 = 0.24 = 24%
Step 2: Calculate percentage change in price for Brand Y
(PB₂ - PB₁) / PB₁ = (9.00 - 7.50) / 7.50 = 1.50 / 7.50 = 0.20 = 20%
Step 3: Divide quantity change by price change
XED = 24% / 20% = +1.20
The cross price elasticity is +1.20. The positive coefficient confirms these products are substitutes. When Brand Y became 20% more expensive, demand for Brand X increased by 24%. Customers switched brands.
Revenue impact: Brand X gained $9,600 in monthly revenue (1,200 additional bags × $8). The distributor might have lost that revenue on Brand Y. Cross price elasticity reveals the cannibalization or competitive relationship between products in your catalog.
Worked Example: Complementary Products
An HVAC distributor sells ductwork at $45 per section with demand of 800 sections per month. They also sell register vents that pair with the ductwork. They increase ductwork prices to $54 per section. Register vent demand drops from 3,200 vents per month to 2,720 vents.
What's the cross price elasticity?
Step 1: Calculate percentage change in quantity for register vents
(QA₂ - QA₁) / QA₁ = (2,720 - 3,200) / 3,200 = -480 / 3,200 = -0.15 = -15%
Step 2: Calculate percentage change in price for ductwork
(PB₂ - PB₁) / PB₁ = (54 - 45) / 45 = 9 / 45 = 0.20 = 20%
Step 3: Divide quantity change by price change
XED = -15% / 20% = -0.75
The cross price elasticity is -0.75. The negative coefficient indicates these products are complements. When ductwork prices increased 20%, register vent demand decreased 15%. Customers buy these products together. Raising the price on one reduces demand for both.
This tells the distributor that aggressive pricing on ductwork will hurt register vent sales. If margin on register vents is higher than ductwork, the price increase might reduce total profit even if ductwork revenue increases.
Interpreting the Coefficient: Substitutes, Complements, and Unrelated Products
The sign and magnitude of the coefficient tell you the relationship between products.
| Coefficient | Interpretation | What It Means |
|---|---|---|
| Positive (0.5 to 3.0+) | Substitutes | Products compete. Higher price on Product B drives demand to Product A. Stronger positive values mean more interchangeable. |
| Negative (-0.5 to -3.0) | Complements | Products are bought together. Higher price on Product B reduces demand for both. More negative values mean stronger bundling opportunity. |
| Near zero (-0.2 to +0.2) | Unrelated | Products are independent. Price changes in Product B don't affect demand for Product A. |
According to Corporate Finance Institute, the cross-price elasticity of demand for substitute goods is expected to be positive because when the price of one substitute good increases, the quantity demanded of the other substitute good increases.
Examples by category:
-
Commodity products from different suppliers: High positive coefficients (+1.5 to +3.0). Fasteners from Supplier A vs Supplier B. Customers switch based on small price differences.
-
Products in the same category with differentiation: Moderate positive coefficients (+0.5 to +1.5). Standard bearings vs precision bearings. Some substitution happens but products aren't perfect replacements.
-
System components bought together: Negative coefficients (-0.5 to -2.0). Pumps and motors, electrical panels and breakers. Price increases on one reduce demand for both.
-
Completely different categories: Coefficients near zero. HVAC supplies and office furniture. No relationship.
Using the Midpoint Method for Cross Price Elasticity
Just like regular price elasticity, cross price elasticity can use the midpoint method for more accurate analysis of historical data.
XED = ((QA₂ - QA₁) / ((QA₁ + QA₂) / 2)) / ((PB₂ - PB₁) / ((PB₁ + PB₂) / 2))
Simplified:
XED = ((QA₂ - QA₁) / (QA₁ + QA₂)) / ((PB₂ - PB₁) / (PB₁ + PB₂))
The midpoint method produces the same coefficient whether price increases or decreases, making it more reliable for analysis. Use it when comparing cross elasticity across multiple product pairs or presenting findings to executives.
Cross Price Elasticity in B2B Markets
Most cross price elasticity examples come from consumer goods. Coca-Cola and Pepsi. Butter and margarine. According to MasterClass, the cross elasticity of demand of butter with respect to margarine is 0.81, so a 1% increase in the price of margarine will increase the demand for butter by 0.81%.
B2B markets behave differently.
1. Substitution happens slowly. In consumer markets, you see Pepsi's price increase and grab Coca-Cola instead. In B2B, customers have approved vendor lists, contracts, and qualification processes. An electrical contractor doesn't switch breaker brands because of a 5% price difference. They switch when contracts renew or when the price gap becomes large enough to justify requalification.
2. Technical specifications limit substitution. Products that look similar often aren't interchangeable. A bearing with a 25mm bore can't substitute for a 30mm bore. A UL-listed breaker can't substitute for a non-listed one. Cross price elasticity only matters for products that meet the same technical requirements.
3. Switching costs vary by customer. Large manufacturers with integrated systems have high switching costs. Changing suppliers requires testing, recertification, inventory adjustments, and training. Small contractors have low switching costs. They can switch suppliers between jobs. The same two products might have high cross elasticity for small customers and near-zero cross elasticity for large customers.
4. Relationships override price. According to B2B Frameworks, B2B customers buy out of necessity, not impulse. A company won't buy more nuts and bolts simply because they're cheaper, but they may consider changing their supplier if an alternative supplier has products at a lower price. Service quality, delivery reliability, and payment terms matter as much as price.
5. Bundling distorts elasticity. If customers buy products in bundles or must hit minimum order quantities, individual product elasticity is distorted. A price increase on Product A might not reduce demand for Product A if customers need to hit a $5,000 minimum order that includes products A, B, and C anyway.
Practical Applications in Distribution and Manufacturing
1. Competitive pricing strategy. If you know that your Brand X bearings have a cross elasticity of +1.8 with Brand Y bearings, you can predict how much volume you'll gain or lose when competitors change price. A competitor's 10% price increase should shift 18% more volume to you. If that doesn't happen, you have a service, delivery, or relationship problem.
2. SKU rationalization. Products with high positive cross elasticity are direct substitutes. You might be carrying two brands of the same item that cannibalize each other. According to Wall Street Mojo, cross price elasticity of demand helps to classify goods and understand product substitutes. Dropping the lower-margin brand could improve overall profitability without losing revenue.
3. Bundling and kitting strategies. Products with negative cross elasticity are bought together. Offer discounts on bundles to capture both sales. An HVAC distributor with ductwork (product A) and register vents (product B) with cross elasticity of -0.75 should bundle them. Offering a 5% discount on the bundle might increase total revenue because it prevents the price-driven demand drop on the complement.
4. Category management. Group products by cross elasticity relationships. Products with high positive cross elasticity compete within a category. Products with negative cross elasticity belong in different categories but should be cross-merchandised. Zero cross elasticity products are independent and should be priced independently.
5. Pricing impact analysis. Before raising prices, check cross elasticity with other products in your catalog. A price increase on a high-volume item with negative cross elasticity to other products might reduce total revenue even if that item's revenue increases. The complementary products lose demand, and you lose margin on both.
When Cross Price Elasticity Misleads You
Cross price elasticity measures correlation, not causation. Just because two products show correlated demand patterns doesn't mean price drives the relationship.
Seasonal effects. Demand for landscaping supplies increases together in spring. That's not complementary behavior. It's seasonal. Cross elasticity analysis will show negative relationships between products that aren't actually bought together.
Industry cycles. When manufacturing output increases, demand for industrial supplies, MRO items, and capital equipment all increase. Cross elasticity analysis might show negative coefficients suggesting they're complements, when really they're all responding to the same external driver.
Common customers. If 80% of your revenue comes from five large customers, product demand patterns reflect those customers' purchasing behavior, not true product relationships. Cross elasticity calculations will show artificial relationships driven by customer mix, not product attributes.
Supply constraints. If Product A is on allocation and Product B becomes more expensive, customers might buy more Product A simply because it's available, not because they're substitutes. Cross elasticity analysis will show a positive coefficient that disappears once supply normalizes.
Calculating Cross Price Elasticity with Transaction Data
Most mid-market companies can calculate cross price elasticity in Excel if they have transaction data.
What you need:
- Sales history with at least 12 months of data for both products
- Columns for: Date, Product, Quantity Sold, Price per Unit
- Price variation on at least one product (if neither product's price changes, you can't measure cross elasticity)
Steps:
- Identify product pairs you want to analyze (suspected substitutes or complements)
- Group data by month or quarter for both products
- Calculate average price and total quantity for each period
- Apply the cross elasticity formula between consecutive periods
- Average the coefficients across multiple periods to get a reliable estimate
For more sophisticated analysis, pricing software like Vendavo and Zilliant use regression models to isolate price effects from other variables like seasonality and customer mix. But you don't need enterprise software to start measuring cross elasticity. You just need transaction data and the formula above.
For companies that want to understand pricing relationships across thousands of SKUs without calculating elasticity for every product pair, a margin diagnostic can reveal patterns. Pryse's margin analysis identifies pricing inconsistencies and margin leakage across your catalog, showing which products are priced out of line with their competitive position.
What to Do With Your Cross Price Elasticity Coefficients
Calculating cross elasticity is useful. Acting on it is where the value is.
If products have high positive cross elasticity (+1.5 or higher):
- They're direct substitutes and compete for the same demand
- Consider consolidating to a single product if margin and quality are similar
- Monitor competitor pricing closely — small price differences drive large volume shifts
- Avoid stocking both if they cannibalize each other
If products have moderate positive cross elasticity (+0.5 to +1.5):
- They're partial substitutes with some differentiation
- Position them with different value propositions (economy vs premium, standard vs specialty)
- Price them appropriately for their differentiation level
- Keep both in inventory if they serve different customer segments
If products have negative cross elasticity (-0.5 to -2.0):
- They're complements bought together
- Bundle them or offer quantity discounts when purchased together
- Price the bundle to capture more total margin than separate sales
- Cross-merchandise them in inventory and sales presentations
If products have cross elasticity near zero:
- They're unrelated and should be priced independently
- Don't bundle them or try to create package deals
- Focus on each product's own price elasticity, not cross relationships
Common Mistakes When Using Cross Price Elasticity
Mistake 1: Assuming correlation means causation. Two products might show correlated demand changes because they share the same customer base, seasonal patterns, or industry cycles. That doesn't mean they're substitutes or complements. Check whether the relationship makes logical sense before acting on it.
Mistake 2: Using list price instead of pocket price. If your pocket price (after discounts and rebates) differs significantly from list price, measure cross elasticity based on pocket price. A 10% list price increase that only translates to a 3% pocket price increase won't produce the expected demand shift.
Mistake 3: Ignoring time lags. In B2B markets, customers don't switch suppliers immediately when prices change. Contract cycles, approval processes, and inventory buffers create delays. You might need 3-6 months of data after a price change to see the full cross elasticity effect.
Mistake 4: Averaging across customer segments. Large national accounts and small local customers have different substitution patterns. A product pair might have high cross elasticity for price-sensitive small customers and near-zero cross elasticity for large customers with qualified supplier lists. Segment your analysis.
Mistake 5: Treating elasticity as constant. Cross price elasticity changes over time. During supply shortages, customers accept higher prices and substitution decreases. During economic downturns, customers become more price sensitive and substitution increases. Update your coefficients regularly.
Cross Price Elasticity vs Price Elasticity: When to Use Each
Price elasticity measures how a product's demand responds to its own price changes. Use it when:
- Deciding whether to raise or lower prices on a specific product
- Forecasting revenue impact of a price change
- Identifying which products are price sensitive vs price insensitive
Cross price elasticity measures how one product's demand responds to another product's price changes. Use it when:
- Understanding competitive dynamics between similar products
- Identifying bundling opportunities for products bought together
- Making SKU rationalization decisions
- Predicting volume shifts from competitor price changes
You need both. Price elasticity tells you how to price a product. Cross price elasticity tells you how pricing one product affects sales of other products in your catalog.
Next Steps
Cross price elasticity reveals competitive and complementary relationships that regular price elasticity can't show. It's particularly valuable for distributors managing large catalogs with multiple brands and product categories.
For more on using elasticity in your overall pricing strategy, see our complete Price Elasticity Guide. To understand the basic price elasticity formula, start with Price Elasticity Formula.
If you want to identify pricing patterns and margin opportunities across thousands of SKUs without calculating elasticity for every product, start with a transaction analysis. Pryse analyzes your pricing data to identify margin leakage and pricing inconsistencies — no elasticity calculations required.
Sources
- Understanding Cross Price Elasticity of Demand - Sawtooth Software
- Cross-Price Elasticity of Demand: Definition and Formula - MasterClass
- Cross Price Elasticity of Demand - Wall Street Mojo
- Cross-Price Elasticity - Corporate Finance Institute
- Price Elasticity - B2B Frameworks
- Cross elasticity of demand - Wikipedia
Last updated: February 24, 2026
Frequently Asked Questions

Want to analyze your entire product catalog?
Pryse automatically identifies margin leakage across thousands of SKUs. Upload your data and find hidden profit in 24 hours.
One-time $1,499 diagnostic. No subscription required.