5 Types of Price Elasticity of Demand (Elastic vs Inelastic Explained)
Learn the 5 types of price elasticity: perfectly elastic, elastic, unitary, inelastic, and perfectly inelastic. Includes examples, coefficients, and what each means for pricing.
Price elasticity of demand has five distinct types based on how quantity demanded responds to price changes. Perfectly elastic demand means any price increase causes quantity to drop to zero. Perfectly inelastic demand means quantity doesn't change regardless of price. Between these extremes are elastic demand (quantity changes more than price), inelastic demand (quantity changes less than price), and unitary elastic demand (quantity changes by exactly the same percentage as price).
The elasticity coefficient tells you which type you're dealing with. Calculate it by dividing the percentage change in quantity by the percentage change in price. The result determines your pricing strategy: elastic products lose revenue when price increases, inelastic products gain revenue, and unitary elastic products see no revenue change.
The 5 Types of Price Elasticity of Demand
Each type represents a different relationship between price changes and quantity demanded. The elasticity coefficient ranges from 0 (perfectly inelastic) to infinity (perfectly elastic).
| Type | Coefficient | What It Means | Revenue Effect |
|---|---|---|---|
| Perfectly Elastic | ∞ (infinity) | Any price increase → quantity drops to 0 | Can't raise price |
| Elastic | > 1 | Quantity changes more than price | Revenue falls when price rises |
| Unitary Elastic | = 1 | Quantity changes same as price | Revenue stays constant |
| Inelastic | < 1 | Quantity changes less than price | Revenue rises when price rises |
| Perfectly Inelastic | = 0 | Quantity doesn't change | Revenue rises proportionally with price |
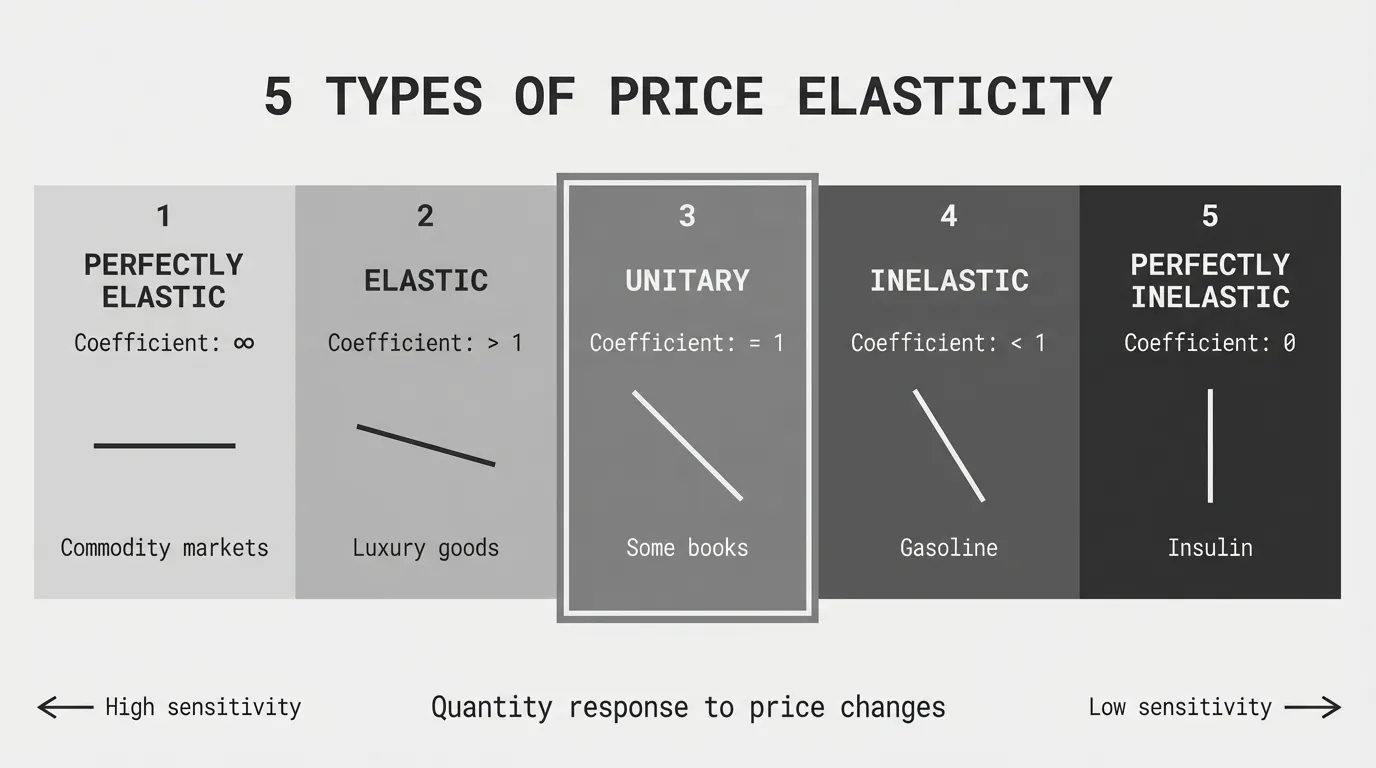
The types form a spectrum. Most real-world products fall somewhere between perfectly elastic and perfectly inelastic, with elastic, unitary, and inelastic demand being the most common categories.
1. Perfectly Elastic Demand (Coefficient = ∞)
Perfectly elastic demand is the extreme case where any price increase causes quantity demanded to fall to zero. Customers have infinite alternatives at the current price, so they won't pay even slightly more.
According to Lumen Learning's macroeconomics course, perfectly elastic demand refers to the extreme case in which the quantity demanded increases by an infinite amount in response to any decrease in price at all.
Mathematical representation: The demand curve is horizontal. At price P, any quantity can be sold. At price P + 0.01, quantity demanded drops to zero.
Examples of Perfectly Elastic Demand
Foreign currency exchange markets: If one currency dealer charges even slightly more than the market rate, buyers will go to competitors offering the exact market rate. Products are identical and switching costs are zero.
Commodity trading (wheat, corn, oil): Individual farmers are price takers. If one farmer tries to sell wheat for $0.01/bushel above market price, buyers purchase from the thousands of other farmers selling at market price.
According to Carbon Collective's perfectly elastic demand guide, foreign currency exchange is an example where buyers can choose from many sellers offering identical products, so if one firm increased the price above market equilibrium, no one would buy from that firm.
Agricultural products in competitive markets: Most farmers operate in perfectly competitive markets where they have no impact on product price. They must accept the prevailing market price or sell nothing.
When Perfectly Elastic Demand Occurs
This is theoretical in most markets but approximates reality in:
- Perfectly competitive markets with identical products
- Markets with zero switching costs
- Situations where buyers have perfect information
- Commodity markets with many sellers
Pricing implications: You have zero pricing power. You're a price taker, not a price maker. Any attempt to charge above market price results in zero sales.
2. Elastic Demand (Coefficient > 1)
Elastic demand means quantity demanded changes by a larger percentage than price. If price increases 10%, quantity might drop 15%. The elasticity coefficient is greater than 1.
According to GeeksforGeeks' price elasticity guide, demand for a good is elastic when the elasticity is greater than one. Relatively elastic demand refers to demand when the proportionate change produced in demand is greater than the proportionate change in price.
Revenue effect: When demand is elastic, raising price decreases total revenue. The volume loss is larger than the price gain.
Example calculation: A product sells 1,000 units at $50. Price increases to $55 (10% increase). Quantity drops to 800 units (20% decrease).
Elasticity = (-20%) / (10%) = -2.0
Original revenue: 1,000 × $50 = $50,000 New revenue: 800 × $55 = $44,000
Revenue fell by $6,000 because demand was elastic.
Examples of Elastic Demand
Luxury goods: Designer handbags, high-end watches, premium cars have elasticity above 1. Customers can postpone or skip purchases when prices rise.
Restaurant dining: Full-service restaurants show elastic demand. Customers can cook at home, choose cheaper restaurants, or eat out less frequently when prices increase.
Streaming subscriptions: Netflix, Spotify, Disney+ face elastic demand. With abundant competition and low switching costs, price increases drive cancellations.
Commodity MRO supplies: Standard industrial supplies like PVC pipe, fasteners, and electrical components are elastic in B2B markets. Customers know market prices and shop around.
For more examples with data, see our post on Price Elasticity Examples.
Why Demand Is Elastic
Demand tends to be elastic when:
- Many close substitutes exist
- The product is not essential
- Purchases can be postponed
- Switching costs are low
- The product represents a large share of budget
- Customers have perfect information about alternatives
Pricing implications: Don't chase margin through price increases. Focus on cost reduction, differentiation, and service to compete without raising price.
3. Unitary Elastic Demand (Coefficient = 1)
Unitary elastic demand means quantity demanded changes by exactly the same percentage as price. If price increases 10%, quantity drops exactly 10%. The elasticity coefficient equals 1.
According to Lumen Learning's macroeconomics course, when demand is unit elastic, the elasticity coefficient is equal to 1, and the demand curve has a constant slope. The percent change in quantity demanded is equal to the percent change in price.
Revenue effect: Total revenue stays constant regardless of price changes. The percentage increase in price exactly offsets the percentage decrease in quantity.
Example calculation: A bookstore sells 500 books at $20. Price increases to $22 (10% increase). Quantity drops to 450 books (10% decrease).
Elasticity = (-10%) / (10%) = -1.0
Original revenue: 500 × $20 = $10,000 New revenue: 450 × $22 = $9,900
Revenue stayed essentially constant (minor difference due to rounding).
Examples of Unitary Elastic Demand
Books: According to Learn Business Concepts, a bookstore notices that for every 10% increase in the price of a particular book, there is a 10% decrease in the quantity of the book sold. This indicates unit elasticity.
Digital cameras: When the price of digital cameras increases by 10% and quantity demanded decreases by 10%, demand is unitary elastic.
Some utilities: In certain regulated markets, utilities approximate unit elasticity where regulatory frameworks keep prices stable and consumer responses to price changes are proportional.
Why Unitary Elasticity Matters
Unitary elasticity is the exact breakpoint between elastic and inelastic demand. It represents the price point where:
- Revenue is maximized
- Further price increases start losing revenue (demand becomes elastic)
- Price decreases don't increase revenue (demand stays unitary or becomes inelastic)
Pricing implications: You're at a revenue-neutral point. Raising price won't increase revenue. Lowering price won't increase revenue either. Focus on cost reduction to improve margins at current pricing.
4. Inelastic Demand (Coefficient < 1)
Inelastic demand means quantity demanded changes by a smaller percentage than price. If price increases 10%, quantity might drop only 3%. The elasticity coefficient is less than 1 but greater than 0.
According to Economics Discussion, if demand is inelastic, the good's demand is relatively insensitive to price, with quantity changing less than price.
Revenue effect: When demand is inelastic, raising price increases total revenue. The volume loss is smaller than the price gain.
Example calculation: A product sells 800 units at $100. Price increases to $110 (10% increase). Quantity drops to 760 units (5% decrease).
Elasticity = (-5%) / (10%) = -0.5
Original revenue: 800 × $100 = $80,000 New revenue: 760 × $110 = $83,600
Revenue increased by $3,600 because demand was inelastic.
Examples of Inelastic Demand
Gasoline (short-term): Price elasticity of gasoline is -0.2 to -0.4 in the short run. When gas prices rise, people still need to drive so quantity doesn't fall much.
Utilities: Electricity and water show inelastic demand. You can't easily cut usage by 20% when the rate increases 10%.
Eggs and staple foods: Research from Purdue University found that even when egg prices surged 60%, sales remained steady. Elasticity around -0.2 to -0.4.
Specialty industrial products: Mission-critical B2B components with high switching costs show inelastic demand. Elasticity of -0.2 to -0.5.
For more on why these products are inelastic, see our Price Elasticity Examples post.
Why Demand Is Inelastic
Demand tends to be inelastic when:
- Few close substitutes exist
- The product is essential
- Purchases can't be postponed
- Switching costs are high
- The product represents a small share of budget
- Short time horizon (before customers adjust)
Pricing implications: Test price increases. Start with 3-5% and measure response. If demand is inelastic, you can expand margins through pricing. Pass through cost increases promptly.
5. Perfectly Inelastic Demand (Coefficient = 0)
Perfectly inelastic demand means quantity demanded doesn't change when price changes. The elasticity coefficient is 0. Customers buy the same quantity regardless of price.
According to Economics Basics, a perfectly inelastic demand curve refers to a situation when a change in price causes no change in the quantity demanded.
Mathematical representation: The demand curve is vertical. At any price, quantity demanded stays constant.
Examples of Perfectly Inelastic Demand
Life-saving prescription drugs: According to Lumen Learning, a person with kidney failure who needs insulin to stay alive has a specific prescribed quantity. If the price increases, the patient will continue to purchase the same quantity needed to stay alive.
Insulin for Type 1 diabetics: A patient needs 20 units per day based on medical necessity. If price is $50/vial or $300/vial, they still need to buy it. Quantity is determined by the prescription, not price.
Specific rare medications: When no substitutes exist and the medication is medically necessary, demand is perfectly inelastic.
When Perfectly Inelastic Demand Occurs
This is rare in real markets but approximates reality for:
- Life-saving medications with no substitutes
- Court-ordered goods or services
- Monopoly products required by regulation
- Fixed contractual obligations
Pricing implications: In theory, you could charge any price and maintain volume. In practice, regulations, ethics, and long-term reputation constrain pricing for perfectly inelastic goods (especially in healthcare).
How to Determine Which Type Applies to Your Product
Calculate the price elasticity coefficient from your transaction data, then classify based on the result.
Step 1: Calculate percentage change in quantity
% Change in Quantity = ((New Quantity - Old Quantity) / Old Quantity) × 100
Step 2: Calculate percentage change in price
% Change in Price = ((New Price - Old Price) / Old Price) × 100
Step 3: Calculate elasticity coefficient
Elasticity = (% Change in Quantity) / (% Change in Price)
Step 4: Classify based on coefficient
- If coefficient ≈ ∞ → Perfectly elastic
- If coefficient > 1 → Elastic
- If coefficient = 1 → Unitary elastic
- If 0 < coefficient < 1 → Inelastic
- If coefficient = 0 → Perfectly inelastic
Example from B2B distribution:
A distributor sells specialty adhesive. Last month: 200 gallons at $120/gallon. This month: price increased to $135/gallon, sales dropped to 185 gallons.
% Change in Quantity = ((185 - 200) / 200) × 100 = -7.5%
% Change in Price = ((135 - 120) / 120) × 100 = 12.5%
Elasticity = -7.5% / 12.5% = -0.6
Coefficient is 0.6 (ignoring the negative sign), which is less than 1. This product has inelastic demand. The price increase was profitable—revenue went from $24,000 to $24,975.
For a step-by-step calculation guide, see our post on the Price Elasticity Formula.
Elasticity Types Across the Demand Curve
A single product can have different elasticity types at different price points. The demand curve for most products isn't linear—elasticity changes as you move along it.
Pattern: Demand tends to be more elastic at high prices and more inelastic at low prices.
Example: Premium coffee might have:
- Elastic demand at $8/cup (customers switch to competitors)
- Unitary elastic demand at $5/cup (revenue-maximizing point)
- Inelastic demand at $3/cup (customers don't buy much more even if you discount)
This is why the midpoint formula is often used—it calculates an average elasticity between two price points rather than assuming constant elasticity across the entire demand curve.
How Elasticity Type Changes Over Time
The type of elasticity isn't static. Market changes shift products between categories.
Short-Term vs Long-Term Elasticity
Gasoline demonstrates this clearly:
- Short-term (weeks/months): Inelastic demand (coefficient -0.2 to -0.4). People can't quickly change driving habits.
- Long-term (years): More elastic demand (coefficient -0.8). People buy fuel-efficient cars, move closer to work, or switch to electric vehicles.
Time allows customers to find alternatives, making demand more elastic.
When Substitutes Emerge
A product with inelastic demand can become elastic when competitors enter:
- Before 2020, Zoom had relatively inelastic demand for enterprise video. After Microsoft Teams, Google Meet, and others matured, demand became more elastic.
- Insulin historically had perfectly inelastic demand. As biosimilar insulins emerge, demand becomes slightly more elastic (still highly inelastic, but not perfectly).
When Switching Costs Increase
A product with elastic demand can become inelastic when integration deepens:
- SaaS tools start with elastic demand. After 2 years of integration, customization, and data accumulation, switching costs make demand inelastic.
- Commodity industrial supplies are elastic. When a supplier becomes ISO-certified or spec'd into production processes, demand becomes inelastic.
Using Elasticity Types for Pricing Strategy
Each elasticity type requires a different pricing approach.
For Elastic Demand (Coefficient > 1)
Don't raise prices to chase margin. You'll lose revenue.
Strategy:
- Compete on service, speed, convenience, and expertise
- Use volume discounts strategically
- Watch competitor pricing closely
- Focus on cost reduction to improve margins without raising price
- Differentiate to reduce price sensitivity
Example: A distributor selling commodity MRO supplies (elastic demand) can't raise prices without losing volume. They compete by stocking more SKUs, offering same-day delivery, and providing technical support that competitors don't.
For Inelastic Demand (Coefficient < 1)
Test price increases. You have pricing power.
Strategy:
- Implement 3-5% annual price increases
- Pass through cost increases promptly
- Segment customers and charge more where you have pricing power
- Invest in differentiation that increases switching costs
- Protect inelastic segments from commodity pressure
Example: A manufacturer selling mission-critical OEM components (inelastic demand) raises prices 5% annually. Customers accept it because switching requires re-engineering, testing, and regulatory approval.
For Unitary Elastic Demand (Coefficient = 1)
Pricing changes don't affect revenue. Focus elsewhere.
Strategy:
- Maintain current pricing
- Focus on cost reduction to improve margins
- Look for ways to make demand more inelastic (increase switching costs, add features, deepen integration)
- Consider non-price strategies: payment terms, bundling, service tiers
Example: A product at the unitary elastic point won't gain revenue from price changes. The company focuses on reducing COGS by 8% to improve margins at current price levels.
Common Mistakes When Classifying Elasticity Types
Mistake 1: Confusing elasticity coefficient with percentage change
The elasticity coefficient is the ratio of percentage changes, not the percentage change itself.
Wrong: "Quantity dropped 15%, so elasticity is -15%." Right: "Quantity dropped 15% when price rose 10%, so elasticity is -1.5 (elastic demand)."
Mistake 2: Treating elasticity as constant across all price levels
Most products have different elasticity at different prices. Demand might be elastic at high prices but inelastic at low prices.
Calculate elasticity at your current price point, not from outdated data or different price ranges.
Mistake 3: Ignoring the time horizon
Short-term elasticity is almost always lower (more inelastic) than long-term elasticity. If you measure response after 1 week, you'll underestimate true elasticity.
Allow enough time for customers to adjust behavior—typically 3-6 months in B2B, 1-3 months in consumer goods.
Mistake 4: Assuming your product is like the textbook examples
Gasoline is inelastic in general, but that doesn't mean your fuel business has inelastic demand. Local competition and customer segments create variation.
Measure your own elasticity. Don't assume it matches industry averages or textbook examples.
Mistake 5: Confusing elasticity type with willingness to pay
A customer's willingness to pay is different from elasticity type.
Inelastic demand: Customers need the product and can't easily switch. They'll pay more, but there's still a limit.
High willingness to pay: Customers value the product highly. This can exist with elastic or inelastic demand.
A luxury watch has elastic demand (many alternatives) but high willingness to pay. Gasoline has inelastic demand (few alternatives) but customers don't value it highly—they just need it.
Elasticity Types in B2B vs Consumer Markets
Elasticity types manifest differently in B2B and consumer contexts.
B2B Elasticity Patterns
Highly inelastic segments:
- OEM components integrated into production
- Mission-critical parts with vendor certifications
- Products with engineering specifications
- Long-term contract pricing
Highly elastic segments:
- Commodity MRO supplies
- Transactional spot purchases
- Products without technical specifications
- Market-priced materials
Example: An electrical distributor sells both custom control panels (inelastic, coefficient -0.3) and standard wire and cable (elastic, coefficient -1.8). They price each segment differently based on elasticity type.
Consumer Elasticity Patterns
Highly inelastic segments:
- Life-saving medications
- Utilities (electricity, water, gas)
- Staple foods
- Gasoline (short-term)
Highly elastic segments:
- Luxury goods
- Restaurant dining
- Entertainment subscriptions
- Consumer electronics
For detailed consumer examples, see our post on Price Elasticity Examples.
Next Steps
The five types of price elasticity—perfectly elastic, elastic, unitary elastic, inelastic, and perfectly inelastic—form a spectrum from infinite price sensitivity to zero price sensitivity. Most real-world products fall in the middle three categories.
Knowing which type applies to your product tells you whether you can raise prices (inelastic), must compete on value (elastic), or should focus on cost reduction (unitary).
Calculate your elasticity coefficient from transaction data, classify the result, and adjust your pricing strategy accordingly. For calculation methods, see our guides on the Price Elasticity Formula and Price Elasticity Calculator.
To understand how elasticity looks visually, see our post on the Price Elasticity of Demand Curve. For other elasticity concepts, read about Cross-Price Elasticity and Income Elasticity of Demand.
If you want to identify pricing opportunities across thousands of SKUs without manually calculating elasticity for each one, Pryse's margin diagnostic analyzes your transaction data to find products where you have pricing power and can safely raise prices.
Sources
- Reading: Polar Cases of Elasticity - Lumen Learning
- Price Elasticity of Demand: Meaning, Types, Calculation - GeeksforGeeks
- 5 Types of Price Elasticity of Demand – Explained! - Economics Discussion
- Categories of Elasticity - Lumen Learning
- What is Perfectly Elastic Demand? - Carbon Collective
- Perfectly Inelastic Demand - Economics Basics
- Unitary Elastic Demand - Learn Business Concepts
Last updated: February 24, 2026
Frequently Asked Questions

Want to analyze your entire product catalog?
Pryse automatically identifies margin leakage across thousands of SKUs. Upload your data and find hidden profit in 24 hours.
One-time $1,499 diagnostic. No subscription required.