Food Distributor Margins: Benchmarks, Challenges, and How to Improve
Typical gross, operating, and net margins for food distributors. Public company benchmarks from Sysco, US Foods, and PFG, plus where mid-market distributors leak margin.
Food distribution is the thinnest-margin sector in wholesale distribution. Gross margins run 15-20%. Net margins sit at 1-3%. A single bad week of spoilage or a pricing error on a large account can wipe out a month's profit.
That's the reality, and it's not changing. But there's a meaningful gap between average and well-run food distributors. Understanding where your margins should be -- and where they're leaking -- is the first step.
This guide covers actual margin benchmarks from public company filings, explains why food distribution margins are structurally lower than other verticals, and identifies the specific areas where mid-market food distributors lose money they shouldn't.
Food Distributor Margin Benchmarks
Food distribution margins are well-documented because the three largest U.S. players are publicly traded. Their 10-K filings give us hard numbers.
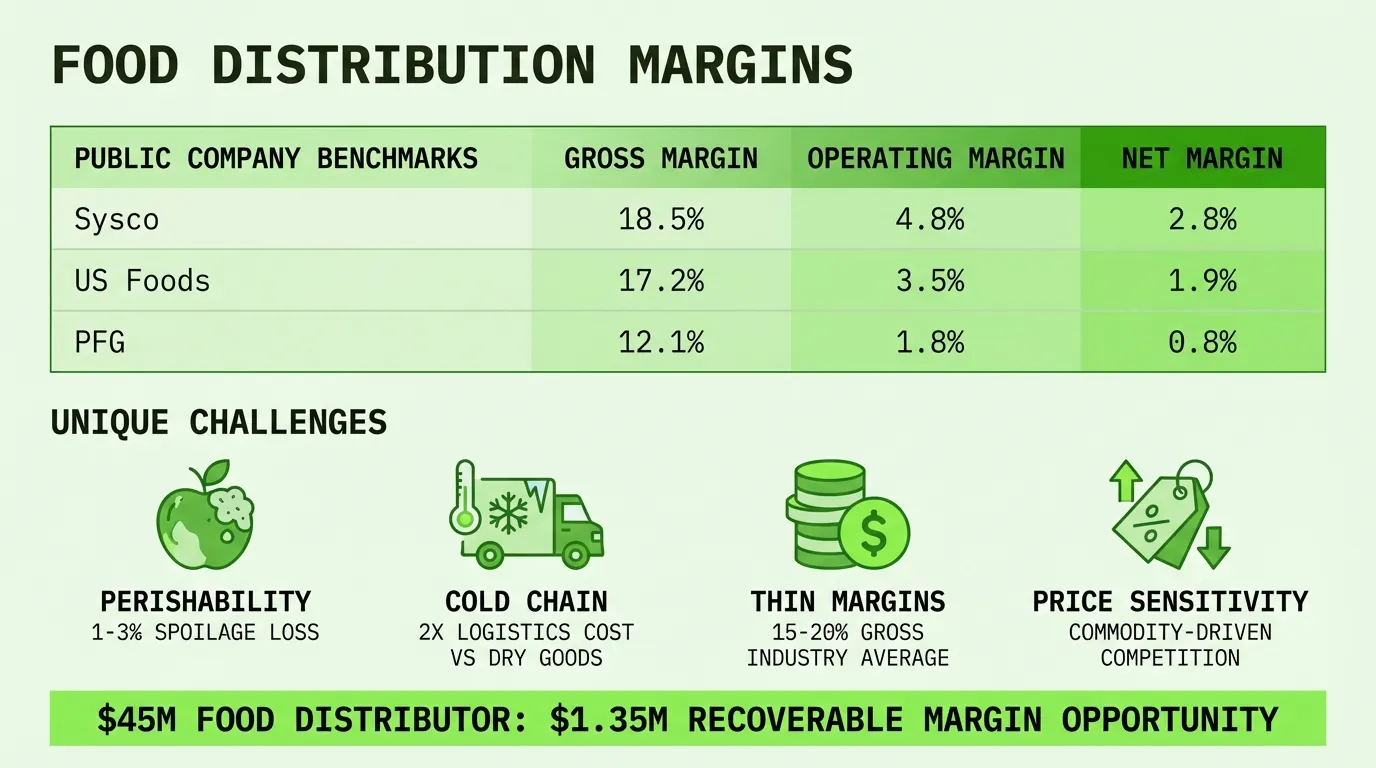
Public Company Benchmarks (Fiscal Year 2025)
| Company | Revenue | Gross Margin | Operating Margin | Net Margin |
|---|---|---|---|---|
| Sysco (SYY) | $81.4B | 18.9% | 3.8% | 2.2% |
| US Foods (USFD) | $39.4B | 17.4% | ~2.1% | 1.9% |
| Performance Food Group (PFGC) | $63.3B | 11.7% | 1.3% | 0.5% |
Sources: Sysco FY2025 Earnings Release (July 2025), US Foods FY2025 Earnings Release (February 2026), PFG FY2025 Earnings Release (August 2025). All figures from public SEC filings.
A few things stand out.
Sysco leads on margin at every level. Their scale, supplier leverage, and private-label penetration (Sysco brand products) give them pricing power that smaller distributors can't match. Their 18.9% gross margin is roughly the ceiling for broadline food distribution.
PFG's 11.7% gross margin looks alarming, but context matters. PFG has a large "Vistar" convenience distribution segment that runs lower gross margins on higher-velocity products. Their foodservice segment runs closer to 13-14%.
Net margins are razor-thin across the board. Even Sysco, with $81 billion in revenue, keeps only 2.2 cents on each dollar of sales. US Foods keeps 1.9 cents. PFG keeps half a penny.
Mid-Market Food Distributor Benchmarks
Public company data is useful but doesn't perfectly reflect what a $30M-$200M regional food distributor should expect. Smaller distributors lack the scale advantages of a Sysco but also avoid some corporate overhead.
According to the International Foodservice Distributors Association (IFDA 2024 Operations & Financial Performance Report), the median net profit margin for foodservice distributors was 2.9% in 2023.
Here's what mid-market food distributors typically see:
| Metric | Typical Range | Strong Performance |
|---|---|---|
| Gross margin | 15-22% | 22-25% |
| Operating margin | 1-4% | 4-6% |
| Net margin | 0.5-3% | 3-5% |
| EBITDA margin | 3-5% | 5-7% |
Specialty food distributors -- organic, ethnic foods, premium proteins -- often run at the higher end of these ranges. Broadline distributors competing on price with national players tend to sit at the lower end.
Why Food Distribution Margins Are Structurally Low
Food distribution doesn't have thin margins because companies are bad at business. The margins are structural. Here's what drives them.
Perishability and Spoilage
No other distribution vertical deals with products that literally rot on the shelf. Perishable shrink in food distribution ranges from 1-5% of revenue depending on product mix, with fresh produce, dairy, and proteins at the high end.
A building materials distributor's inventory doesn't expire. A food distributor's does.
Spoilage Cost Impact = (Spoiled Units x Unit Cost) / Total Revenue
Example: $800,000 spoilage on $40M revenue = 2.0% margin drag
For a distributor running 18% gross margin, 2% spoilage wipes out more than 10% of their gross profit.
Cold Chain Infrastructure
Refrigerated warehousing costs 2-3x more per square foot than ambient storage. Refrigerated trucks cost more to buy, maintain, and fuel. Temperature monitoring, food safety compliance, and HACCP documentation add labor costs.
These aren't optional expenses. They're table stakes.
| Cost Component | Ambient Distribution | Cold Chain Distribution |
|---|---|---|
| Warehouse cost/sq ft | $4-8/yr | $10-20/yr |
| Truck acquisition | $80-120K | $150-250K |
| Energy costs | Baseline | 2-3x baseline |
| Compliance labor | Minimal | Significant |
A mid-market food distributor might spend 3-5% of revenue on cold chain costs that simply don't exist in electrical or industrial distribution.
Commodity Competition and Thin Supplier Margins
Food products are often interchangeable. A case of chicken thighs from Supplier A is largely equivalent to a case from Supplier B. That commodity dynamic compresses margins because customers will switch for a fraction of a cent per pound.
Supplier margins in food manufacturing are also thin (typically 5-10% operating margin), which limits the rebate and incentive programs that distributors in other verticals rely on for margin enhancement.
Customer Price Sensitivity
Food distribution customers -- restaurants, institutions, grocery stores -- operate on thin margins themselves. A restaurant running 3-5% net margin negotiates hard on food costs because those costs represent 28-35% of their revenue.
Compare that to an HVAC contractor who might spend 40-50% of project cost on equipment but has 15-25% net margins. The HVAC distributor has more room to maintain margin because their customer isn't as price-squeezed.
How Food Distribution Margins Compare to Other Verticals
Food distribution sits at the bottom of the margin spectrum in wholesale distribution. Here's how it stacks up:
| Distribution Vertical | Gross Margin | Operating Margin | Net Margin |
|---|---|---|---|
| Fasteners/Hardware | 30-42% | 6-12% | 4-8% |
| Industrial MRO | 28-38% | 6-12% | 4-8% |
| Auto Parts | 28-40% | 4-8% | 2-5% |
| HVAC | 23-30% | 5-9% | 3-6% |
| Electrical | 22-32% | 5-10% | 3-7% |
| Building Materials | 24-32% | 4-8% | 2-5% |
| Food/Beverage | 15-22% | 1-4% | 0.5-3% |
The gap is substantial. A fastener distributor's gross margin floor (30%) is higher than a food distributor's ceiling (22%). That's not a performance gap -- it's a structural one driven by product characteristics.
For a deeper look at how margins compare across all distribution sectors, see our guide on distributor margins and the full industry comparison.
Where Food Distributors Leak Margin
When your gross margin is 18%, every tenth of a percent matters. Here are the specific areas where mid-market food distributors lose margin they shouldn't.
1. Spoilage and Shrinkage (1-3% of Revenue)
Industry data suggests food distribution shrinkage averages 1.6% of sales (National Retail Federation Security Survey, 2023). For perishable-heavy distributors, the number runs higher.
The causes:
- Over-ordering against demand that doesn't materialize
- Poor rotation (FIFO discipline breaks down in busy warehouses)
- Temperature excursions during receiving, storage, or delivery
- Customer returns on short-dated product
A $50M distributor losing 2% to spoilage is burning $1M per year. Cutting that to 1% through better demand forecasting and rotation discipline adds $500K straight to the bottom line.
2. Unrecovered Delivery Costs (1-2% of Revenue)
Food delivery is expensive. Refrigerated trucks, tight delivery windows, and frequent stops add up. Many food distributors absorb delivery costs that should be passed through or priced into the product.
Common problems:
- No delivery minimums (or minimums that haven't been updated in years)
- Free delivery on small or remote orders that cost $80-150 to fulfill
- Fuel surcharges not applied or inconsistently applied
- Multiple deliveries per week to customers who could consolidate
3. Pricing Inconsistency (1-3% of Revenue)
This is the biggest opportunity for most mid-market food distributors. Customer-specific pricing that hasn't been reviewed, cost increases not passed through, and sales reps with too much pricing authority create wide spreads.
It's common to find the same product sold to similar-sized customers at prices varying by 15-25%. Some of that variation is justified by volume or relationship. Much of it isn't.
Pricing Variance Impact = (Highest Price - Lowest Price) / Average Price x Volume at Lowest Price
Example: Product sold at $24-$30 across similar accounts
Variance = ($30 - $24) / $27 x 10,000 cases = $22,222 on a single SKU
Multiply that across thousands of SKUs and hundreds of customers, and the number gets large fast. For more on this topic, see our post on margin leakage in distribution.
4. Rebate and Incentive Leakage (0.5-1.5% of Revenue)
Supplier rebates in food distribution are less generous than in other verticals, but they still matter. Volume rebates, growth incentives, and marketing funds add 1-3% to effective margin when fully captured.
The Pricing Society estimates that rebate errors cost businesses an average of $3.07 million per year. Common issues in food distribution:
- Missing volume tier thresholds by small amounts
- Not tracking promotional rebate windows
- Failing to claim co-op marketing funds
- Reconciliation gaps between distributor and supplier purchase data
5. Customer Mix Margin Erosion
Not all customers are equally profitable. A restaurant ordering three cases twice a week with next-day delivery requirements and 45-day payment terms costs far more to serve than an institution ordering 50 cases weekly with standard lead times.
Many food distributors don't know their cost-to-serve by customer. They price based on volume alone, which means high-maintenance, small-order customers get subsidized by efficient large-order customers.
How to Improve Food Distributor Margins
The structural constraints of food distribution aren't going away. But there's a consistent 2-5% margin gap between average and well-run food distributors. Here's where the difference comes from.
Run Customer-Level Margin Analysis
Stop looking at margin in aggregate. Break it down by customer, factoring in:
- Product mix and margin by line
- Order frequency and average order size
- Delivery cost per order
- Payment terms and actual days to pay
- Returns and credits
You'll find that 20-30% of your customers generate negative margin after cost-to-serve. That's not unusual in food distribution. What's unusual is doing nothing about it.
Enforce Delivery Economics
Set delivery minimums that reflect actual delivery costs. A refrigerated truck stop costs $80-150 depending on your market. If a customer's order doesn't cover that cost with margin to spare, you're paying them to be your customer.
Update fuel surcharges quarterly. Set minimum order quantities for free delivery. Charge for special delivery windows. These aren't popular moves, but they're survival moves in a 2% net margin business.
Audit and Optimize Pricing Quarterly
Review customer-specific pricing at least quarterly. Cost changes in food distribution happen fast -- commodity prices, supplier cost increases, freight rate changes. Prices need to follow.
Flag accounts where margin has dropped more than 2 points in 90 days. Review all pricing exceptions granted by sales reps. Kill legacy pricing agreements that no longer make sense.
Reduce Spoilage Systematically
Track spoilage by product category, by warehouse location, and by day of week. The patterns will tell you where to focus.
Common high-impact fixes:
- Tighten demand forecasting for volatile items (produce, proteins)
- Enforce FIFO with physical rotation checks
- Add temperature monitoring at receiving and in storage
- Negotiate supplier return policies for slow-moving items
- Reduce SKU count on items with persistent spoilage
Capture Every Rebate Dollar
Assign someone to own supplier rebate management. Track tier thresholds monthly. Time purchases to hit volume breaks before period end. Reconcile purchase data with suppliers quarterly.
In food distribution, rebates might add 1-2% to effective margin. That's the difference between a 2% and a 4% net margin -- a 2x improvement in profitability.
Food Distributor Margin: A Worked Example
A $45M regional food distributor wants to understand their margin structure and find improvement opportunities.
Current state:
| Metric | Amount | % of Revenue |
|---|---|---|
| Revenue | $45,000,000 | 100% |
| COGS | $37,350,000 | 83.0% |
| Gross Profit | $7,650,000 | 17.0% |
| Warehouse/cold chain | $2,250,000 | 5.0% |
| Transportation | $1,800,000 | 4.0% |
| Sales/admin | $2,700,000 | 6.0% |
| Spoilage/shrink | $675,000 | 1.5% |
| Operating Profit | $225,000 | 0.5% |
Gross Margin = $7,650,000 / $45,000,000 = 17.0%
Operating Margin = $225,000 / $45,000,000 = 0.5%
This distributor is below benchmarks. Here's what targeted improvements could do:
| Improvement | Margin Impact | Annual $ Impact |
|---|---|---|
| Fix pricing inconsistency | +1.5% | $675,000 |
| Reduce spoilage from 1.5% to 0.8% | +0.7% | $315,000 |
| Enforce delivery minimums | +0.5% | $225,000 |
| Capture missed rebates | +0.3% | $135,000 |
| Total opportunity | +3.0% | $1,350,000 |
That takes operating margin from 0.5% to 3.5% -- a 7x improvement. The distributor goes from barely surviving to solidly profitable. None of these changes require new technology or capital investment. They require visibility into transaction-level data and the discipline to act on it.
The Bottom Line on Food Distributor Margins
Food distribution is a structurally thin-margin business. The benchmarks are clear:
- Gross margin: 15-22% (Sysco runs 18.9% at the high end)
- Operating margin: 1-4% (median around 2-3%)
- Net margin: 0.5-3% (IFDA median of 2.9% for foodservice distributors)
These margins are lower than every other distribution vertical. Perishability, cold chain costs, commodity competition, and price-sensitive customers make that unavoidable.
But within those structural constraints, there's a wide gap between average and strong performers. The difference is usually 2-4 points of operating margin, driven by pricing discipline, spoilage control, delivery cost recovery, and customer-level profitability management.
If your margins fall below these benchmarks, the opportunity isn't in a new pricing strategy or enterprise software. It's in the details: which customers are profitable, which products are leaking margin, and which costs aren't being recovered.
For more on how distribution pricing works across verticals, see our guide to distribution pricing. For the broader picture on distributor profit margins, we cover all sectors in detail.
Last updated: Invalid Date
Frequently Asked Questions

Want to analyze your entire product catalog?
Pryse automatically identifies margin leakage across thousands of SKUs. Upload your data and find hidden profit in 24 hours.
One-time $1,499 diagnostic. No subscription required.