Margin Leakage in Distribution: Where Your Profit Actually Goes
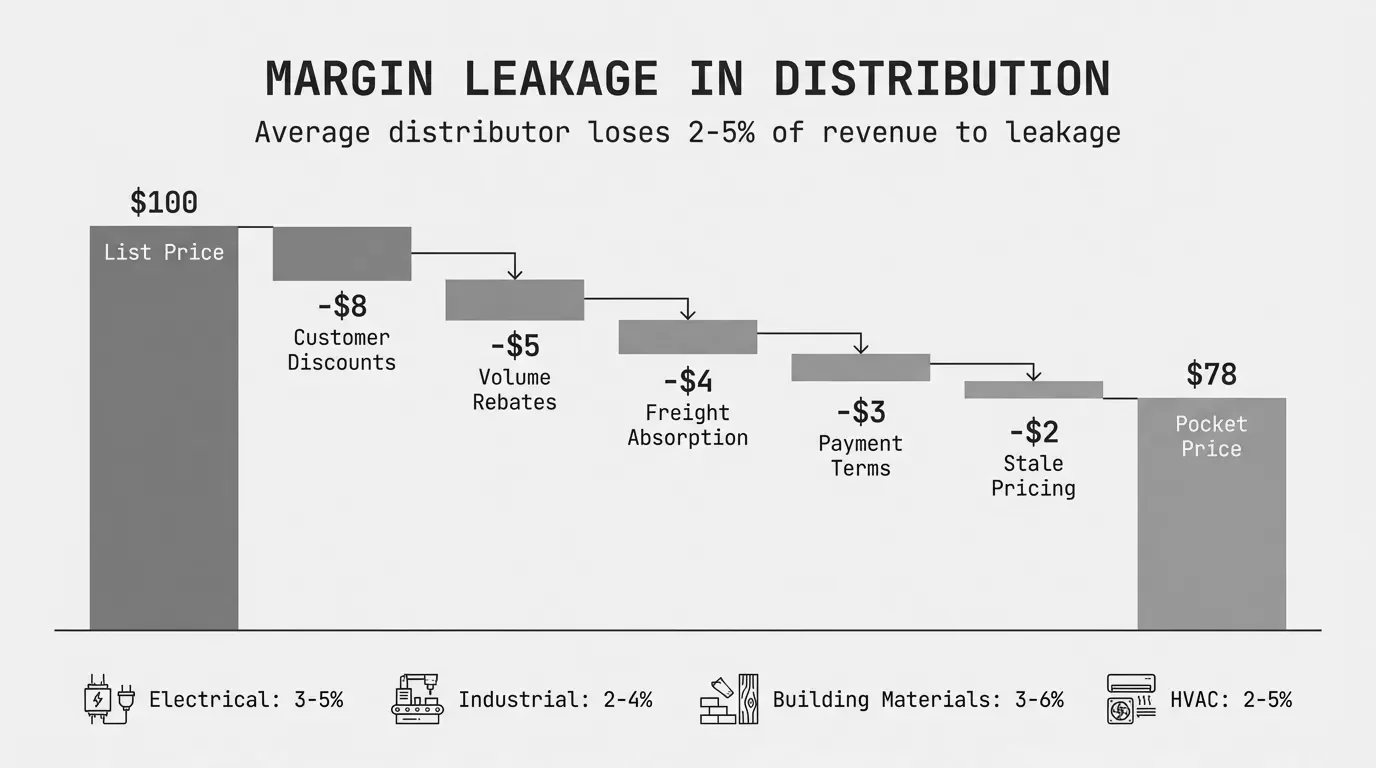
Distribution companies lose 2-5% of revenue to margin leakage. Learn the seven most common sources, how to find them, and what they cost per transaction.
Margin leakage in distribution is the difference between what a distributor should earn on every transaction and what they actually collect after all on-invoice discounts, off-invoice deductions, freight costs, rebates, and payment terms are applied. It's the profit that evaporates between your ERP's margin report and your bank account.
For the average wholesale distributor, that gap runs 2-5% of total revenue. On a $75M business, that's $1.5M to $3.75M that never reaches the bottom line.
And here's what makes distribution different from almost every other industry: the sheer number of places margin can leak. A typical distributor with 30,000 SKUs, 2,000 customers, and 15 sales reps processes hundreds of thousands of transactions per year. Each transaction has its own cocktail of customer-specific pricing, volume tiers, freight terms, payment discounts, and rebate structures. Every one of those elements is a potential leak point.
This isn't about low margins. Distribution has always been a thin-margin business. This is about the gap between your intended margins and your realized margins. That gap is what we're talking about when we talk about margin leakage in distribution, and it's almost certainly bigger than you think.
For the complete framework on identifying and fixing leakage across industries, see our margin leakage guide.
Why Distribution Has a Unique Leakage Problem
Manufacturing companies sell fewer products to fewer customers at negotiated contract prices. Retailers sell at fixed shelf prices to anonymous consumers. Distributors sit in the middle, and they get the worst of both worlds from a leakage perspective.
Here's what makes distribution pricing structurally prone to leakage:
High transaction volume with variable pricing. An industrial distributor might process 500-2,000 orders per day. Unlike retail, nearly every order can have a different price depending on the customer, the volume, the contract terms, and whatever the sales rep agreed to on the phone last Tuesday. More variability means more places for margin to erode.
Multiple discount layers. A single transaction might involve a customer-specific discount, a volume tier, a promotional price, a project bid, and a rebate, all stacking on top of each other. In retail, the price is the price. In distribution, the price is the starting point of a negotiation.
Off-invoice deductions that don't appear in standard margin reports. This is the big one. Most distributors track margin at the invoice level. But the real margin, your pocket margin, includes freight costs, early payment discounts, rebates, returns, and credit adjustments that happen after the invoice. McKinsey's research on pricing waterfalls found that pocket price can be 20-30% below invoice price, with a significant chunk of that gap coming from off-invoice items that most ERP systems don't connect back to individual transactions.
Fragmented pricing authority. Branch managers, outside sales reps, inside sales, and customer service staff all touch pricing. A 2019 McKinsey study found that distributors with thousands of sales reps were routinely giving away free freight and expedited shipping because compensation was tied to sales growth, not margin. The result: strong top-line numbers, shrinking bottom line.
Long customer relationships with stale pricing. That special price you gave ABC Contractors in 2021 when they were doing $400K per year with you? They're now at $150K per year, but the pricing never changed. In distribution, customer-specific pricing outlives the conditions that justified it.
For a deeper look at how pricing waterfalls expose these gaps, see our guide on price waterfall analysis.
The 7 Most Common Sources of Margin Leakage in Distribution
We analyzed transaction-level data across distribution verticals, including electrical, industrial supply, building materials, and HVAC. These are the seven leakage sources that show up consistently, ranked by typical revenue impact.
| Leakage Source | Typical Revenue Impact | Where It Hides |
|---|---|---|
| Customer-specific pricing drift | 0.5-1.5% | ERP price matrices, special price records |
| Rebate tracking and capture gaps | 0.5-2.0% | Supplier portals, manual spreadsheets |
| Freight absorption and giveaways | 0.3-0.8% | Shipping records, delivery cost allocations |
| Cost pass-through lag | 0.3-1.2% | Purchase price vs. sell price timing |
| Discount stacking across tiers | 0.5-1.5% | Order-level margin vs. customer-level margin |
| Payment term erosion | 0.2-0.5% | AR aging, early pay discount utilization |
| Uncompensated value-added services | 0.2-0.7% | Kitting, staging, will-call, custom labeling |
Combined, these seven sources typically account for 2-5% of revenue. On a 25% gross margin business, that's 8-20% of your gross profit dollars walking out the door.
1. Customer-Specific Pricing That Outlives the Relationship
This is the single most common leakage source in distribution, and it's almost entirely invisible in standard reporting.
Here's how it works. A sales rep negotiates a special price for a customer, let's say an electrical contractor doing $500K per year. The price gets entered into the ERP as a customer-specific price matrix. Three years later, the contractor's volume has dropped to $180K. The special pricing stays.
In our analysis across mid-market distributors, we've found that 15-30% of customer-specific price records are stale, meaning the volume, relationship, or competitive conditions that justified the pricing no longer exist.
An electrical distributor with 2,500 active customers and an average of 40 customer-specific price records per customer has 100,000 price points to manage. Nobody's reviewing those on a quarterly basis. Nobody's even reviewing them annually. They just sit in the ERP, silently eroding margin on every transaction they touch.
Annual Leakage from Stale Pricing = Stale Price Records x Average Transactions per Record x Average Margin Gap per Transaction
For a $75M electrical distributor, that math often works out to $375K-$1.1M per year.
2. Rebate Tracking and Capture Gaps
Supplier rebates are a major profit component for distributors. For many, rebates represent 1-3% of revenue and can account for 20-40% of total net profit. Miss a rebate claim or miscalculate a volume threshold, and the impact goes straight to the bottom line.
The problem is how rebates are tracked. Most mid-market distributors manage rebates in spreadsheets, sometimes supplemented by supplier portal data. The rebate structures themselves are complex: volume tiers, growth incentives, product-mix targets, quarterly resets, annual true-ups.
A building materials distributor we looked at had 47 active supplier rebate programs across its top 30 vendors. Twelve of those programs had quarterly volume thresholds. Seven had product-mix requirements. Four had growth-over-prior-year targets. All tracked in a combination of Excel files and email chains maintained by one purchasing manager.
The math on missed rebates is brutal. If you're 2% short of a volume tier that would've unlocked an additional half-point rebate on $3M in purchases, that's $15,000 left on the table from a single vendor program. Multiply across dozens of programs, and the leakage compounds.
According to research from Enable (a rebate management platform), missed claims and threshold miscalculations are a leading source of rebate losses for procurement teams. When you add in timing issues, like claims that expire because the window closed before anyone filed, the total leakage from rebate gaps typically runs 0.5-2% of revenue.
3. Freight Absorption and Giveaways
Freight is one of the least-controlled cost elements in distribution. And it's one of the easiest for sales reps to give away.
A customer calls in a $1,200 order. Your minimum for free delivery is $1,500. The rep waives the delivery charge because the customer is a good account and it's not worth arguing over. That $85 delivery costs you 7% of the order value. Do it 500 times a year across your sales team, and you've absorbed $42,500 in freight that should've been billed.
Now add expedited shipping. Will-call pickups that turn into "can you just drop it off on the way?" requests. LTL shipments to remote job sites. Emergency deliveries that bypass your normal routing.
McKinsey documented exactly this pattern at an electronics distributor: sales reps compensated on revenue growth were routinely giving away free freight and expedited shipping as deal sweeteners. The behavior was rational from the rep's perspective. It was invisible to management because freight costs weren't tied back to individual transactions in their reporting.
For HVAC distributors, freight leakage is compounded by equipment size. A residential HVAC unit might cost $2,500 wholesale, but getting it to a job site an hour outside your delivery zone can cost $150-300. When that delivery cost isn't billed or factored into the quoted price, you've just given away 6-12% of the transaction margin.
Freight Leakage Rate = (Total Freight Cost - Total Freight Billed) / Total Revenue
Most distributors we've seen run a freight leakage rate of 0.3-0.8% of revenue.
4. Cost Pass-Through Lag
Your supplier raises prices on March 1. Your system gets updated on March 15. Your customer-specific pricing doesn't get touched until your next quarterly price review in April. For six weeks, every transaction on affected products ships at the old margin.
In commodity-heavy verticals like electrical distribution (copper wire, conduit, fittings) or building materials (lumber, steel, drywall), cost changes can happen frequently. An electrical distributor might see cost changes on 500-2,000 SKUs per month during volatile commodity cycles. During the 2021-2022 period, some electrical distributors saw weekly cost increases on copper-based products.
The lag problem is worse when you're dealing with customer-specific pricing. Your standard price book might update within days. But those 100,000 customer-specific price records? They update when someone manually touches them, which means some of them won't update for months.
MDM (Modern Distribution Management) reported that distributors saw 2.4% deflation in 2024. In a deflationary environment, cost pass-through lag works the other way, your costs drop but your prices drop faster because customers are tracking market prices and demanding adjustments. Either direction, the lag costs you.
For an industrial supply distributor carrying 50,000 SKUs with an average cost change cycle of 30 days, and an average lag of 15 days on customer pricing updates:
Cost Pass-Through Lag Leakage = SKUs Affected x Average Daily Transactions per SKU x Average Cost Change % x Lag Days / 365
Typical impact: 0.3-1.2% of revenue, depending on commodity exposure and update processes.
5. Discount Stacking Across Tiers
Discount stacking happens when multiple discounts apply to the same transaction and nobody's looking at the combined effect.
Here's a real scenario from an industrial supply distributor. A customer has:
- A customer-class discount of 10% (they're a "Gold" account)
- A product-line discount of 8% (on safety equipment)
- A project bid price that was 5% below the already-discounted price
- A quarterly volume rebate of 2%
Each discount was approved individually. Each one made sense in isolation. Together, they compound:
Effective Discount = 1 - (0.90 x 0.92 x 0.95 x 0.98) = 1 - 0.7706 = 22.9%
The customer thinks they're getting a 10% discount. The actual effective discount is 22.9%. On a 25% gross margin business, that transaction is running at 2.1% gross margin after all the stacking. Below breakeven once you factor in cost-to-serve.
The stacking problem is worse in distribution than other channels because distributors tend to have more discount types. Customer-level, product-level, order-level, program-level, contract-level, and exception-level discounts can all layer on top of each other. Most ERPs apply them sequentially without surfacing the combined impact.
According to Insight2Profit, when companies fail to factor in all potential costs like discounts, freight, program allowances, rebates, and payment terms, they don't know how much of the price actually reaches the bottom line.
6. Payment Term Erosion
Net-30 terms sound straightforward. In practice, distributors often end up financing their customers for much longer.
A customer on Net-30 terms with a 2% early-pay discount should either pay in 10 days (and take the discount) or pay in 30 days (at full price). Instead, they take the 2% discount and pay on day 28. Or they pay on day 45 without the discount, and nobody follows up because the account is current enough.
For distributors carrying $8-15M in receivables (typical for a $50-100M distributor), payment term erosion creates a dual hit: the cost of carrying the receivables longer than expected, plus the unearned early-pay discounts that slip through.
Payment Term Leakage = Unearned Early Pay Discounts + (Excess Days x Average AR Balance x Cost of Capital / 365)
On a $75M distributor with $12M average AR, if actual average days-to-pay runs 38 days instead of the contractual 30, and 15% of customers take unearned early-pay discounts, the combined leakage typically runs $150K-375K per year.
7. Uncompensated Value-Added Services
Distributors provide services that customers can't easily get elsewhere. Cut-to-length steel. Kitted electrical panels. Custom labeling. Job-site staging. Technical support calls. Emergency after-hours pickup.
Most distributors charge for some of these services on paper. In practice, they get given away as relationship builders. "Don't charge them for the cuts, they're a big account." "Waive the kitting fee, we're trying to win the project."
An HVAC distributor providing system design assistance for contractors might spend 4-6 hours on a residential project specification. At a loaded labor cost of $45/hour, that's $180-270 in engineering time that doesn't appear on any invoice. If the contractor awards the equipment order, you might break even on the service. If they get a lower price from another supplier and only buy the accessories from you, you've just donated $200 in engineering services.
Building materials distributors face a version of this with will-call customers who use the branch as their personal warehouse. They order small quantities frequently, tie up counter staff, and drive transaction costs up. A $150 will-call order with 12 line items costs more to process than a $3,000 delivery order with 8 line items, but the pricing often doesn't reflect the difference.
Margin Leakage by Distribution Vertical
The leakage profile varies by vertical because the product mix, customer behavior, and competitive dynamics differ. Here's what we've seen across four major distribution verticals.
Electrical Distribution
Typical gross margin: 22-28%. Typical leakage: 2.5-4% of revenue.
Electrical distributors face the highest commodity exposure in distribution. Copper prices directly impact wire, cable, and busbar pricing. During volatile commodity cycles, cost pass-through lag becomes the dominant leakage source.
The other big issue in electrical is project pricing. Large commercial and industrial projects involve competitive bids where prices get sharpened to win the job. Those project prices sometimes leak into stock orders when a customer calls and says, "Just give me the project price on this, too." Over time, the project exception becomes the default.
An electrical distributor running $60M in revenue with 35,000 SKUs and 1,800 active customers might have:
- 2,200 stale customer-specific prices (leakage: $420K/year)
- 8 missed or under-claimed supplier rebate thresholds (leakage: $180K/year)
- 15% freight absorption rate on orders under $500 (leakage: $225K/year)
- 22-day average cost pass-through lag on commodity products (leakage: $330K/year)
Total estimated leakage: $1.15M, or about 1.9% of revenue. That's real money on a business running 4-5% EBITDA.
Industrial Supply Distribution
Typical gross margin: 28-35%. Typical leakage: 3-5% of revenue.
Industrial supply distributors typically have the widest product assortments (20,000-80,000 SKUs) and the most complex pricing structures. MRO (maintenance, repair, and operations) purchasing is relationship-driven, which means more customer-specific pricing and more negotiated exceptions.
The biggest leakage source in industrial supply tends to be discount stacking. Large industrial accounts might have a blanket purchase agreement, a product-line discount program, a volume rebate, and individual line-item negotiations all running simultaneously. A $100M industrial supply distributor we analyzed had 23% of transactions running below 15% gross margin, most of them customers with three or more stacked discount structures.
Building Materials Distribution
Typical gross margin: 18-25%. Typical leakage: 2-3.5% of revenue.
Building materials distributors operate on the thinnest gross margins in distribution, which makes leakage proportionally more painful. A 2% leakage rate on a 20% gross margin means 10% of your gross profit is walking out the door.
The dominant leakage sources in building materials are cost pass-through lag (lumber, steel, and concrete prices are volatile and change frequently) and freight absorption (heavy products with high delivery costs).
During the 2021-2023 lumber price swings, building materials distributors with monthly price update cycles were constantly behind the market. Some reported that their system prices lagged actual costs by 2-4 weeks during rapid price movements, creating periods where 5-15% of transactions shipped below current replacement cost.
HVAC Distribution
Typical gross margin: 24-32%. Typical leakage: 2-4% of revenue.
HVAC distribution has a unique leakage profile because of the split between equipment (low margin, high dollar) and parts/supplies (higher margin, lower dollar). Equipment sales often run 12-18% gross margin. Parts and accessories might run 35-50%.
The leakage risk in HVAC is concentrated on the equipment side, where project bids, contractor loyalty pricing, and manufacturer program requirements create multiple discount layers. Carrier and Trane both run tiered dealer programs that interact with distributor-level pricing, creating situations where the effective margin on an equipment sale can drop below 8% once all program requirements are applied.
HVAC distributors also face significant uncompensated service leakage. System design, load calculations, equipment selection, and warranty processing are all services that add cost without corresponding revenue. A mid-size HVAC distributor might employ 3-5 people whose primary job is contractor support, representing $250K-500K in annual labor cost that doesn't appear on any invoice.
How to Find Your Leakage: A Practical Starting Point
You don't need a six-figure pricing tool to get started. Here's a framework that works with the data you already have in your ERP.
Step 1: Export Your Transaction Data
Pull 12 months of transaction-level data from your ERP. You need:
- Customer ID, name, and class/tier
- SKU, product category, and product line
- Invoice date, quantity, unit price, extended price
- Cost at time of sale (not current cost)
- Any discount codes or price override flags
- Freight charges (billed and actual)
If you're on NetSuite, SAP Business One, or D365, these exports are straightforward. The freight piece is sometimes harder because actual delivery costs may live in a separate logistics module.
Step 2: Build a Transaction-Level Margin View
For each transaction line, calculate:
Invoice Margin = (Invoice Price - Cost) / Invoice Price
Pocket Margin = (Invoice Price - Cost - Freight Cost - Allocated Rebates - Payment Discounts) / Invoice Price
Margin Gap = Invoice Margin - Pocket Margin
The margin gap tells you how much is leaking between your ERP's reported margin and your actual realized margin.
Step 3: Segment and Rank
Sort your transactions by margin gap (largest first) and look for patterns:
- Which customers have the biggest gap between invoice and pocket margin?
- Which product categories show the most cost pass-through lag?
- Which sales reps have the highest freight absorption rates?
- Where are discounts stacking to produce margins below your floor?
Step 4: Quantify the Opportunity
For each leakage source, estimate the annual impact:
| Leakage Source | How to Calculate | What to Look For |
|---|---|---|
| Stale customer pricing | Compare customer volume trends vs. price tier qualification | Customers whose volume dropped 30%+ but pricing didn't change |
| Freight absorption | Total freight cost minus total freight billed | Reps or branches with freight recovery rates below 60% |
| Cost pass-through lag | Time between cost change and price change, multiplied by affected volume | Products with high cost volatility and monthly+ update cycles |
| Discount stacking | Effective combined discount vs. intended discount level | Transactions with 3+ discount types and margins below 15% |
| Rebate gaps | Actual rebate claims vs. maximum available rebate | Programs where you're within 5% of the next tier threshold |
This analysis typically reveals $500K-2M in addressable leakage for a $50-100M distributor. Not all of it is recoverable. Some customer-specific pricing exists for competitive reasons you still need to honor. Some freight absorption is genuinely part of the value proposition. But in our experience, 40-60% of identified leakage is fixable without losing volume.
For more on building this analysis, see our guide on margin analysis.
The Math That Makes This Urgent
McKinsey analyzed 130 publicly traded distributors and found that a 1% price increase yields a 22% increase in EBITDA margins. They also found that to achieve the same EBITDA impact through other means, a distributor would need to grow volume by 5.9% while holding operating expenses flat, or reduce fixed costs by 7.5%.
Margin leakage recovery works the same way. Every dollar of leakage you stop flows directly to EBITDA because there's no incremental cost associated with collecting revenue you should've already been collecting.
EBITDA Impact of Leakage Recovery = Recovered Margin / Current EBITDA
For a $75M distributor at 4% EBITDA ($3M), recovering just 1% of revenue from margin leakage ($750K) would increase EBITDA by 25%. Same customers, same products, same sales team. You're just collecting what you were already supposed to earn.
NAW data shows that most distributors are leaving at least two percentage points of gross trading margin on the table. That's 2% of total sales, translating to the single largest available profit improvement for most mid-market distributors.
The distributors that have invested in pricing optimization, whether through internal process improvements or technology, have seen margin uplifts of 200 to 500 basis points, according to McKinsey. You don't have to get all the way there to make a meaningful difference. Even recovering half a point changes the trajectory of the business.
What to Do About It
Fixing margin leakage in distribution isn't a technology problem first. It's a visibility problem. You can't fix what you can't see, and most distributors can't see where their margin actually goes after the invoice.
Start with the data. Pull the transaction exports. Run the margin analysis. Build the price waterfall. Quantify the gap between your invoice margin and your pocket margin.
Then prioritize. Go after the biggest leakage sources first. For most distributors, that's stale customer-specific pricing and rebate capture gaps. These two alone typically account for 40-50% of total leakage and are the most straightforward to fix.
Set margin floors by customer and product category. Flag transactions that fall below the floor for review before they ship. This single change, a margin floor alert in your ERP, catches the worst stacking and exception pricing before it becomes a pattern.
Review customer-specific pricing quarterly, not annually. Tie pricing tiers to actual volume, and set automatic expiration dates on exception pricing. If a customer's volume drops below the threshold, their pricing should adjust automatically.
Track freight recovery rate by rep and branch. Make it visible. When people know the number is being watched, behavior changes fast.
For more on how distributor margins break down by segment and where the benchmarks actually sit, that gives you the context to know whether your margins are thin by design or thin because of leakage.
The difference between a 4% EBITDA distributor and an 8% EBITDA distributor isn't usually product mix or market position. It's pricing discipline and leakage control. The revenue is already there. The margin is already there. You just have to stop giving it away.
Frequently Asked Questions
What is margin leakage in distribution?
Margin leakage in distribution is the difference between a distributor's intended margin on a transaction and the actual cash profit realized after all discounts, rebates, freight, payment terms, and off-invoice deductions are applied. NAW research indicates the average distributor loses at least 2 percentage points of gross margin to leakage, and for many mid-market distributors the figure runs 2-5% of total revenue. It's different from simply having low margins. Low margins are a pricing strategy choice. Leakage is unintentional margin erosion that accumulates across thousands of transactions.
How do I calculate margin leakage for my distribution business?
Start by calculating your pocket margin on every transaction: take the invoice price, subtract the actual cost of goods, subtract freight costs you absorbed, subtract any off-invoice rebates or credits, and subtract the cost of payment term discounts. Compare this pocket margin to your invoice margin (what your ERP reports). The difference is your leakage rate. For a quick benchmark: if your ERP reports 25% gross margin but your pocket margin analysis shows 21%, you have 4 points of leakage, which is 16% of your gross profit.
Does margin leakage affect small distributors differently than large ones?
Yes, but not in the direction most people assume. Smaller distributors ($20-50M) often have less leakage in absolute dollars but more leakage as a percentage of revenue. They tend to have fewer formal pricing processes, more exception pricing approved by a single owner/GM, and less infrastructure for rebate tracking. Larger distributors ($100M+) have more total leakage dollars but often better tools and processes to manage it. The mid-market ($50-200M) typically has the highest leakage rates because they've grown past the point where one person can manage pricing but haven't yet invested in pricing infrastructure.
What's the fastest way to reduce margin leakage?
Three actions produce the fastest results. First, audit customer-specific pricing against actual volume. Flag every customer whose volume has dropped 25%+ while their pricing remained unchanged, and schedule pricing conversations. Second, set margin floor alerts in your ERP so that orders below a minimum margin get flagged before shipping. Third, reconcile your top 10 supplier rebate programs against actual purchase volumes and claim every dollar you've earned. These three actions typically recover 30-50% of total leakage within 90 days.
Should I invest in pricing software to fix margin leakage?
For most mid-market distributors, the answer is not yet. Enterprise pricing tools (PROS, Vendavo, Zilliant, PriceFX) cost $100K-500K per year and require 6-18 months to implement. Before making that investment, get visibility into your current leakage using your existing ERP data and structured analysis. Many distributors recover enough margin through basic process changes, pricing hygiene, and better rebate tracking to fund a technology investment from the savings. Start with the analysis, quantify the opportunity, then decide if the scale of the problem justifies the technology spend.
Last updated: January 29, 2026
Frequently Asked Questions

Want to analyze your entire product catalog?
Pryse automatically identifies margin leakage across thousands of SKUs. Upload your data and find hidden profit in 24 hours.
One-time $1,499 diagnostic. No subscription required.