Distributor Margin Formula: How to Calculate Gross, Operating, and Net Margin
The distributor margin formula for gross, operating, net, and pocket margin. Worked examples, margin vs markup conversion table, and common mistakes.
The distributor margin formula calculates what percentage of the selling price you keep as profit after subtracting the cost of goods.
Distributor Margin % = (Selling Price - Cost of Goods) / Selling Price x 100A distributor buying product at $75 and selling at $100 earns a 25% margin. That $25 per unit has to cover warehouse costs, delivery, sales compensation, and every other operating expense before you see profit.
There are four margin formulas that matter in distribution: gross, operating, net, and pocket. Each one strips away another layer of cost to show you a different picture of profitability.
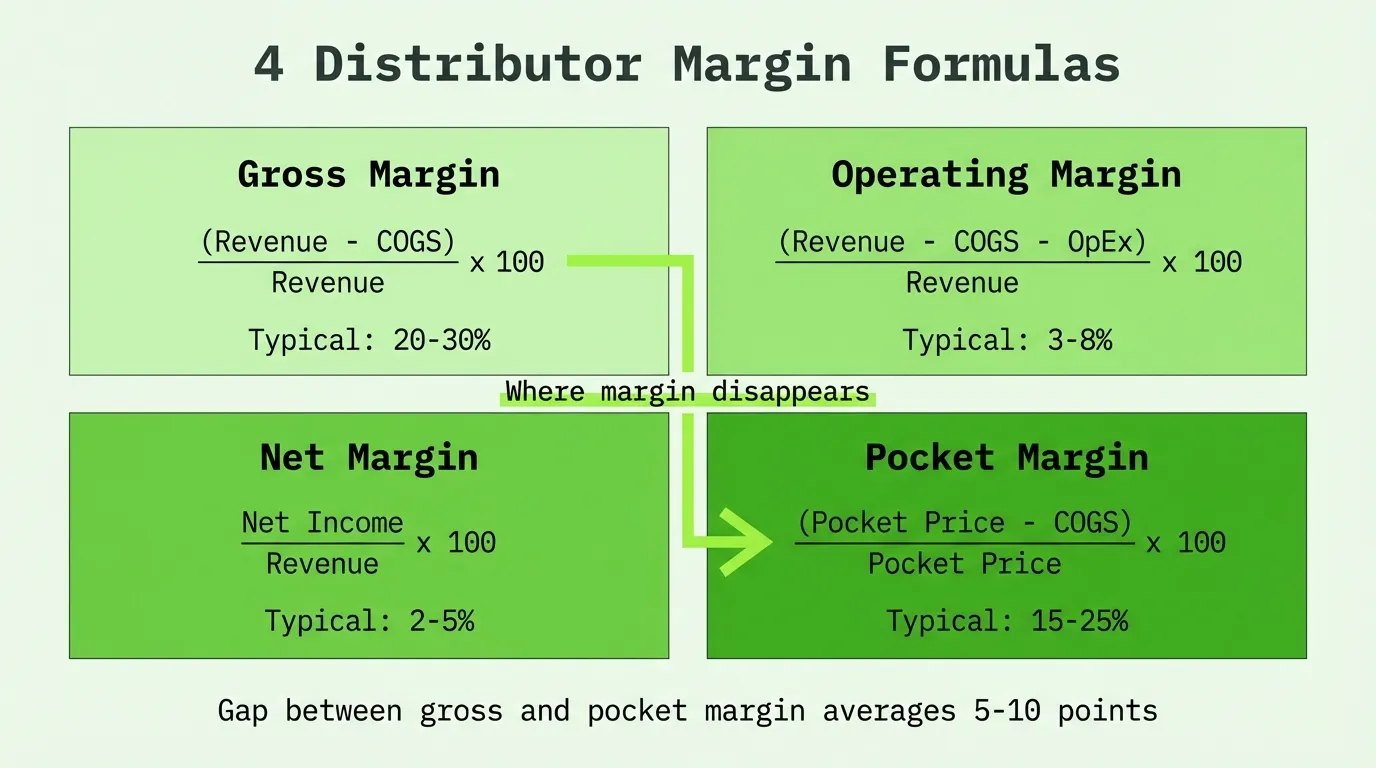
The Four Distributor Margin Formulas
1. Gross Margin
Gross margin is the starting point. It measures what's left after subtracting the direct cost of the product.
Gross Margin % = (Revenue - COGS) / Revenue x 100Most wholesale distributors operate at 20-30% gross margin (NAW, 2024). This is the number you'll see on a P&L as gross profit percentage.
Example: An electrical distributor sells $500,000 in wire and fittings during Q1. The cost from suppliers was $375,000.
($500,000 - $375,000) / $500,000 x 100 = 25%That 25% gross margin leaves $125,000 to cover everything else.
2. Operating Margin
Operating margin subtracts operating expenses from gross profit. This is your distribution business's real earnings power before financing and taxes.
Operating Margin % = (Revenue - COGS - Operating Expenses) / Revenue x 100Distribution operating margins typically run 3-8%. The NAW reports the industry average at roughly 4% EBITDA, with elite distributors reaching 8-12%.
Example: That same electrical distributor has $105,000 in operating costs (warehouse, trucks, sales team, G&A).
($500,000 - $375,000 - $105,000) / $500,000 x 100 = 4%The 25% gross margin compressed to 4% operating margin. That's distribution economics: thin operating margins built on volume.
3. Net Margin
Net margin is the bottom line after interest, taxes, and all remaining costs.
Net Margin % = Net Profit / Revenue x 100Most distributors land in the 2-5% net margin range. According to NYU Stern's industry data (2025), food wholesalers average just 1.17% net margin, while broader wholesale distribution runs 2-4%.
Example: After $3,000 in interest and $5,000 in taxes, the distributor's net profit is $12,000.
$12,000 / $500,000 x 100 = 2.4%4. Pocket Margin
Pocket margin is the one most distributors don't track, and it's often the most revealing. It accounts for every deduction between list price and what actually hits your bank account.
Pocket Margin % = (Pocket Price - COGS) / Pocket Price x 100Where pocket price = invoice price minus all off-invoice deductions (rebates paid out, freight absorbed, early-payment discounts given, co-op marketing, returns and allowances).
According to McKinsey's pricing practice, pocket prices can be 15-30% lower than list prices once you account for all the leakage in the price waterfall. That gap is where margin hides.
Example: The distributor's average list price on a product is $100. After a 5% volume discount on the invoice, plus 3% in freight absorption, 2% in rebates paid to the customer, and 1% in early-pay discounts:
Invoice Price = $100 - $5 (volume discount) = $95
Pocket Price = $95 - $3 (freight) - $2 (rebate) - $1 (early-pay) = $89
Pocket Margin = ($89 - $75) / $89 x 100 = 15.7%
The 25% gross margin at list price became 15.7% pocket margin after deductions. That 9+ point gap is real money.
Worked Example: Full Margin Breakdown
Here's a complete calculation for a $60M building materials distributor.
| Line Item | Amount |
|---|---|
| Revenue | $60,000,000 |
| Cost of goods sold | $44,400,000 |
| Gross profit | $15,600,000 |
| Operating expenses | $13,200,000 |
| Operating profit | $2,400,000 |
| Interest + taxes | $900,000 |
| Net profit | $1,500,000 |
Gross Margin = $15,600,000 / $60,000,000 = 26.0%
Operating Margin = $2,400,000 / $60,000,000 = 4.0%
Net Margin = $1,500,000 / $60,000,000 = 2.5%
These numbers are typical. The 26% gross margin sits squarely in the building materials distribution range of 23-28%. The 4% operating margin matches the NAW industry average. And 2.5% net means $1.5M on $60M in revenue.
For industry-specific ranges, see our breakdown of distributor margins by industry.
Margin vs. Markup: The Conversion That Trips Everyone Up
Margin and markup use the same dollar profit but different denominators. Confusing them is one of the most expensive mistakes in distribution pricing.
Margin % = (Price - Cost) / Price x 100
Markup % = (Price - Cost) / Cost x 100
When your sales rep says they're "selling at 25%," you need to know: 25% margin or 25% markup? The difference on a $100 product:
- 25% margin: cost is $75, profit is $25
- 25% markup: cost is $80, profit is $20
That's a 20% difference in profit dollars on the same transaction.
Margin-to-Markup Conversion Table
Use this table to convert between the two. Keep it bookmarked.
| Margin % | Markup % | Multiplier |
|---|---|---|
| 10% | 11.1% | 1.111x |
| 15% | 17.6% | 1.176x |
| 20% | 25.0% | 1.250x |
| 25% | 33.3% | 1.333x |
| 30% | 42.9% | 1.429x |
| 35% | 53.8% | 1.538x |
| 40% | 66.7% | 1.667x |
Conversion formulas:
Markup % = Margin % / (1 - Margin %)
Margin % = Markup % / (1 + Markup %)
Example: Your finance team wants 30% margin. What markup do you set?
Markup = 0.30 / (1 - 0.30) = 0.30 / 0.70 = 42.9%You'd multiply cost by 1.429 to hit a 30% margin target. For more on this conversion, see our markup to margin calculator.
Common Distributor Margin Formula Mistakes
Five errors that show up repeatedly in distribution pricing spreadsheets:
1. Using markup when you mean margin. A sales rep told to "maintain 25% margin" who applies a 25% markup is actually delivering 20% margin. Across thousands of transactions, that 5-point gap adds up fast.
2. Excluding freight from COGS. Inbound freight is part of your product cost. If you're paying $2 per unit in shipping and not including it in COGS, your margin calculation overstates profitability. Your gross margin looks 2-3 points better than reality.
3. Ignoring off-invoice deductions. Gross margin calculated from invoice price misses everything that leaks out afterward: freight absorbed on delivery, rebates, returns, early-payment discounts. The gap between invoice margin and pocket margin is where most margin disappears.
4. Using stale costs. Supplier prices change. If your margin formula uses last quarter's cost data, you're making pricing decisions on wrong numbers. A 3% supplier price increase you haven't factored in wipes out your entire operating margin.
5. Calculating margin on the wrong base. Company-wide margin averages mask what's really happening. The average margin across all customers might be 24%, but if your top 10 accounts run at 18% and your small accounts run at 32%, you've got a customer mix problem. Break it down by customer and product for the real picture. Our margin analysis guide walks through this approach.
Quick-Reference: Distributor Margin Benchmarks
Typical margin ranges by distributor type so you can benchmark your own numbers:
| Distributor Type | Gross Margin | Operating Margin | Net Margin |
|---|---|---|---|
| Food / grocery | 12-18% | 1-3% | 1-2% |
| Commodity / bulk | 15-20% | 2-4% | 1-3% |
| General wholesale | 20-25% | 3-5% | 2-4% |
| Electrical | 22-28% | 3-6% | 2-4% |
| Building materials | 23-28% | 4-7% | 2-5% |
| HVAC | 25-35% | 5-8% | 3-6% |
| Industrial MRO | 28-35% | 5-10% | 3-7% |
| Specialty / value-add | 30-40% | 7-12% | 4-8% |
Sources: NAW (2024), NYU Stern industry data (2025), Exporteers industry margin research (2024).
If you're below these ranges, the formulas aren't wrong. Your pricing execution is. The most common fix isn't a new formula; it's applying the formula consistently across every customer and product.
From Formula to Action
Knowing the distributor margin formula is the easy part. The hard part is applying it across 10,000 SKUs, 500 customers, and three years of transaction history to find where margin is actually leaking.
Most mid-market distributors discover 2-5 percentage points of recoverable margin when they analyze transaction-level data (NAW, 2024). On $50M in revenue, that's $1-2.5M in profit hiding in your pricing.
If you're running this analysis in Excel and hitting the limits of what spreadsheets can do, Pryse automates the margin breakdown. Upload your transaction data and see your margin by customer, product, and time period in 24 hours.
For the complete guide to distribution pricing strategy, see our distribution pricing guide.
Last updated: Invalid Date
Frequently Asked Questions

Want to analyze your entire product catalog?
Pryse automatically identifies margin leakage across thousands of SKUs. Upload your data and find hidden profit in 24 hours.
One-time $1,499 diagnostic. No subscription required.