Distributor Margins: What Margins Should Wholesale Distributors Expect?
Understand typical gross, operating, and net margins for wholesale distributors. Industry benchmarks for electrical, HVAC, building materials, and industrial distribution.
Distributor margin is the profit a wholesale distributor earns on sales, calculated as the difference between what they pay for goods and what they sell them for, minus operating costs.
Gross Margin = (Selling Price - Cost of Goods) / Selling Price x 100
Operating Margin = (Selling Price - COGS - Operating Expenses) / Selling Price x 100
Net Margin = Net Profit / Selling Price x 100
Wholesale distribution is a thin-margin business. Where retailers might mark up products 50-100%, distributors typically add 20-40%. The trade-off: distributors move higher volumes and turn inventory faster. The business model works on velocity, not margin percentage.
This guide covers what margins distributors should actually expect, how margins vary by industry vertical, and where the gaps are between average and top-performing distributors.
Typical Distributor Margins by Type
Distribution margins vary widely based on what you sell, who you sell to, and what services you provide. Here are the ranges across the three main margin types.
Gross Margin
Gross margin is what remains after subtracting the cost of goods from revenue. For distributors, this is primarily purchase cost from suppliers.
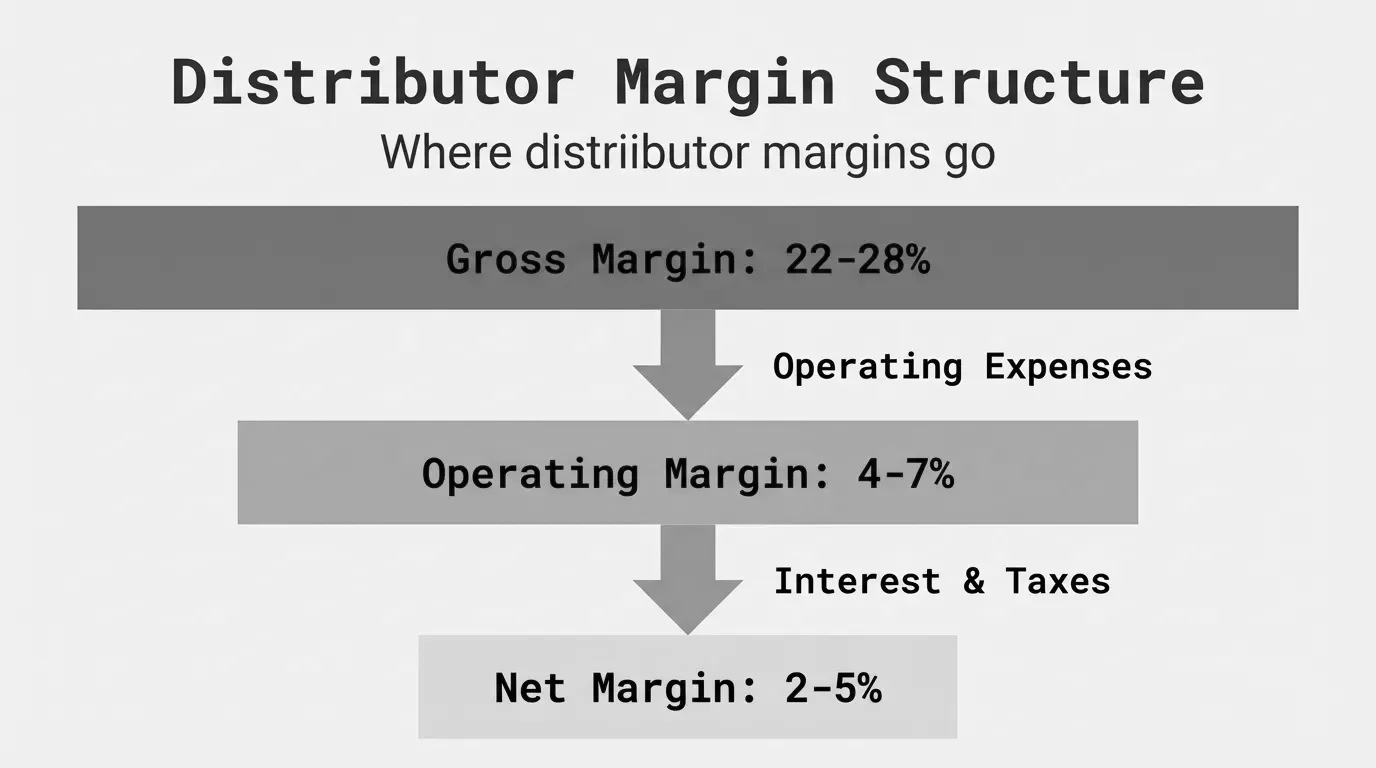
Typical range: 20-30%
| Distributor Type | Gross Margin Range |
|---|---|
| Commodity/bulk | 15-20% |
| General wholesale | 20-25% |
| Specialty/technical | 25-35% |
| Value-added services | 30-40% |
A distributor buying product at $70 and selling at $100 earns 30% gross margin. That $30 per unit needs to cover every operating expense plus profit.
Operating Margin
Operating margin subtracts operating expenses from gross profit: warehouse costs, sales salaries, trucks, insurance, and G&A.
Typical range: 3-8%
According to NAW (National Association of Wholesaler-Distributors), the wholesale-distribution industry average runs approximately 4% net profit. Average distributors achieve EBITDA around 4% while elite distributors reach 8-12%.
That spread matters. A $50M distributor at 4% operating margin generates $2M. The same distributor at 10% generates $5M. Same revenue, same hours worked, $3M difference.
Net Margin
Net margin is the bottom line after interest, taxes, and all other expenses.
Typical range: 2-5%
Most distributors land in the 2-4% net margin range. Breaking 5% puts you in strong territory. Breaking 8% puts you in rare company.
The compression from gross to net is where distribution economics get real. A 25% gross margin becomes 4% net margin after covering:
| Expense Category | Typical % of Revenue |
|---|---|
| Warehouse and facilities | 3-5% |
| Transportation/delivery | 2-4% |
| Sales compensation | 4-6% |
| Administrative/G&A | 3-5% |
| Inventory carrying cost | 2-3% |
| Interest and financing | 1-2% |
| Taxes | 1-2% |
Add those up and you've consumed 16-27% of revenue before profit. That's why a 25% gross margin leaves only 2-5% net.
Distributor Margins by Industry
Different distribution verticals operate with different margin structures based on product characteristics, customer expectations, and competitive dynamics.
Electrical Distribution
Electrical distributors handle wire, conduit, lighting, controls, and related products for construction and industrial customers.
| Metric | Typical Range |
|---|---|
| Gross margin | 22-28% |
| Operating margin | 3-6% |
| Net margin | 2-4% |
Electrical distribution is competitive. Products are often specified, reducing the distributor's ability to substitute higher-margin alternatives. Counter sales mix with project work, creating variable margins across the business.
According to Electrical Wholesaling, fewer than 1% of electrical distributors achieve 10% EBITDA. Most operate in the 3-5% range.
Where margin hides: Electrical distributors often leave margin on the table through inconsistent pricing across branches, failure to capture all supplier rebates, and excessive freight absorption on small orders.
HVAC Distribution
HVAC distributors sell heating, cooling, and refrigeration equipment to contractors.
| Metric | Typical Range |
|---|---|
| Gross margin | 25-35% |
| Operating margin | 5-8% |
| Net margin | 3-6% |
HVAC distribution tends to run slightly higher margins than electrical because equipment carries better margins than commoditized electrical products. The contractor customer base is relationship-driven, creating some pricing flexibility.
Top HVAC distributors target 8-10% net margins through a combination of equipment sales, parts, and value-added services like technical support and training.
Where margin hides: Seasonal demand creates inventory challenges. Distributors who manage seasonal stock well and avoid heavy discounting to clear summer inventory protect margin.
Building Materials Distribution
Building materials distributors supply lumber, drywall, roofing, siding, and related products to contractors and builders.
| Metric | Typical Range |
|---|---|
| Gross margin | 23-28% |
| Operating margin | 4-7% |
| Net margin | 2-5% |
Building materials distribution is logistics-intensive. Delivery costs run higher than most distribution verticals because products are heavy, bulky, and delivered to job sites. Margin depends heavily on delivery efficiency.
The median pro-oriented building materials dealer runs around 26-27% gross margin. Net margins are sensitive to lumber price volatility and construction activity levels.
Where margin hides: Freight and delivery optimization is the biggest opportunity. Distributors who charge appropriately for delivery, optimize routes, and set minimum order sizes protect margin.
Industrial MRO Distribution
Industrial MRO (maintenance, repair, operations) distributors supply fasteners, abrasives, safety equipment, and thousands of other products to manufacturing and industrial facilities.
| Metric | Typical Range |
|---|---|
| Gross margin | 28-35% |
| Operating margin | 5-10% |
| Net margin | 3-7% |
Industrial distribution supports broader gross margins because of product variety, customer switching costs, and value-added services. A plant running a production line will pay more for same-day delivery of a critical part than they would for advance-planned inventory.
The challenge is SKU proliferation. Industrial distributors often carry 50,000+ SKUs, creating complexity in pricing, inventory management, and vendor relationships.
Where margin hides: Customer-specific pricing that outlives the original negotiation is common. Prices set for a customer in 2018 may still be active even though their volume dropped 50%.
How Distributor Margins Differ from Retail and Manufacturing
Distribution sits in the middle of the supply chain, which shapes its margin structure.
Distributor vs. Retail Margins
Retailers mark up products 40-100% or more. A product that costs $50 might sell for $100 at retail. Gross margins of 40-50% are common.
Distributors can't do that. Their customers are businesses buying in quantity. A contractor buying 500 units won't pay retail markup. The distributor adds 20-40% instead and makes it up on volume.
| Retail | Distribution | |
|---|---|---|
| Typical markup | 40-100% | 20-40% |
| Typical gross margin | 35-50% | 20-30% |
| Typical net margin | 3-8% | 2-5% |
| Transaction size | Small | Large |
| Customer relationship | Transactional | Ongoing |
Retailers invest in store experience and consumer marketing. Distributors invest in inventory depth, delivery capability, and customer service.
Distributor vs. Manufacturing Margins
Manufacturers typically earn higher margins than distributors because they add more value to the product.
| Manufacturing | Distribution | |
|---|---|---|
| Typical gross margin | 25-45% | 20-30% |
| Typical operating margin | 10-18% | 3-8% |
| Typical net margin | 5-12% | 2-5% |
| Capital intensity | High | Medium |
| Value creation | Product transformation | Logistics and availability |
Manufacturers transform raw materials into finished goods. That transformation justifies higher margins. Distributors move products from manufacturers to end users. That logistics function commands smaller margins but requires less capital investment per revenue dollar.
Some distributors increase margins by adding manufacturing-like value: cutting wire to length, kitting components, or light assembly. These value-added services push margins toward manufacturing territory.
The Gap Between Average and Elite Distributors
NAW data shows elite distributors earn 2-3x the profit of average distributors on similar revenue. The difference isn't luck or market conditions. It's execution on a few specific areas.
Pricing Discipline
Average distributors give pricing authority to sales reps without guardrails. Prices vary 15-25% across customers for the same product with no clear reason.
Elite distributors set pricing systematically. Customer-specific prices have defined justification. Exceptions require approval. The pricing matrix is reviewed annually.
NAW research suggests most distributors leave at least 2 percentage points of gross margin on the table through pricing inconsistency. On $50M in revenue, that's $1M in margin waiting to be captured.
Cost-to-Serve Awareness
Average distributors treat all customers the same. A customer ordering 200 times per year in small quantities with next-day delivery expectations gets the same margin treatment as one ordering monthly in full pallets.
Elite distributors know cost-to-serve varies by customer. They price accordingly or set service level expectations.
A customer demanding next-day delivery, accepting small orders, and paying in 60 days costs 8-12% more to serve than standard terms. That difference should show up somewhere: higher prices, delivery charges, or lower priority.
Supplier Rebate Capture
Supplier rebates can add 2-5% to effective margin for distributors who optimize them. The programs are complex: volume tiers, growth targets, product-specific rates, and marketing funds.
Average distributors leave rebate money on the table. They don't track tier thresholds, miss deadlines for growth bonuses, or don't claim eligible marketing funds.
Elite distributors manage rebates like a profit center. They know which suppliers are closest to tier thresholds and push volume accordingly.
Inventory Turn
Inventory carrying cost runs 20-30% of inventory value annually when you include capital cost, warehouse space, insurance, obsolescence, and handling.
A distributor with 6x inventory turns carries roughly 2 months of inventory. At 3x turns, they're carrying 4 months. The extra inventory costs 5-10% of its value in carrying costs.
| Inventory Turns | Months on Hand | Carrying Cost Impact |
|---|---|---|
| 8x | 1.5 months | Baseline |
| 6x | 2 months | +2-3% of inventory value |
| 4x | 3 months | +5-7% of inventory value |
| 3x | 4 months | +8-10% of inventory value |
Elite distributors manage turns aggressively. They discontinue slow movers, negotiate supplier returns, and avoid overstocking for speculative demand.
Calculating Distributor Margin: A Worked Example
A $45M industrial distributor wants to understand their margin structure. Here's how the analysis works.
Revenue and cost data:
- Annual revenue: $45,000,000
- Cost of goods sold: $33,750,000
- Operating expenses: $9,450,000
- Interest expense: $350,000
- Taxes: $580,000
Margin calculations:
Gross Profit = $45,000,000 - $33,750,000 = $11,250,000
Gross Margin = $11,250,000 / $45,000,000 = 25.0%
Operating Profit = $11,250,000 - $9,450,000 = $1,800,000
Operating Margin = $1,800,000 / $45,000,000 = 4.0%
Net Profit = $1,800,000 - $350,000 - $580,000 = $870,000
Net Margin = $870,000 / $45,000,000 = 1.9%
This distributor falls in typical ranges for gross margin (25%) but below average for operating (4%) and net (1.9%) margin. Operating expenses are consuming too much of the gross profit.
The operating expense breakdown:
| Category | Amount | % of Revenue |
|---|---|---|
| Warehouse/facilities | $2,250,000 | 5.0% |
| Transportation | $1,800,000 | 4.0% |
| Sales compensation | $2,700,000 | 6.0% |
| G&A | $2,700,000 | 6.0% |
| Total | $9,450,000 | 21.0% |
Sales compensation at 6% and G&A at 6% are both high. Industry benchmarks suggest 4-5% for each. Bringing those into line would add $1-2M to operating profit, pushing operating margin from 4% toward 6-7%.
Margin vs. Markup: A Common Confusion
Distributors often confuse margin and markup. They're related but different numbers.
Markup is the percentage added to cost to determine selling price.
Margin is profit as a percentage of selling price.
Markup = (Selling Price - Cost) / Cost x 100
Margin = (Selling Price - Cost) / Selling Price x 100
A product costing $80 and selling for $100:
- Markup = ($100 - $80) / $80 = 25%
- Margin = ($100 - $80) / $100 = 20%
The same $20 profit, but different percentages depending on whether you divide by cost or selling price.
Common conversions:
| Markup | Margin |
|---|---|
| 20% | 16.7% |
| 25% | 20.0% |
| 33% | 25.0% |
| 50% | 33.3% |
When a supplier says "distributors typically mark up 25%," they mean a 20% margin. When your finance team says "we need 25% margin," they mean a 33% markup. Clarify which number you're discussing.
Where to Find Your Hidden Margin
Based on pricing analysis across mid-market distributors, the same issues appear repeatedly:
Customer pricing inconsistency (1-3% of revenue): Similar customers paying different prices for the same products. Deals negotiated years ago never reviewed. Prices that don't reflect current costs.
Freight and delivery recovery (0.5-2% of revenue): Absorbing shipping costs on orders that don't warrant free delivery. Fuel surcharges not passed through. Delivery minimums not enforced.
Rebate program underperformance (0.5-1.5% of revenue): Missing volume tier thresholds by small amounts. Failing to claim earned co-op or marketing funds. Not optimizing purchase timing around rebate periods.
Payment terms cost (0.3-1% of revenue): Slow-paying customers not charged for the cost of carrying their receivables. 60-day and 90-day terms given without price adjustment.
Product mix margin erosion (variable): Sales team pushing low-margin products that are easy to sell. High-margin products not actively promoted.
For a $50M distributor, these issues commonly add up to $1.5-3M in recoverable margin. That's real profit hiding in transaction-level details.
The Bottom Line on Distributor Margins
Distribution is a thin-margin business by design. The model works on volume and velocity, not fat percentages.
Typical ranges:
- Gross margin: 20-30%
- Operating margin: 3-8%
- Net margin: 2-5%
Elite distributors outperform these ranges through pricing discipline, cost-to-serve awareness, rebate optimization, and inventory management. The difference between average and elite performance is 4-6 points of operating margin, or 2-3x the profit on the same revenue.
If your margins fall below these benchmarks, the opportunity is in the details: inconsistent pricing, untracked costs, and margin leakage at the transaction level.
For the complete picture of how to analyze and improve margins, see our complete guide to margin analysis.
Last updated: Invalid Date
Frequently Asked Questions

Want to analyze your entire product catalog?
Pryse automatically identifies margin leakage across thousands of SKUs. Upload your data and find hidden profit in 24 hours.
One-time $1,499 diagnostic. No subscription required.