Distribution Pricing: Definition, Models, and How Distributors Set Prices
Distribution pricing is the system distributors use to set sell prices from supplier cost to customer invoice. Models, benchmarks, and margin math explained.
Distribution pricing is the system a wholesale distributor uses to determine sell prices for products purchased from manufacturers and resold to business customers. It covers every decision between a supplier's cost sheet and the price on a customer's invoice -- markups, discount structures, contract terms, rebates, and freight charges included.
Unlike retail, where a product has one price on the shelf, distribution pricing is inherently variable. The same SKU might sell at 50 different price points depending on the customer, order size, contract terms, and the sales rep who quoted it. A mid-market distributor with 30,000 SKUs and 2,000 active customers isn't managing one price list. They're managing millions of price decisions.
That complexity is what makes distribution pricing both the biggest profit lever and the biggest source of margin leakage in the industry. McKinsey's analysis of 130 publicly traded distributors found that a 1% price increase yields a 22% increase in EBITDA (McKinsey, "Pricing: Distributors' Most Powerful Value-Creation Lever," 2019). To get the same bottom-line impact from volume growth alone, you'd need to grow 5.9% while holding operating costs flat. Pricing isn't just one lever among many. It's the lever.
For the complete strategic framework, see our distribution pricing guide.
What Distribution Pricing Actually Involves
When people search for a distribution pricing definition, they're usually after one of two things: a textbook explanation of channel economics, or practical guidance on how distributors set prices day-to-day.
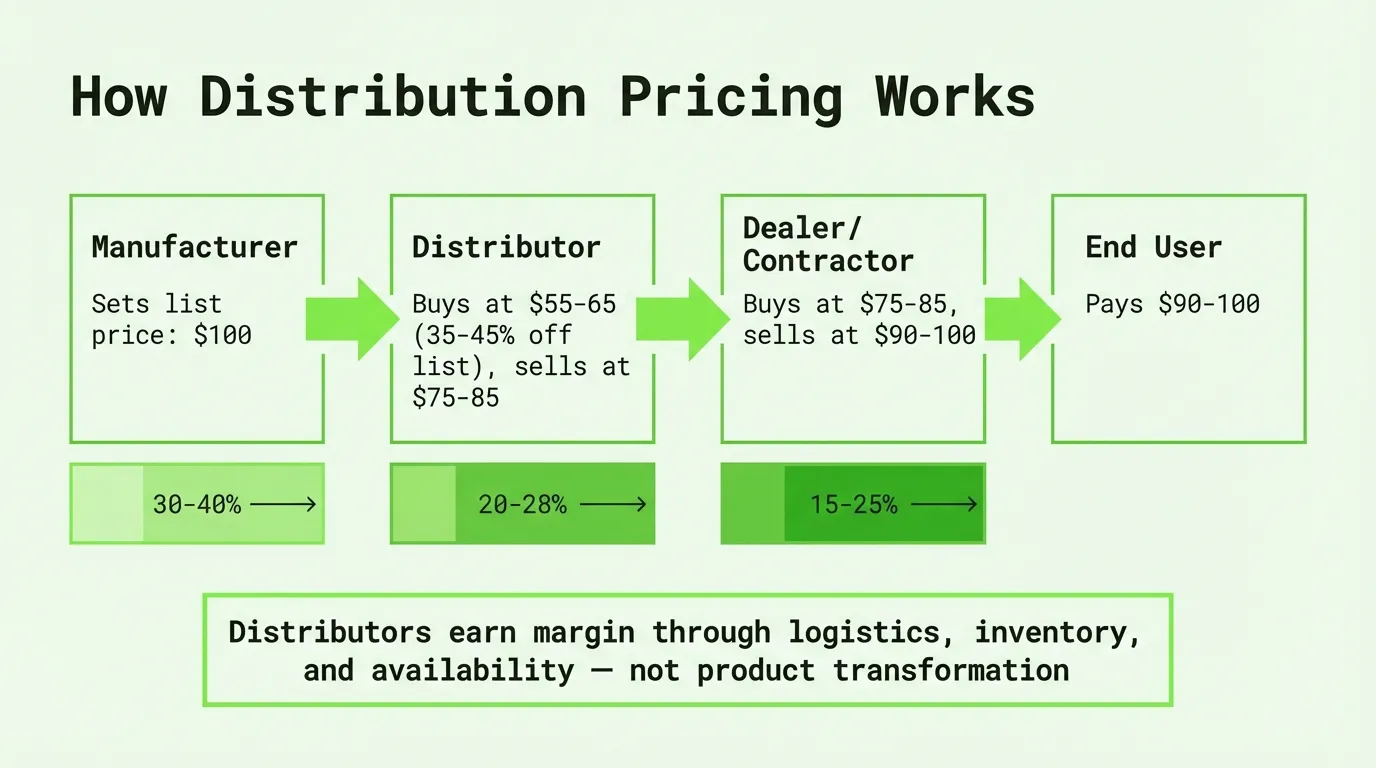
The textbook answer is simple. Distribution pricing sits between manufacturer cost and end-user price. Manufacturers sell to distributors at one price, distributors add a margin, and they sell to contractors, fabricators, or other businesses at a higher price. The distributor's margin covers warehousing, delivery, sales, credit, and everything else required to move products from Point A to Point B.
The practical reality at a $50M-$150M distributor is messier:
A base pricing structure that starts with supplier cost and applies markup rules. This lives in your ERP -- could be a flat cost-plus percentage, a margin target by product group, or a price matrix that varies by customer tier.
Customer-specific overrides layered on top. Negotiated prices for individual accounts, typically documented in contracts or special pricing agreements (SPAs). A mid-market distributor has thousands of these records sitting in their ERP.
Volume-based adjustments that change pricing at certain quantity thresholds. Buy 100 units, get one price. Buy 1,000, get another.
Promotional and project pricing for time-limited deals or competitive bids. These often bypass the standard pricing structure entirely.
Rebates and allowances that flow back from manufacturers based on purchase volume, growth targets, or marketing commitments. These reduce the distributor's effective cost but often don't show up in transaction-level margin reporting.
Freight and delivery charges that may or may not get billed to the customer. The gap between freight cost incurred and freight cost billed is a real margin variable.
All of these pieces interact. A customer might be on a matrix price, with a contract override on certain product lines, a volume tier that kicked in last quarter, and a project bid that a sales rep entered manually. The ERP applies them in sequence, and the resulting pocket price can land far from what anyone intended.
The Four Core Distribution Pricing Models
Most distributors run a combination of these four models. They aren't mutually exclusive. The ERP checks for pricing in a defined hierarchy -- typically starting with customer-specific contracts and falling back to matrix or cost-plus when no specific agreement exists.
Cost-Plus Pricing
Cost-plus sets the sell price by adding a fixed markup percentage to the product's acquisition cost.
Sell Price = Cost x (1 + Markup %)
A product that costs $80 with a 25% markup sells for $100. That's a 20% gross margin.
Cost-plus is the default starting point for most distributors. It's easy to implement, easy for reps to explain, and easy to maintain when costs change. Many distribution ERPs use cost-plus as the fallback pricing method when no other rule applies.
The weakness: it ignores what the market will bear. A commodity fastener with five local competitors can't support a 30% markup. A specialty valve with two-week lead times from the next-closest source might support 50%. Cost-plus treats them identically.
For more on the mechanics and trade-offs, see our cost-plus pricing strategy breakdown.
Matrix Pricing
Matrix pricing is the workhorse model in distribution. It assigns prices based on two variables: a customer classification (tier) and a product grouping (category, line, or vendor).
| Product Group A | Product Group B | Product Group C | |
|---|---|---|---|
| Tier 1 (Top accounts) | Cost + 22% | Cost + 18% | Cost + 30% |
| Tier 2 (Mid accounts) | Cost + 28% | Cost + 24% | Cost + 36% |
| Tier 3 (Small accounts) | Cost + 35% | Cost + 30% | Cost + 42% |
A Tier 1 customer buying from Product Group B gets an 18% markup. A Tier 3 customer buying the same product pays 30%. The matrix lets you differentiate pricing by customer value and product profitability without negotiating every transaction individually.
Every major distribution ERP -- Eclipse, Prophet 21, SAP Business One, D365, NetSuite -- supports matrix pricing. The implementation details vary, but the concept is the same: customer class meets product class at an intersection that determines the price.
A well-maintained matrix with 5 customer tiers and 20 product groups gives you 100 pricing decisions to manage instead of 60 million. That's the appeal. The problem is that most distributors build a matrix once and let it drift for years.
Customer-Specific Pricing
Customer-specific pricing (also called special pricing agreements, SPAs, or contract pricing) sets unique prices for individual customers on specific products or product lines. These are the negotiated deals that live outside the matrix.
In most ERPs, customer-specific pricing sits at the top of the pricing hierarchy. When a customer orders, the system checks for a contract price first. If one exists, it overrides the matrix. If not, the system falls back to cost-plus.
Customer-specific pricing exists because distribution is relationship-driven. Your top 50 accounts generate 60-70% of your revenue. They expect pricing that reflects their volume and loyalty. That's reasonable. The problem is maintenance.
NAW (National Association of Wholesaler-Distributors) research shows that most distributors leave at least 2 percentage points of gross margin on the table through pricing inconsistency. A big chunk of that comes from customer-specific pricing that nobody reviews. The deal you gave a contractor when they were doing $400K per year is still active now that they're at $120K. The contract from 2022 hasn't been updated despite three rounds of supplier cost increases.
In mid-market distributor data, 15-30% of customer-specific price records are stale -- the conditions that justified the pricing no longer exist. On a $75M distributor, that's typically $375K-$1.1M per year in leaked margin.
Market-Based Pricing
Market-based pricing sets sell prices relative to competitors rather than starting from cost. It's less common as a standalone model, but it heavily influences the other three.
In practice, market-based pricing surfaces when a sales rep says "we need to be at $X to win this." The $X comes from a competitor's quote, not a markup calculation. The rep enters an override, and the transaction ships at a margin the market determined.
For commodity products where customers can switch easily, market-based pricing is unavoidable. You can build whatever margin targets you want into your matrix, but if three other distributors stock the same product at $95, your $105 price loses the order.
Market-based pricing works when you have good competitive intelligence. It breaks down when reps use "the competitor is cheaper" as a blanket justification for discounting -- which they will unless you require documentation.
How the Pricing Hierarchy Works in Practice
Here's how pricing resolves at a typical mid-market distributor:
- A customer orders 200 units of SKU #4429
- The ERP checks for a customer-specific contract price -- finds one at $14.20/unit, set 18 months ago
- It also checks the matrix: this customer is Tier 2, this product is Group B -- matrix price would be $15.80
- The contract price wins, so the order ships at $14.20
- Current cost on SKU #4429 is $12.50 (it was $11.00 when the contract was written)
- Invoice margin: 16.1% -- well below the 24% the matrix would have produced
Nobody made an error. The system did exactly what it was configured to do. The contract was valid. The price was honored. And the distributor shipped product at a margin that doesn't cover cost-to-serve.
This is why distribution pricing isn't just about choosing a model. It's about maintaining the model across tens of thousands of SKU-customer combinations, updating it when costs change, and reviewing it when customer behavior shifts. The model itself is straightforward. Execution at scale is where things break.
Distribution Pricing Benchmarks
What should these models produce in terms of margins? Here's where distributor margins land, based on NAW data and industry reporting from Modern Distribution Management (MDM).
| Metric | Range | Notes |
|---|---|---|
| Distributor markup | 20-40% | 15-20% for commodities, 35-50% for specialty |
| Gross margin | 20-30% | Equivalent to 25-43% markup |
| Operating margin (EBITDA) | 3-8% | Average is ~4%; elite distributors hit 8-12% (NAW) |
| Net margin | 2-5% | After all expenses, interest, and taxes |
The gap between average and elite distributors is wide. NAW data puts average distributors at roughly 4% EBITDA while top performers reach 8-12% on similar revenue. SPARXiQ's research found that 30-50% of a typical distributor's customers actually destroy value -- they cost more to serve than they generate in margin. The pricing model doesn't create that problem, but an undisciplined model lets it persist.
For a deeper look at these numbers by vertical, see our distributor margins breakdown.
Benchmarks by Distribution Vertical
| Vertical | Gross Margin | Operating Margin | Primary Margin Risk |
|---|---|---|---|
| Electrical | 22-28% | 3-6% | Commodity cost swings, project bid leakage |
| Industrial MRO | 28-35% | 5-10% | Discount stacking, customer-specific drift |
| Building materials | 18-25% | 4-7% | Freight absorption, cost pass-through lag |
| HVAC | 24-32% | 5-8% | Equipment vs. parts margin split, service giveaways |
If your overall gross margin sits below 20%, either your pricing model needs work, you're in a commodity-heavy segment, or you've got leakage. Above 30% means you're in specialty distribution or your customer-specific pricing is tighter than average.
Where Distribution Pricing Goes Wrong
Distribution pricing doesn't fail because companies pick the wrong model. It fails because the right model degrades over time. These patterns show up consistently across mid-market distributors.
Customer-specific pricing outlasts its justification. That contract price made sense when the customer did $500K a year. They're at $200K now. The pricing didn't change. Multiply across hundreds of accounts and you've got systematic margin erosion that nobody notices because each individual contract looks fine in isolation.
Cost increases don't flow through fast enough. Your supplier raises prices March 1. Your list prices update March 10. Your customer contracts don't update until April. For six weeks, every affected transaction ships at compressed margin. SPARXiQ identified cost pass-through lag as one of three key price leakage points, each capable of producing a 100 basis point drop in EBIT.
Discounts stack in ways nobody tracks. A customer has a tier discount, a product-line discount, a volume rebate, and a project bid price hitting the same transaction. Each one was approved individually. Together they compound:
Effective Discount = 1 - (0.90 x 0.92 x 0.95 x 0.98) = 1 - 0.7706 = 22.9%
On a 25% gross margin business, that transaction runs at 2.1% gross margin. Below breakeven after cost-to-serve.
Off-invoice costs stay invisible. Freight, early payment discounts, rebate credits, and returns happen after the invoice. Most distributor ERP setups report margin at the invoice level. The gap between invoice margin and pocket margin can run 3-8 points. McKinsey found pocket price runs 20-30% below invoice price for many B2B companies (McKinsey, "The Power of Pricing"). For the full framework on this gap, see our pocket price waterfall explainer.
How to Evaluate Your Distribution Pricing
You don't need a six-figure pricing tool to diagnose where your model works and where it's breaking down. You need ERP transaction data and a structured way to look at it.
Step 1: Map Your Pricing Hierarchy
Document how your ERP resolves prices. What's the lookup sequence? Which method wins when multiple rules apply? Where can users override? This exercise alone often surfaces gaps: product groups that were never added to the matrix, customer tiers that haven't been updated in years, entire product lines running on cost-plus because nobody built out the matrix.
Step 2: Calculate Margin by Segment
Pull 12 months of transaction data. Calculate invoice margin for each line item. Then segment:
- By customer tier -- are Tier 2 customers getting better prices than Tier 1 in certain product groups?
- By sales rep -- does one rep consistently run 3 points below the team average?
- By product category -- are commodity products subsidizing specialty products, or the reverse?
- By branch -- location-level variance often signals local discounting patterns
Step 3: Audit Customer-Specific Pricing
Compare each customer's current volume against the volume that justified their pricing tier. Flag accounts where volume dropped 25% or more.
Stale Pricing Indicator = (Volume at Contract Signing - Current Volume) / Volume at Contract Signing
Anything above 25% decline warrants a pricing conversation. Above 50% should trigger a pricing reset. This single analysis typically flags 15-30% of contract records.
Step 4: Build a Pocket Price View
For your top 50 accounts, calculate the true pocket price:
Pocket Price = Invoice Price - Freight Absorbed - Early Pay Discounts - Rebates - Returns - Credits
Pocket Margin = (Pocket Price - Cost) / Pocket Price
The gap between invoice margin and pocket margin is your leakage rate. Most distributors find a 3-8 point gap the first time they run this. For a $75M distributor at 4% EBITDA ($3M), recovering even 1% of revenue from pricing improvements ($750K) increases EBITDA by 25%. Same customers, same products, same headcount.
For step-by-step guidance on running this analysis, see our price waterfall analysis guide.
Distribution Pricing vs. Other Pricing Types
If you're coming from a different industry, here's how distribution pricing compares.
| Distribution | Retail | Manufacturing (Direct) | SaaS | |
|---|---|---|---|---|
| Price variability | High (50+ prices per SKU) | Low (1 price per SKU) | Medium (contract-based) | Low (tiered plans) |
| Negotiation | Common, expected | Rare | Common | Rare at SMB |
| Typical gross margin | 20-30% | 35-50% | 25-45% | 70-85% |
| Pricing managed in | ERP + spreadsheets | POS/ecommerce | ERP/CPQ | Billing platform |
| Biggest risk | Inconsistency at scale | Competitive pressure | Contract underpricing | Churn |
The defining characteristic of distribution pricing is the sheer number of pricing decisions. A manufacturer might have 5,000 SKUs and 200 contracts. A SaaS company has 3 pricing tiers. A distributor has 30,000 SKUs, 2,000 customers, and a pricing hierarchy that produces a different effective price for almost every combination.
That scale is why pricing discipline matters more in distribution than almost anywhere else. Small systematic errors compound across millions of transactions. NAW's research consistently shows that the gap between average and elite distributor profitability -- roughly 4% vs. 8-12% EBITDA -- comes down to pricing execution more than any other single factor.
MDM's 2025 pricing survey found that 48% of distributors are actively implementing new pricing models, and 99% of large distributors (500+ employees) plan to hire more people focused on pricing (MDM, 2025). The industry is waking up to how much money sits in better pricing execution. The question for most mid-market distributors isn't whether to invest in pricing discipline, but where to start.
The answer is almost always the same: start with visibility. Pull your transaction data. See what you're actually charging. Find the gaps between what your pricing model says and what your customers actually pay. That's where the margin is hiding.
Frequently Asked Questions
What is distribution pricing?
Distribution pricing is the system a wholesale distributor uses to set sell prices for products purchased from manufacturers and resold to business customers. It includes the pricing models (cost-plus, matrix, customer-specific, market-based), the discount and rebate structures layered on top, and the freight and service charges that affect the final pocket price. It's uniquely complex because distributors manage thousands of SKUs across thousands of customers, with each combination potentially carrying a different negotiated price.
What are the main distribution pricing models?
The four core models are cost-plus (adding a fixed markup percentage to product cost), matrix pricing (setting prices at the intersection of customer tier and product group), customer-specific pricing (negotiated rates for individual accounts documented as contracts or SPAs), and market-based pricing (setting prices relative to competitor quotes). Most distributors use all four simultaneously, with the ERP applying them in a hierarchy where customer-specific pricing overrides the matrix, and the matrix overrides cost-plus as the fallback.
What is a typical distributor markup?
Markups range from 20-40% for general wholesale distribution. Commodity products like basic electrical supplies or bulk fasteners run 15-20%. General wholesale products land at 20-30%. Specialty or technical products with limited competition can support 35-50%. These markups produce gross margins of approximately 17-33%. After operating expenses consume 16-25% of revenue, most distributors net 2-5%.
How is distribution pricing different from retail pricing?
Retail pricing is fixed and public -- one price tag, every customer pays it. Distribution pricing is negotiated, variable, and private. A distributor might sell the same product at $14 to one customer and $19 to another, and both prices are correct based on the customer's volume, contract terms, and tier. Distribution pricing also involves more post-sale adjustments -- rebates, freight credits, early payment discounts -- that reduce the realized pocket price below the invoice price.
Why do distributors leave margin on the table?
Three structural reasons. First, the sheer number of pricing decisions overwhelms manual management -- no team can regularly review every price point across 30,000 SKUs and 2,000 customers. Second, customer-specific pricing degrades as volumes change but contracted prices don't. Third, the gap between invoice price and pocket price (after freight, rebates, discounts, and returns) is invisible in most standard ERP reporting. NAW research indicates distributors typically leave at least 2 percentage points of gross margin uncaptured. SPARXiQ puts the recoverable opportunity at 2-4% of revenue for most distributors.
Last updated: Invalid Date
Frequently Asked Questions

Want to analyze your entire product catalog?
Pryse automatically identifies margin leakage across thousands of SKUs. Upload your data and find hidden profit in 24 hours.
One-time $1,499 diagnostic. No subscription required.