Distributor Margin Calculator: Formulas, Examples, and Quick Reference
Calculate distributor margin with step-by-step formulas. Includes worked examples, margin-to-markup conversion table, and benchmarks by distribution vertical.
Distributor margin is the percentage of the selling price that a wholesale distributor retains as gross profit after subtracting the cost of goods purchased from suppliers.
The core formula:
Distributor Margin % = (Selling Price - Cost of Goods) / Selling Price x 100That's it. Everything else in this post is about applying this formula correctly, converting between margin and markup, and knowing what numbers to expect for your vertical.
How to Calculate Distributor Margin: Step by Step
The calculation takes three inputs: selling price, purchase cost, and (optionally) additional direct costs like inbound freight.
Basic Margin Calculation
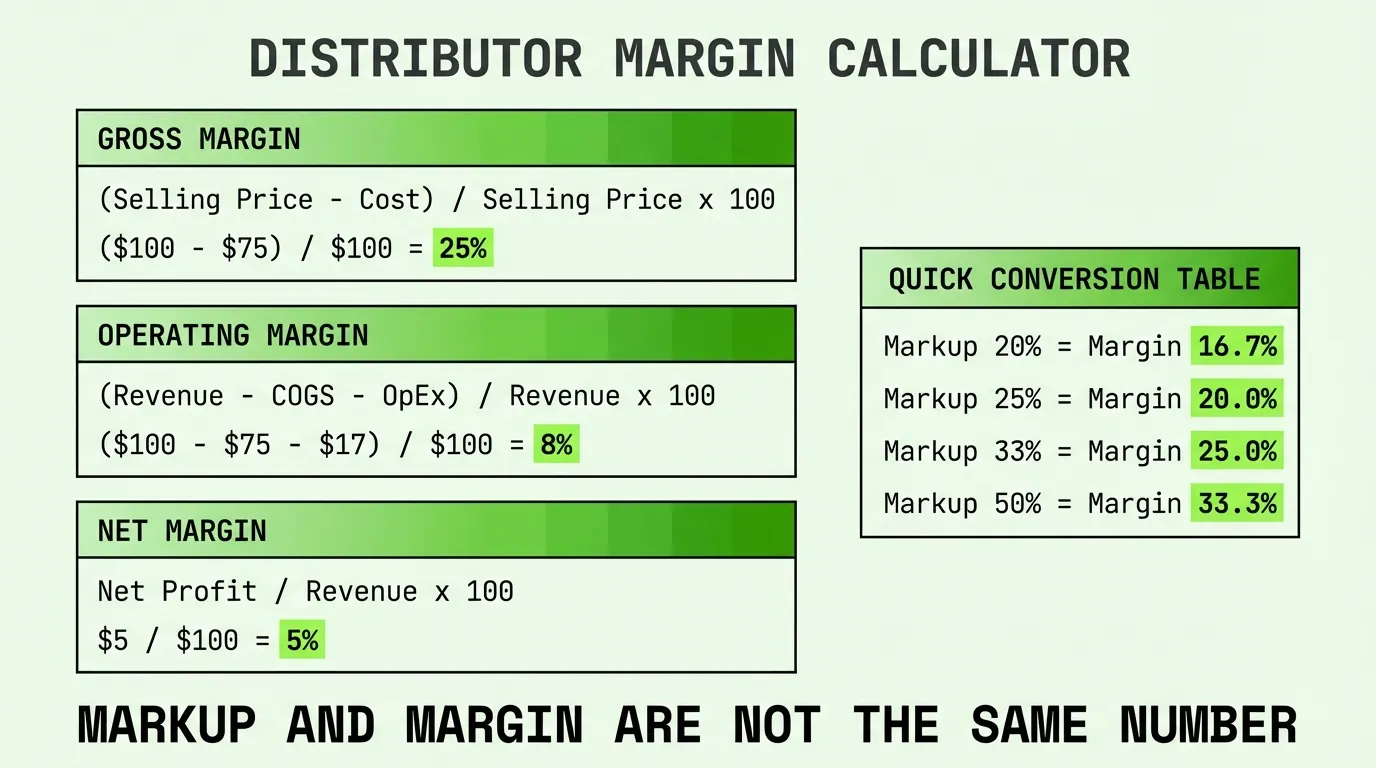
Margin % = (Selling Price - Purchase Price) / Selling Price x 100Example: You buy a case of fasteners from the manufacturer for $75 and sell it to a contractor for $100.
($100 - $75) / $100 = $25 / $100 = 0.25 = 25%Your distributor margin on that transaction is 25%.
Including Landed Costs
Real margin calculations should include the full landed cost, not just the invoice price from your supplier. Landed cost adds inbound freight, handling, and any other direct costs to get the product on your shelf.
True Margin % = (Selling Price - Landed Cost) / Selling Price x 100Example: Same fasteners at $75, but you pay $4 in freight and $1 in handling per case.
Landed Cost = $75 + $4 + $1 = $80($100 - $80) / $100 = $20 / $100 = 0.20 = 20%Your margin drops from 25% to 20% once you account for landed costs. That 5-point gap is real money. A distributor moving 10,000 cases per year just found $50,000 in hidden cost that their basic margin calculation missed.
Margin in Dollars vs. Percentage
Both matter. Percentage tells you efficiency. Dollars tell you what you can spend.
Margin Dollars = Selling Price - Cost of GoodsMargin % = Margin Dollars / Selling Price x 100A $5 margin on a $20 item (25%) and a $50 margin on a $500 item (10%) look different as percentages. But the $500 item generates 10x the margin dollars per unit. When evaluating your product mix, don't ignore lower-percentage items that throw off more absolute profit.
Margin vs. Markup: The Conversion That Trips Up Every Pricing Team
Margin and markup calculate the same profit dollars using different denominators. Confusing them costs real money across thousands of SKUs. For a deeper breakdown, see our markup to margin calculator.
Margin = (Selling Price - Cost) / Selling PriceMarkup = (Selling Price - Cost) / CostSame transaction, different numbers. A product at $80 cost, $100 selling price:
- Margin = $20 / $100 = 20%
- Markup = $20 / $80 = 25%
When your sales team says "we sell at a 25% markup" and your finance team hears "25% margin," that's a 5-point disconnect. On $50M in revenue, the gap between 25% margin and 20% margin (what a 25% markup actually produces) is $2.5M.
Conversion Formulas
To convert between the two:
Margin % = Markup % / (100% + Markup %)Markup % = Margin % / (100% - Margin %)Example: Your catalog uses 30% markup. What margin does that produce?
30 / (100 + 30) = 30 / 130 = 0.231 = 23.1%That 30% markup generates 23.1% margin. Not 30%.
Margin-to-Markup Quick Reference Table
| Markup % | Margin % | Cost Multiplier |
|---|---|---|
| 10% | 9.1% | 1.10x |
| 15% | 13.0% | 1.15x |
| 20% | 16.7% | 1.20x |
| 25% | 20.0% | 1.25x |
| 30% | 23.1% | 1.30x |
| 33.3% | 25.0% | 1.33x |
| 40% | 28.6% | 1.40x |
| 50% | 33.3% | 1.50x |
| 75% | 42.9% | 1.75x |
| 100% | 50.0% | 2.00x |
The cost multiplier is what you multiply your purchase cost by to get the selling price. If you're working with a 1.25x multiplier, that's a 25% markup and a 20% margin.
Distributor Margin Benchmarks by Vertical
What margin should you expect? It depends on what you distribute. Here are typical gross margin ranges based on distribution vertical.
| Distribution Vertical | Typical Gross Margin | Typical Net Margin |
|---|---|---|
| Food/beverage wholesale | 15-22% | 1-3% |
| Commodity/bulk | 15-20% | 1-3% |
| Electrical distribution | 22-28% | 2-4% |
| General industrial | 22-32% | 3-7% |
| Building materials | 23-28% | 2-5% |
| HVAC | 25-35% | 3-6% |
| Specialty/technical | 25-35% | 3-7% |
| Value-added services | 30-40% | 4-8% |
According to Aswath Damodaran's industry dataset at NYU Stern (January 2025), retail distributors average 6.05% net margin and food wholesalers average just 1.17% net margin. Building materials distributors land around 7.42% at the higher end.
The Exporteers distribution margin database reports distributor margins from 3% for high-volume electronics to 30%+ for specialty goods like furniture and jewelry. Not all margin is profit though. Freight, storage, financing, and overhead eat into that spread.
For more detailed benchmarks across verticals, see our breakdown of distributor margins by industry.
Worked Example: Full Margin Analysis for an Industrial Distributor
Let's walk through a complete margin calculation for a mid-market industrial distributor. This is the kind of analysis you'd run on your own numbers.
Company profile:
- Annual revenue: $35,000,000
- 8,500 active SKUs
- 420 active customers
Revenue and cost data:
| Line Item | Amount |
|---|---|
| Revenue | $35,000,000 |
| Cost of goods sold | $25,900,000 |
| Operating expenses | $7,700,000 |
| Interest expense | $280,000 |
| Taxes | $448,000 |
Step 1: Gross margin
Gross Profit = $35,000,000 - $25,900,000 = $9,100,000
Gross Margin = $9,100,000 / $35,000,000 = 26.0%
At 26%, this distributor is squarely in the middle of the industrial distribution range (22-32%).
Step 2: Operating margin
Operating Profit = $9,100,000 - $7,700,000 = $1,400,000
Operating Margin = $1,400,000 / $35,000,000 = 4.0%
4.0% operating margin is the industry average, according to NAW (National Association of Wholesaler-Distributors). There's room to improve.
Step 3: Net margin
Net Profit = $1,400,000 - $280,000 - $448,000 = $672,000
Net Margin = $672,000 / $35,000,000 = 1.9%
1.9% net is below the typical 2-5% range. This distributor is generating adequate gross margin but losing too much to operating costs and below-the-line items.
Where to look: The operating expense ratio (22.0% of revenue) is high for a $35M distributor. Industry benchmarks from NAW suggest 18-20% is a more typical target. Bringing OpEx down to 20% would add $700,000 to the bottom line, nearly doubling net profit.
Calculating Margin on Individual Transactions
Company-level margins are useful for benchmarking. But the real diagnostic value is in transaction-level margin analysis, where you calculate margin on every line of every invoice.
Here's why: your company might average 26% gross margin, but individual transactions range from negative margin (yes, you're selling some products below cost) to 50%+. The average hides the extremes.
Transaction example:
| Product A | Product B | Product C | |
|---|---|---|---|
| Selling price | $48.00 | $48.00 | $48.00 |
| Landed cost | $31.20 | $39.84 | $50.40 |
| Margin $ | $16.80 | $8.16 | -$2.40 |
| Margin % | 35.0% | 17.0% | -5.0% |
Three products at the same selling price with wildly different margins. Product C is sold below landed cost. Your aggregate 26% margin masks this entirely.
This is the kind of line-level analysis that surfaces margin leakage. A distributor with 20,000 invoice lines per month can't eyeball this in Excel. But it's exactly where the money hides.
Common Margin Calculation Mistakes
Mistake 1: Using Invoice Cost Instead of Landed Cost
Your supplier invoice says $75. But you paid $4 freight, $1 handling, and you're carrying that inventory for 45 days at a capital cost of $0.50. Your true cost is $80.50, not $75. Every margin calculation using invoice cost overstates your actual margin.
Mistake 2: Ignoring Rebates and Discounts
Supplier rebates can add 2-5% to your effective margin. But only if you include them in your margin calculation. If you earn a 3% back-end rebate on a product line, your effective cost is 3% lower than the invoice price. Leaving rebates out of the calculation understates your true margin on those products.
The flip side: customer discounts and off-invoice deductions reduce margin. A 2% prompt-pay discount you offer means your effective selling price is 2% lower.
Mistake 3: Confusing Margin and Markup in Pricing Formulas
If your ERP pricing formula targets 25% margin but someone entered it as a 25% markup, every price in that product category is wrong. A 25% markup produces only 20% margin. Across thousands of SKUs, that's a systematic 5-point shortfall.
Mistake 4: Calculating Blended Margin Without Weighting
Averaging the margin percentages of your top products doesn't give you your actual margin. You need to weight by revenue.
Example: Product A has 35% margin on $500K revenue. Product B has 15% margin on $2M revenue.
Simple average: (35% + 15%) / 2 = 25%. Wrong.
Weighted Margin = ($500K x 35% + $2M x 15%) / ($500K + $2M)
= ($175K + $300K) / $2.5M = $475K / $2.5M = 19.0%
The actual blended margin is 19%, not 25%. Product B's volume dominates the mix.
From Margin Calculation to Margin Improvement
Knowing your margin number is the starting point. Improving it requires looking at where margin leaks out of the business. For distributors, the most common sources of margin leakage are:
- Customer pricing inconsistency: Similar customers paying different prices for identical products, with no cost-to-serve justification. This alone accounts for 1-3 points of margin for most distributors.
- Stale pricing: Cost increases from suppliers that weren't passed through. If your vendor raised prices 4% and you haven't updated customer pricing in 8 months, you've given away 4 points of margin on every affected SKU.
- Below-cost transactions: Products sold below landed cost, often because freight or handling costs weren't factored into the price. Most distributors have 3-8% of transactions running at negative margin without realizing it.
- Discount accumulation: Multiple discounts stacking (volume discount + prompt pay + loyalty rebate + freight absorption) that individually seem reasonable but collectively erode margin below acceptable levels.
For a $35M distributor, fixing these issues typically recovers $500K-$1.5M in annual margin. That's the difference between a 1.9% net margin and a 4-5% net margin.
Our guide to distribution pricing covers pricing strategy for distributors in depth, and we've written specifically about margin analysis methods for identifying these gaps.
The Quick Reference
If you only bookmark one section, make it this one.
Core formula:
Distributor Margin % = (Selling Price - Cost) / Selling Price x 100Conversions:
Markup to Margin: Margin % = Markup % / (100% + Markup %)
Margin to Markup: Markup % = Margin % / (100% - Margin %)
Typical distributor gross margins: 20-30% (varies by vertical)
Typical distributor net margins: 2-5%
Rule of thumb: Your markup percentage will always be higher than the margin percentage for the same dollar profit. A 25% markup is a 20% margin. A 50% markup is a 33.3% margin.
If you're running these calculations across thousands of SKUs and customers in Excel, you already know how tedious it gets. Pryse runs margin analysis automatically on your transaction data, flagging the specific products, customers, and transactions where margin is leaking. It takes 24 hours, not 6 months.
Last updated: Invalid Date
Frequently Asked Questions

Want to analyze your entire product catalog?
Pryse automatically identifies margin leakage across thousands of SKUs. Upload your data and find hidden profit in 24 hours.
One-time $1,499 diagnostic. No subscription required.