Electrical Distribution Pricing: How Electrical Distributors Set and Manage Prices
How electrical distributors price products using multipliers, list prices, and customer-specific agreements. Margin benchmarks, category differences, and leakage fixes.
Electrical distribution pricing is the system of multipliers, customer agreements, and rebate structures that determines what an electrical distributor charges for every product it sells. It's built on manufacturer list prices, shaped by competitive pressure, and eroded by thousands of small decisions made at the branch level every day.
The U.S. electrical distribution market moved roughly $148 billion in product in 2024 (Electrical Wholesaling, 2025). Wesco, the largest player, reported 21.6% gross margin on $21.8 billion in revenue (Wesco, 2025). Graybar, the second-largest independent, posted $11.6 billion in sales with gross margins around 19-20% (Graybar, 2025). These are thin-margin businesses where pricing discipline separates the profitable from the struggling.
This post covers how electrical distributor pricing actually works, what margins look like by product category, where pricing breaks down, and what the best-run distributors do differently. For broader context on how distribution pricing works across verticals, see our distribution pricing guide.
How Electrical Distribution Pricing Works
Electrical distributors don't set prices from scratch. They work within a pricing architecture built by manufacturers, modified by customer relationships, and adjusted by market conditions.
The Multiplier System
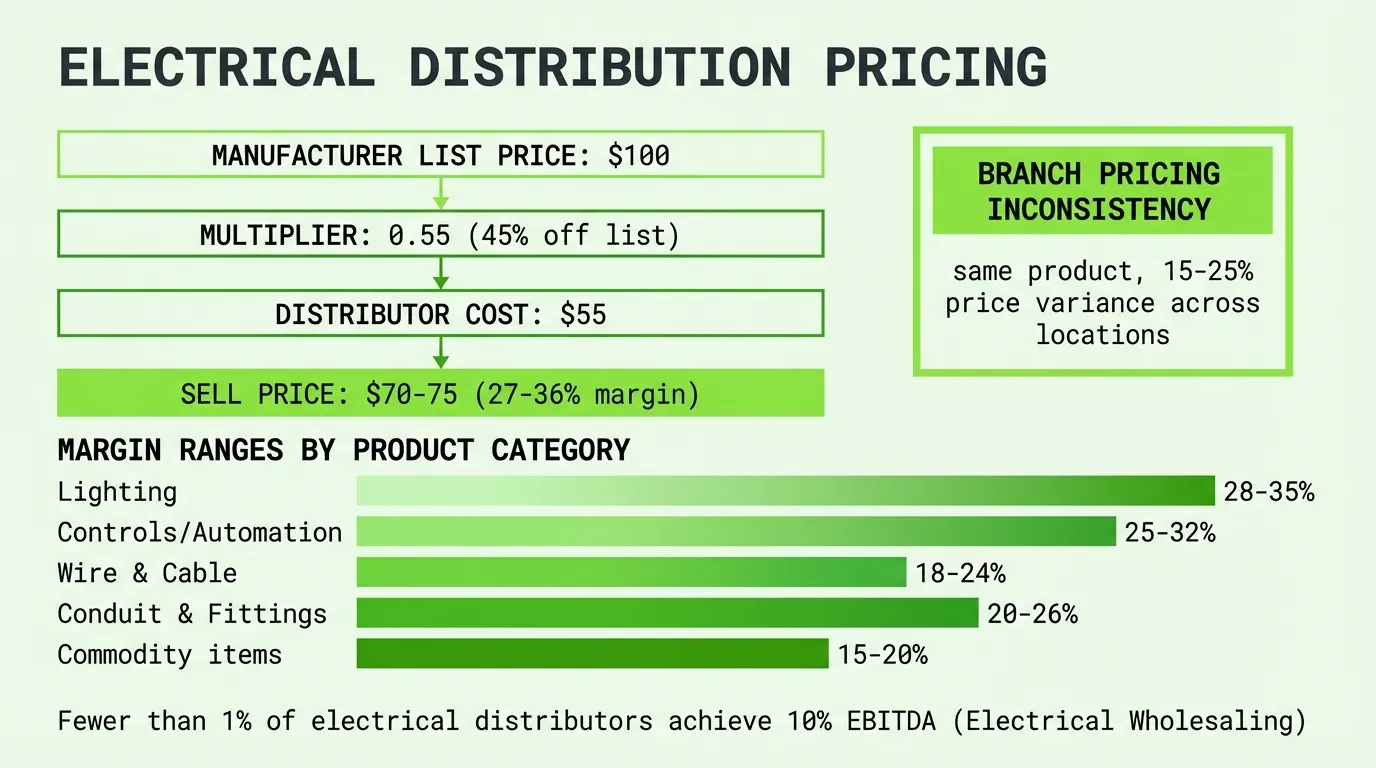
Every electrical product has a manufacturer list price. Distributors buy and sell based on multipliers applied to that list price.
There are two multipliers that matter:
- Cost multiplier: What the distributor pays. Example: 0.42 means the distributor pays 42% of list price.
- Sell multiplier: What the distributor charges. Example: 0.65 means the customer pays 65% of list price.
Distributor Cost = List Price x Cost Multiplier
Selling Price = List Price x Sell Multiplier
Gross Margin = (Sell Multiplier - Cost Multiplier) / Sell Multiplier x 100
For a product with a $100 list price, a 0.42 cost multiplier, and a 0.65 sell multiplier:
Cost = $100 x 0.42 = $42.00
Selling Price = $100 x 0.65 = $65.00
Gross Margin = ($65.00 - $42.00) / $65.00 = 35.4%
That looks like a healthy margin. But that's a single product on a single transaction. The real story is what happens to that margin across thousands of SKUs, hundreds of customers, and multiple branches.
Column Pricing
Many electrical manufacturers publish pricing in columns, sometimes called "price pages" or "pricing columns." Column 1 is typically the highest (end-user or list), and lower columns represent deeper discounts for different customer types.
| Column | Typical Customer | Discount Off List |
|---|---|---|
| Column 1 (List) | End users, walk-in | 0% |
| Column 2 | Small contractors | 10-20% |
| Column 3 (Trade) | Standard contractor pricing | 20-35% |
| Column 4 | Large contractors, bid work | 30-45% |
| Column 5+ | Distributor cost / SPAs | 40-60% |
The column a customer buys at depends on their agreement with the distributor, which depends on volume, relationship, and competitive situation.
Customer-Specific Pricing
Large contractors and OEMs don't buy at column pricing. They negotiate customer-specific agreements that might include:
- Fixed multipliers off list price for specific product families
- Cost-plus agreements where the customer pays distributor cost plus a fixed margin
- Annual contracts with tiered pricing based on volume commitments
- Project-specific pricing negotiated for individual jobs
This is where complexity explodes. A mid-market electrical distributor with 2,000 active customers might have 500+ customer-specific pricing agreements, many stored in spreadsheets or in a single rep's head.
Margin Benchmarks for Electrical Distributors
Electrical distribution margins vary by company size, product mix, and customer mix. Here's what the data shows.
Overall Margin Ranges
| Metric | Industry Average | Top Quartile |
|---|---|---|
| Gross margin | 20-23% | 24-28% |
| Operating margin | 3-5% | 6-8% |
| Net margin | 2-3.5% | 4-6% |
| EBITDA | 4-6% | 8-10% |
According to the NAED PAR Report, the typical electrical distributor reported a 3.7% net profit margin on 5.2% sales growth in its most recent benchmarking cycle (NAED, 2019). Fewer than 1% of electrical distributors have reached 10% EBITDA (Electrical Wholesaling, 2023).
Public Company Benchmarks
The publicly traded and large private electrical distributors provide useful reference points:
| Company | 2024 Revenue | Gross Margin | Operating Margin |
|---|---|---|---|
| Wesco International | $21.8B | 21.6% | 5.6% |
| Graybar Electric | $11.6B | ~19.4% | ~5.5% |
Wesco's gross margin held flat at 21.6% in 2024, while operating margin dipped 70 basis points to 5.6% (Wesco, 2025). Graybar's average gross margin declined from 20% to 19.4% by Q3 2025, reflecting competitive pricing pressure (Graybar, 2025).
These numbers represent the largest players. Smaller independents with less commodity-heavy product mixes often run 2-5 points higher on gross margin, but they carry higher SG&A costs as a percentage of revenue.
Margins by Product Category
Not all electrical products earn the same margin. Product category mix is one of the biggest drivers of an electrical distributor's overall profitability.
| Product Category | Typical Gross Margin | Margin Driver |
|---|---|---|
| Wire and cable | 12-18% | Commodity, copper-price driven |
| Conduit and fittings | 18-22% | Semi-commodity, logistics-driven |
| Switchgear and panels | 20-25% | Specified, project-based |
| Lighting fixtures | 25-35% | Brand/spec driven, higher value-add |
| Controls and automation | 28-35% | Technical, less price-shopped |
| Safety and tools | 25-30% | Convenience/MRO purchases |
| Datacom/low voltage | 22-28% | Growing category, less commoditized |
Wire and cable is the margin killer. Copper is a commodity. Prices change daily. Contractors know the going rate and will call three distributors for quotes. A 500,000-foot wire order might carry 12-14% gross margin. That same contractor buying a box of wire nuts at the counter gives you 40%.
This is why Electrical Wholesaling's research shows that 31% of electrical distributor sales are incidental purchases, and the most profitable distributors make 6-12 more margin points on those incidental items than the average distributor does (Electrical Wholesaling, 2023).
The product mix problem: a distributor that's 40% wire and cable by revenue will run structurally lower gross margins than one that's 30% lighting and controls. You can't change what your customers need, but you can price the non-commodity products appropriately.
Stock vs. Project Pricing
Electrical distribution runs on two distinct pricing models, and the margin profiles are very different.
Stock Sales (Counter/Will-Call)
These are standard inventory purchases. A contractor walks in, grabs what they need, pays the agreed multiplier, and leaves. Stock sales run at standard margins, driven by the pricing matrix.
Typical margin: 22-30%
Stock sales are the bread and butter. They're quick to process, don't require bid preparation, and benefit from the multiplier structure that's already in the system.
Project Sales (Bid/Job)
When a general contractor puts a commercial building out to bid, the electrical subcontractor needs material pricing. They'll call their distributor for a job quote covering every item on the bill of materials.
Typical margin: 12-20%
Project pricing is competitive. The electrical contractor is bidding against other subs, and they need the lowest material cost to win the job. Distributors often cut margins to win project business, banking on the follow-on stock orders during construction.
The math that matters:
Blended Margin = (Stock Revenue x Stock Margin) + (Project Revenue x Project Margin) / Total Revenue
Example: ($6M x 26%) + ($4M x 16%) / $10M = ($1.56M + $0.64M) / $10M = 22.0%
A distributor doing 60% stock and 40% project at those margins blends to 22%. Shift the mix to 50/50 and it drops to 21%. That one point on $10M is $100,000.
The best electrical distributors protect their stock margins while being competitive on projects. They don't let project pricing bleed into stock pricing, and they don't treat every counter sale like a bid.
The Role of Manufacturer Rebates
In electrical distribution, rebates aren't a bonus. They're a structural part of the P&L.
According to Enable (2024), electrical distributors report that rebates can represent up to 60% of bottom-line profit. That's not a typo. When your net margin is 3% and rebates add 1.5-2% to your effective margin, they're the difference between profitability and break-even.
Types of Manufacturer Rebate Programs
| Rebate Type | How It Works | Typical Value |
|---|---|---|
| Volume rebates | Earn back based on total purchases | 1-3% of purchases |
| Growth incentives | Bonus for year-over-year growth | 0.5-1.5% additional |
| SPAs (Special Pricing Agreements) | Reduced cost on specific products for specific customers/jobs | 10-20% cost reduction |
| Marketing co-op | Funds for advertising and promotion | 1-2% of purchases |
| Early pay discounts | Discount for paying invoices early | 1-2% per invoice |
SPAs: The Hidden Pricing Layer
Special Pricing Agreements deserve their own discussion because they're one of the most complex parts of electrical distribution pricing. A manufacturer gives the distributor a reduced cost on a specific product for a specific end customer or project. The distributor is expected to pass some of that savings through.
Here's where it gets complicated. SparXiQ research shows that 25-50% of a typical distributor's revenue involves some form of vendor cost support through SPAs, and that cost support averages a 10-20% reduction versus standard into-stock cost (SparXiQ, 2023).
The leakage risk: SPAs expire, change, or get stacked with other discounts. A customer might have an SPA-supported price from two years ago that's still active in your system even though the manufacturer pulled the program. You're now funding the discount yourself.
Rebate Capture Gaps
Most ERP systems aren't built to track rebate programs at the granularity needed. Tiers have thresholds. Programs have deadlines. Products qualify or don't based on category codes that may not match your item master.
According to industry estimates, electrical distributors leave approximately 4% of potential rebate earnings unclaimed due to tracking gaps (Enable, 2024). For a $50M distributor earning 2% in rebates, that's $40,000 left on the table every year just from administrative gaps.
Where Pricing Breaks Down: Branch-Level Inconsistency
This is the single biggest source of margin leakage for mid-market electrical distributors. It's not strategy. It's execution.
The Branch Problem
A multi-branch electrical distributor with 5-15 locations will, over time, develop different pricing cultures at each branch. The branch manager in one location approves discounts that the branch manager across town wouldn't. Reps develop their own habits. Customer agreements are stored locally.
Zilliant's research on electrical distribution pricing found that traditional distributors leak between 2-11.7% of margin on average due to pricing inconsistency (Zilliant, 2026). That range is wide because some distributors have systematic pricing processes and others don't.
Three Layers of Pricing in Electrical Distribution
Electrical Trends identified three distinct pricing layers that create inconsistency (Electrical Trends, 2026):
- Matrix pricing: Manufacturer-driven multiplier schedules. These are systematic and generally consistent.
- Customer agreements: Negotiated pricing for specific customers. These vary by branch, rep, and relationship.
- Override pricing: Gut-feel adjustments made by reps or branch managers on individual transactions. This is where the leakage lives.
When override pricing becomes the norm rather than the exception, you've lost control of your margin. The best distributors track override frequency and dollar impact by branch and rep.
What the Margin Spread Looks Like
Electrical Wholesaling's profitability research found that the median margin difference between a distributor's largest and smallest customers is 9.9 points (Electrical Wholesaling, 2023). That's expected: big customers get better pricing.
But here's the finding that matters: the bottom quartile of distributors had only a 6-point spread, while the top quartile had a 13-point spread. The profitable distributors differentiate more aggressively. They give great pricing to their best customers and hold the line on everyone else.
| Customer Tier | Bottom Quartile Margin | Top Quartile Margin |
|---|---|---|
| Large accounts | ~18% | ~18% |
| Mid-size accounts | ~22% | ~25% |
| Small/incidental | ~24% | ~31% |
The top quartile doesn't make more on their big accounts. They make dramatically more on their small and incidental accounts. That's 7 points more on roughly a third of their business.
How Top Electrical Distributors Manage Pricing
The highest-performing electrical distributors share a few common practices. None of these require enterprise pricing software.
1. They Separate Stock and Project Pricing Rigorously
Stock pricing follows the matrix. Project pricing goes through a bid desk or pricing authority. The two never cross. A contractor can't get project pricing on a counter purchase just because they have a job quote somewhere in the system.
2. They Track Gross Profit Dollars Per Order, Not Just Margin Percent
A $50 order at 35% margin generates $17.50 in gross profit. If it costs $15-20 to process that order (pick, pack, invoice, collect), the transaction loses money regardless of margin percentage.
GP/Order = Order Revenue x Gross Margin %
Profit/Loss = GP/Order - Cost to Process Order
Example: $50 x 35% = $17.50 GP
$17.50 - $18.00 processing cost = -$0.50 loss
Electrical Wholesaling calls this the number-one profit secret: focus on gross profit dollars per order relative to transaction cost, not margin percent (Electrical Wholesaling, 2023).
3. They Manage Rebates as a Profit Center
Top distributors assign someone to manage manufacturer programs the way a portfolio manager tracks investments. They know which suppliers they're 5% away from a tier threshold. They shift purchase timing to hit volume targets. They file co-op claims on time.
4. They Price Incidentals Aggressively
That box of wire nuts, the single breaker, the pack of cable ties. These items are convenience purchases. The contractor isn't price-shopping them. The top-quartile distributors make 12 additional margin points on incidental purchases compared to average distributors (Electrical Wholesaling, 2023).
5. They Review Customer Pricing Annually
Customer-specific pricing that's two or three years old is almost certainly wrong. Costs have changed. Volume commitments weren't met. Competitive conditions shifted. The best distributors review all customer agreements annually and adjust pricing based on actual performance.
The Impact of Copper and Commodity Volatility
Wire and cable represents a significant share of electrical distribution revenue, and it's priced against a commodity. Copper prices move daily.
Wesco noted in its 2024 report that managing commodity price fluctuations is a persistent challenge (Wesco, 2025). The standard approach is cost-plus pricing on wire, where the selling price equals the copper commodity cost plus a conversion charge plus the distributor's margin.
The volatility risk: when copper drops, distributors holding inventory at higher costs face margin compression. When copper rises, there's a window to capture extra margin before repricing catches up. The best distributors manage this with:
- Daily price updates on commodity-driven products
- Inventory position awareness relative to replacement cost
- Contract structures that pass commodity risk to the buyer on large orders
For a deeper look at how price waterfalls expose these dynamics, including the gap between list price and the actual pocket price you collect, a waterfall analysis is the right starting point.
Finding Your Pricing Gaps
If you're a mid-market electrical distributor running 20-23% gross margin, the question isn't whether you have pricing gaps. It's how big they are.
Based on the benchmarks and research above, here's where to look first:
| Opportunity Area | Typical Revenue Impact | Where to Find It |
|---|---|---|
| Branch pricing inconsistency | 1-3% | Compare same-SKU margins across branches |
| Stale customer agreements | 0.5-1.5% | Flag agreements older than 12 months |
| Incidental purchase underpricing | 1-2% | Analyze margin on C/D items by customer |
| Rebate capture gaps | 0.3-1% | Audit tier attainment vs. actual purchases |
| Project pricing bleed-through | 0.5-1% | Check if job pricing appears on stock orders |
For a $60M electrical distributor, the math looks like this:
Conservative estimate: $60M x 2% = $1,200,000 in recoverable margin
Moderate estimate: $60M x 3.5% = $2,100,000 in recoverable margin
That's real money. And you don't need enterprise pricing software to find it. You need visibility into your transaction data.
Start by exporting your sales transactions. Map margin by customer, by product category, by branch. Look for the outliers. If the same product sells at 25% margin to one customer and 15% to a similar customer at a different branch with no volume justification, you've found leakage.
For more on how distributors identify and fix margin leakage, see our guide to margin leakage in distribution. For the methodology behind analyzing your full price-to-pocket waterfall, see our price waterfall analysis guide.
FAQs
What is a typical gross margin for electrical distributors?
Electrical distributors typically run 20-25% gross margin. Wesco International reported 21.6% gross margin for full-year 2024. Smaller independents with more lighting and controls in their mix can reach 25-28%, while wire-heavy distributors may run lower.
How do electrical distributor pricing multipliers work?
Manufacturers publish a list price for each product. Distributors buy at a cost multiplier (e.g., 0.42 = 42% of list) and sell at a higher multiplier (e.g., 0.65 = 65% of list). The spread between buy and sell multipliers determines gross margin. Different customer types buy at different multiplier levels.
What's the difference between stock and project pricing?
Stock pricing covers standard inventory purchases at matrix-driven margins, typically 22-30%. Project pricing is negotiated for specific construction jobs, usually through a bid process, at 12-20% margins. Top distributors keep these separate and don't let project pricing leak into stock transactions.
How important are manufacturer rebates to electrical distributor profitability?
Rebates are a structural part of the P&L, not a bonus. Industry data shows rebates can account for up to 60% of an electrical distributor's bottom-line profit. Programs include volume rebates, growth incentives, SPAs, and marketing co-op funds.
Where does most margin leakage occur in electrical distribution?
Branch-level pricing inconsistency is the biggest source. Different reps give different discounts on the same products to similar customers. Override pricing without guardrails, stale customer agreements, and uncaptured rebates compound the problem. The typical leakage is 2-5% of gross margin.
How do mid-market electrical distributors compete on pricing with Wesco and Graybar?
Mid-market distributors can't win on cost. They win on service, availability, and relationships. The pricing advantage comes from better execution: tighter controls on discounting, faster response on quotes, deeper knowledge of local market conditions, and willingness to stock what the national players won't carry. Focus on protecting your margins on the business you have rather than chasing volume at thin margins.
Last updated: Invalid Date
Frequently Asked Questions

Want to analyze your entire product catalog?
Pryse automatically identifies margin leakage across thousands of SKUs. Upload your data and find hidden profit in 24 hours.
One-time $1,499 diagnostic. No subscription required.