Distributor Profit Margin: Benchmarks, Averages, and How to Improve
Average distributor net profit margins run 2-5%. See benchmarks by industry vertical, learn what separates top performers, and find where to recover margin.
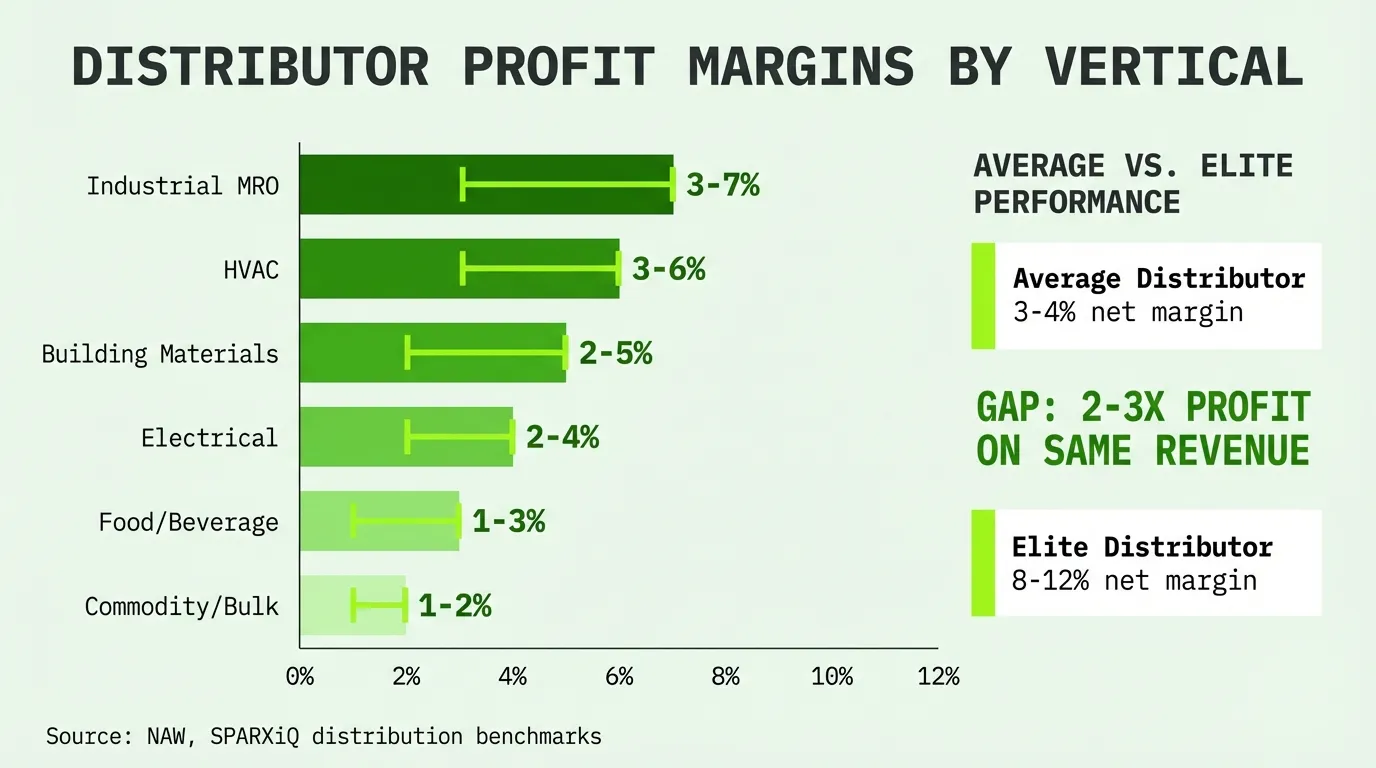
The average distributor net profit margin is 2-5%, with most landing around 3-4% after all costs. Top-quartile distributors hit 8-12% EBITDA on sales -- roughly double to triple the industry average. The gap between average and elite isn't revenue size. It's pricing discipline and operational efficiency.
This post breaks down profit margins by industry vertical, explains what separates top performers from average, and shows where the recoverable margin sits.
For a broader overview of all three margin types (gross, operating, net), see our guide to distributor margins. This post goes deeper on profit margin specifically -- the number that hits your bank account.
What "Profit Margin" Means for Distributors
Before benchmarking, it's worth clarifying terms. Distributors use three margin measurements, and they tell different stories.
Gross Margin = (Revenue - COGS) / Revenue x 100
Operating Margin (EBITDA) = (Revenue - COGS - Operating Expenses) / Revenue x 100
Net Profit Margin = (Revenue - All Costs) / Revenue x 100
Gross margin measures pricing power -- what you earn before operating costs. Operating margin (often expressed as EBITDA in distribution) measures how efficiently you run the business. Net profit margin is what's left after interest, taxes, depreciation, and everything else.
When distributors say "profit margin," they usually mean net margin. When industry analysts publish benchmarks, they usually mean EBITDA. This post covers both, clearly labeled.
| Margin Type | What It Measures | Typical Range |
|---|---|---|
| Gross margin | Pricing power vs. cost of goods | 20-30% |
| Operating margin (EBITDA) | Business efficiency | 3-8% |
| Net profit margin | Bottom-line profitability | 2-5% |
The compression from 25% gross to 3% net is where distribution economics play out. Every percentage point of operating efficiency you gain drops straight to net profit.
Average Distributor Profit Margins: The Data
Multiple sources converge on a consistent picture. Distribution is a thin-margin business, but the range between average and top performers is enormous.
NAW/SPARXiQ data (2024): Average distributors earn approximately 4% EBITDA on sales. Elite distributors achieve 8-12% EBITDA. Adjusting for business mix, average distributors earn one-third to one-half the profitability of their top-quartile peers.
NYU Stern/Damodaran data (January 2026): Retail distributors show 10.56% operating margin and 6.05% net margin across 62 publicly traded firms. Food wholesalers run 2.75% operating and 1.17% net across 13 firms.
NAW industry estimate: The average after-tax profit margin across wholesale distribution is approximately 1.8%.
Those numbers aren't contradictory. Publicly traded distributors skew larger and more efficient. The 1.8% average captures the long tail of smaller distributors running thinner. And EBITDA excludes interest, taxes, depreciation, and amortization, so it always runs higher than net.
The takeaway: if you're at 2-3% net margin, you're average. At 5%+, you're outperforming most peers. Below 2%, there's margin to recover.
Distributor Profit Margins by Industry
Profit margins differ sharply across distribution verticals. Product characteristics, competitive dynamics, and service requirements all shape what's achievable.
| Industry Vertical | Gross Margin | Operating Margin | Net Profit Margin |
|---|---|---|---|
| Electrical distribution | 22-28% | 3-6% | 2-4% |
| HVAC distribution | 25-35% | 5-8% | 3-6% |
| Building materials | 23-28% | 4-7% | 2-5% |
| Industrial MRO | 28-35% | 5-10% | 3-7% |
| Food/beverage wholesale | 12-18% | 1-3% | 0.5-2% |
| Janitorial/sanitation | 25-32% | 4-7% | 2-5% |
| Fasteners/hardware | 30-40% | 6-10% | 4-7% |
Sources: Damodaran/NYU Stern (2026), NAW/SPARXiQ distributor benchmarks (2024), Electrical Wholesaling, industry interviews.
Electrical Distribution
Electrical distributors typically land at 2-4% net profit. Products are often specified by engineers, limiting the distributor's pricing flexibility. Fewer than 1% of electrical distributors hit the "10% EBITDA club" according to Electrical Wholesaling.
The margin challenge: counter sales, project work, and contract business all carry different margin profiles. A branch might run 28% gross on counter sales but 18% on a large project bid. Blended margins land in the low-to-mid 20s.
HVAC Distribution
HVAC distributors tend to outperform electrical by 1-3 points at the net margin level. Equipment carries better margins than commoditized electrical products, and the contractor customer base is relationship-driven. That relationship creates some pricing latitude that pure commodity distribution doesn't have.
Top HVAC distributors target 6-8% net margins through a mix of equipment sales, parts, and value-added services like system design and technical support.
Industrial MRO
Industrial MRO sits at the top of the margin range for most distribution verticals. Product variety (50,000+ SKUs is common), customer switching costs, and urgency-based purchasing all support stronger pricing.
A plant that needs a critical replacement part today will pay a premium for same-day availability. That urgency-based value translates directly to margin.
Food and Beverage Wholesale
Food distribution represents the thin end of the profit margin spectrum. Damodaran's data (2026) shows food wholesalers at 2.75% operating margin and just 1.17% net. Perishability forces faster turns, commodity competition compresses pricing, and slim supplier margins leave little room for the distributor.
A food distributor running 2% net is performing well. Most are closer to 1%.
For a deeper comparison across all seven major verticals, see our industry-by-industry margin breakdown.
What Separates Top-Performing Distributors
The 400-800 basis point gap between average and elite distributors (SPARXiQ, 2024) doesn't come from selling different products or serving different markets. It comes from execution on five specific areas.
1. Pricing Discipline
This is the single biggest lever. SPARXiQ's research shows distributors who achieve pricing mastery outperform industry-average profitability by 50-200%. That mastery means:
- Customer-specific prices with documented justification
- Regular pricing reviews (at minimum annually)
- Guardrails on sales rep discounting authority
- Matrix pricing that reflects cost-to-serve differences
Most distributors leave 1-3 percentage points of gross margin on the table through pricing inconsistency alone (NAW, 2024). On $50M in revenue, that's $500K-$1.5M in profit you've already earned but aren't collecting.
2. Money-Losing Transaction Management
Here's a number that should stop you: distributors with 65-75% money-losing invoices average 2.7% net profit. Distributors with 0-15% money-losing invoices average 22.6% net profit (MDM, 2024).
That isn't a typo. The proportion of unprofitable transactions is one of the strongest predictors of overall profitability.
Most distributors know they have some money-losing invoices. Nearly all underestimate how many. Early estimates put the number at 15-18% of transactions. In practice, many distributors run 40-60% unprofitable invoices and subsidize them by overcharging their best customers.
Revenue Impact of Unprofitable Invoices:
If 50% of invoices lose an average of $15 each on a base of 100,000 annual invoices:
Annual Margin Drain = 50,000 x $15 = $750,000
Reducing money-losers from 50% to 25% at the same average loss:
Recovered Margin = 25,000 x $15 = $375,000
3. Cost-to-Serve Pricing
A customer placing 200 small orders per year with next-day delivery and 60-day terms costs 8-12% more to serve than one ordering monthly in full pallets on standard terms. Top distributors price to reflect this. Average distributors give everyone the same margin treatment.
4. Supplier Rebate Capture
Rebates add 2-5% to effective margin for distributors who manage them actively. The programs are complex -- volume tiers, growth targets, product-specific rates, co-op funds -- and average distributors leave money in every bucket. Common gaps: missing tier thresholds by small amounts, failing to claim co-op funds, not timing purchases around rebate periods.
5. Freight Cost Recovery
Transportation runs 2-4% of revenue. Average distributors absorb a large chunk through free delivery on small orders, unrecovered fuel surcharges, and unenforced delivery minimums. Each percentage point of freight you absorb comes straight off net margin.
How to Calculate Your Distributor Profit Margin
Here's a worked example for a $60M industrial distributor.
Revenue: $60,000,000
Cost of Goods Sold: $43,200,000 (72% of revenue)
Gross Profit: $16,800,000 (28% gross margin)
Operating Expenses:
Warehouse & facilities: $2,400,000 (4.0%)
Transportation: $1,800,000 (3.0%)
Sales compensation: $3,000,000 (5.0%)
G&A / Admin: $2,400,000 (4.0%)
Inventory carrying cost: $1,200,000 (2.0%)
Total Operating Expenses: $10,800,000 (18.0%)
Operating Profit (EBITDA): $6,000,000 (10.0%)
Interest expense: $600,000 (1.0%)
Depreciation & amort: $900,000 (1.5%)
Taxes: $1,125,000 (1.9%)
Net Profit: $3,375,000
Net Profit Margin: 5.6%
This distributor is performing above average -- 28% gross margin, 18% operating expenses, and 5.6% net margin put them solidly in top-quartile territory.
Compare that to an average performer:
| Metric | Top Performer | Average Performer |
|---|---|---|
| Revenue | $60,000,000 | $60,000,000 |
| Gross margin | 28% | 24% |
| Operating expenses | 18% of revenue | 21% of revenue |
| EBITDA | 10% | 3% |
| Net profit margin | 5.6% | 1.2% |
| Net profit $ | $3,375,000 | $720,000 |
Same revenue. Same industry. Same market. The difference in net profit is $2.65M. That's the gap between pricing discipline and pricing chaos.
Where Your Profit Margin Is Hiding
Based on analysis of mid-market distributors, these are the most common sources of recoverable margin, ranked by typical impact:
| Source of Margin Leakage | Typical Recovery | Example at $50M Revenue |
|---|---|---|
| Pricing inconsistency | 1-3% of revenue | $500K-$1.5M |
| Money-losing transactions | 0.5-2% of revenue | $250K-$1M |
| Freight absorption | 0.5-1.5% of revenue | $250K-$750K |
| Rebate capture gaps | 0.5-1.5% of revenue | $250K-$750K |
| Stale contract pricing | 0.3-1% of revenue | $150K-$500K |
| Payment terms cost | 0.3-0.8% of revenue | $150K-$400K |
Total addressable margin leakage typically runs 2-5% of revenue. For a $50M distributor, that's $1M-$2.5M that's already been earned at the gross margin level but doesn't reach the bottom line.
The problem is visibility. Most ERP systems show gross margin by product or customer but not the off-invoice deductions, freight giveaways, and rebate gaps that eat the space between gross and net. A price waterfall analysis is the starting point for any margin improvement effort.
For specific leakage sources, see our guide to margin leakage and margin leakage in distribution.
Benchmarking Your Profit Margin: A Quick Framework
Not sure where you stand? Here's a simple framework based on NAW and SPARXiQ benchmarks.
Below 2%: Bottom half of the industry. Margin is hiding in pricing inconsistency, freight absorption, or unmanaged customer costs. Start with a transaction-level pricing audit.
2-4%: Average. Not a compliment when the top quartile earns 2-3x your margin on similar revenue. Focus on reducing money-losing transactions and tightening price governance.
4-6%: Strong. You're likely managing pricing deliberately. Next gains come from cost-to-serve optimization and rebate capture refinement.
Above 6%: Elite territory. Sustaining it requires continuous pricing review and disciplined execution. Margins erode quickly when attention drifts.
Profit Margin vs. Return on Assets: The Distribution Nuance
One important caveat: profit margin alone doesn't tell the full story for distributors.
A distributor running 3% net margin but turning assets 3x per year generates a 9% return on assets. A manufacturer running 8% net margin but turning assets once generates an 8% return.
Return on Assets = Net Profit Margin x Asset Turnover
Distributor: 3% margin x 3.0 turns = 9% ROA
Manufacturer: 8% margin x 1.0 turns = 8% ROA
Distribution works because velocity compensates for thin margins. But only if you're achieving the velocity. Slow inventory turns, extended receivables, and underutilized warehouse space all erode the asset turnover that makes the model work.
The healthiest distributors optimize both sides: net margin toward 5%+ and 2.5-3.5x asset turns.
The Bottom Line
Distributor profit margins are thin by design. The business model depends on volume and velocity, not fat margins. But "thin" doesn't mean "fixed."
The spread between average (2-3% net) and elite (5-8% net) represents real, recoverable profit. On $50M in revenue, closing half that gap means $750K-$1.5M in additional annual profit.
The starting point is visibility. You can't improve what you can't measure at the transaction level. A margin leakage analysis built from your actual transaction data shows exactly where the gap is and what it's worth.
For a breakdown of all three margin types, see distributor margins. For broader context, see wholesale profit margins.
Last updated: Invalid Date
Frequently Asked Questions

Want to analyze your entire product catalog?
Pryse automatically identifies margin leakage across thousands of SKUs. Upload your data and find hidden profit in 24 hours.
One-time $1,499 diagnostic. No subscription required.