Building Materials Distribution Pricing: Margins, Challenges, and Strategy
How building materials distributors set prices, protect margins through commodity volatility, and stop leaking profit on delivery, bid work, and account pricing.
Building materials distributor pricing is the practice of setting sell prices for lumber, roofing, drywall, insulation, and related products sold to contractors, builders, and tradespeople -- balancing commodity cost volatility, delivery economics, and relationship-based account pricing.
It's harder than most distribution verticals. Your cost on framing lumber can move 20% in a month. Your products weigh thousands of pounds and need flatbed delivery to muddy job sites. Your best customers want account pricing locked in for a project that won't ship for six months. And your margins are thin enough that getting any of these wrong turns a profitable order into a loss.
How Building Materials Distribution Pricing Works
Unlike industrial distribution, where prices hold for months, building materials pricing shifts weekly based on lumber futures, supplier allocations, and regional demand. Most distributors use a layered approach:
List price is the starting point, based on manufacturer pricing or the distributor's markup over current replacement cost. For commodity lumber, this resets frequently. For specialty products, it's more stable.
Account pricing is negotiated with established contractors. A framing contractor buying $500K/year gets different pricing than a homeowner buying ten 2x4s. These prices are set as a discount off list or a fixed markup over cost.
Bid pricing applies to project work. The distributor quotes based on current costs plus margin, but materials won't ship for weeks or months. The gap between quote date and delivery date is where commodity risk lives.
Walk-in / cash-and-carry is the highest price tier. This serves small contractors and retail customers buying smaller quantities without an account.
Typical Building Materials Price Stack:
List Price (100%)
- Account Discount (15-25% for pro accounts)
= Invoice Price
- Off-Invoice Adjustments (delivery credits, rebates, returns)
= Pocket Price (what you actually collect)
Pocket Margin = (Pocket Price - Replacement Cost) / Pocket Price x 100
The challenge is that "replacement cost" is a moving target. A distributor who bought lumber at $400/mbf last month and sells it this month at a 20% markup is earning solid margin if current cost is still $400. But if current cost is now $500, they're selling below replacement cost -- even though the P&L shows a profit on that specific transaction.
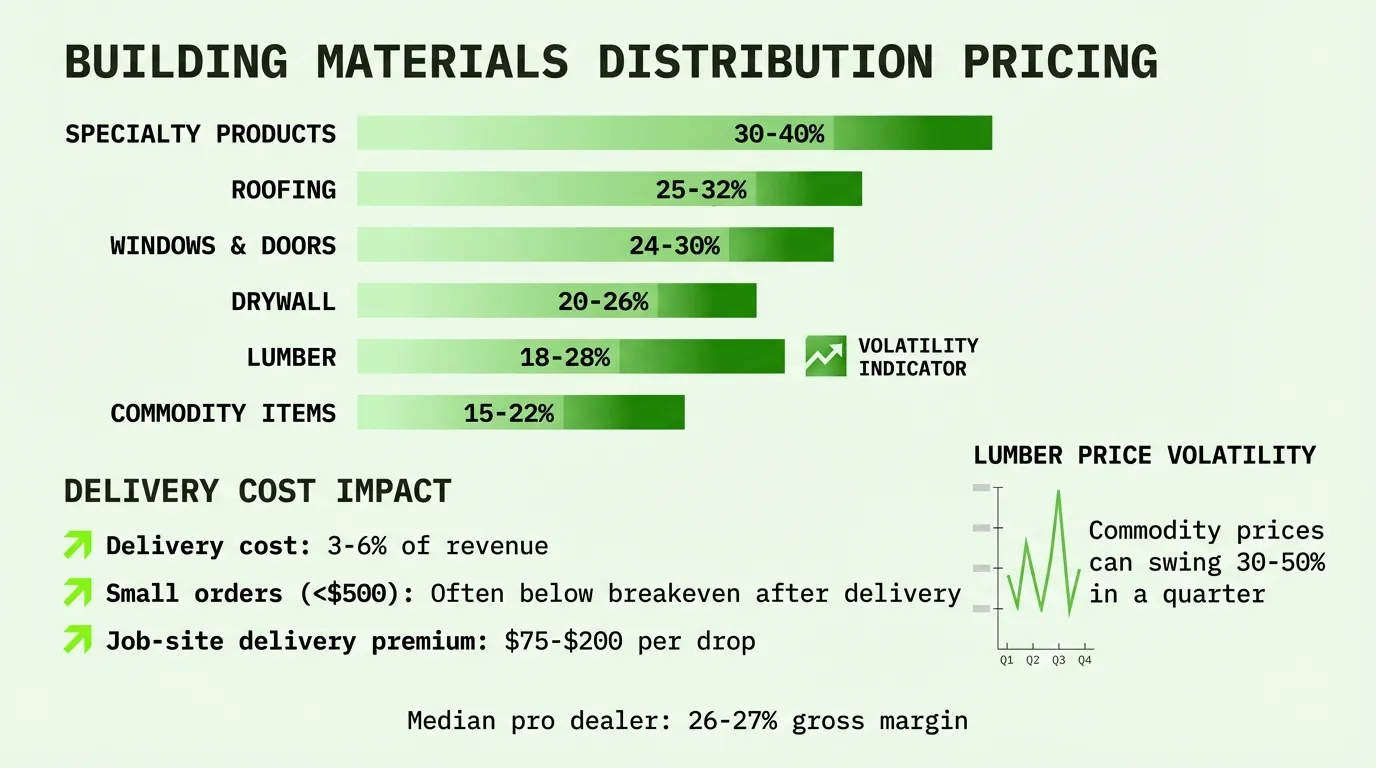
Margin Benchmarks by Product Category
Building materials margins vary dramatically by product type. Commodity products carry thin margins and high volatility. Specialty products carry better margins but move slower.
Typical gross margin ranges by product category, based on public filings from BlueLinx and Beacon Roofing Supply and NLBMDA industry data:
| Product Category | Typical Gross Margin | Volatility | Notes |
|---|---|---|---|
| Framing lumber (SPF, dimensional) | 8-15% | Very high | Moves with commodity markets daily |
| Engineered wood (LVL, I-joists, glulam) | 20-28% | Moderate | Less commodity exposure, spec-driven |
| Panels (plywood, OSB) | 10-18% | High | Correlated with lumber but separate market |
| Roofing (shingles, underlayment) | 24-28% | Low-moderate | Dominated by 3 manufacturers; pricing more stable |
| Drywall / gypsum | 18-24% | Moderate | Regional pricing power varies; heavy and costly to ship |
| Insulation (fiberglass, spray foam) | 22-30% | Low | Good margin category, lighter weight |
| Decking / railing (composite) | 28-35% | Low | Specialty, brand-driven, strong margins |
| Siding (vinyl, fiber cement) | 22-28% | Low | Spec-driven, moderate competition |
| Doors / windows | 20-28% | Low | Higher margin but slower turns |
| Fasteners / accessories | 30-45% | Very low | Small-ticket, high-margin add-ons |
BlueLinx, one of the largest US building products distributors, reported specialty product gross margins of 17-18% and structural product margins of 8-9% in Q3 2025 (BlueLinx, 2025). Beacon Roofing Supply ran a gross margin of 25.7% in fiscal 2024 on $9.8 billion in revenue (Beacon Roofing Supply, 2024).
The takeaway: your blended gross margin depends heavily on your product mix. A distributor skewed toward framing lumber will run 15-20% gross margins and live with high volatility. A distributor weighted toward roofing, insulation, and specialty products can reach 25-30% with more predictability.
The Commodity Volatility Problem
No building materials pricing discussion is complete without addressing lumber volatility. It's the single biggest pricing challenge in this vertical.
Between 2020 and 2022, softwood lumber prices swung from roughly $350 per thousand board feet to over $1,500/mbf -- a 530% increase from trough to peak (NAHB, 2022). The producer price index for softwood lumber exhibited monthly volatility exceeding 20% for the first time in the 75-year history of the BLS tracking series (Eye on Housing, 2022).
That volatility hasn't disappeared. Framing lumber averaged around $903/mbf in October 2025, still well above pre-pandemic norms, and cumulative tariffs on Canadian softwood lumber now exceed 40% when combining countervailing duties, anti-dumping duties, and Section 232 tariffs (Lumber Capital, 2025).
What Volatility Does to Distributor Margins
A building materials distributor carries inventory. They buy lumber today and sell it over the coming days or weeks. Most ERP systems report margin based on historical cost of the inventory sold. That creates two illusions:
In rising markets, reported margins look great because you're selling inventory bought at lower prices. But replacement cost is higher, and the margin on your next purchase will be thinner unless you raise prices immediately.
In falling markets, margins compress because you're selling expensive inventory into a market where competitors are pricing off lower replacement costs. Cut prices too slowly and you lose volume. Cut too fast and you take margin hits on existing stock.
Commodity Margin Risk on a Single Lumber Order:
Purchase: 50,000 board feet at $450/mbf = $22,500
Sale (2 weeks later): 50,000 board feet at 20% markup = $27,000
Reported Gross Margin: ($27,000 - $22,500) / $27,000 = 16.7%
But if replacement cost moved to $500/mbf during those 2 weeks:
Replacement Cost: $25,000
Real Economic Margin: ($27,000 - $25,000) / $27,000 = 7.4%
Your P&L says 16.7%. Your economics say 7.4%.
How Top Distributors Price Through Volatility
The best building materials distributors treat commodity and specialty pricing as two separate disciplines.
For commodity products (lumber, panels, structural): Reprice daily or weekly based on published benchmarks like Random Lengths. Hold quote validity to 24-48 hours during volatile periods. Use index-based pricing for large accounts: "your price is Random Lengths plus $X per mbf." Separate commodity margin from blended margin in internal reporting.
For specialty products (engineered wood, decking, roofing, insulation): Reprice quarterly or when manufacturers announce changes. Hold longer quote windows (30-60 days). Focus on value and availability rather than price competition.
Commodity lumber needs the reflexes of a trader. Specialty products need the consistency of a relationship business. Pricing everything the same way is the biggest mistake building materials distributors make.
The Delivery Economics Challenge
Building materials are heavy, bulky, and fragile. A load of drywall weighs 2,500-3,000 lbs per thousand square feet. A lumber package for a single-family home can fill a flatbed. Roofing shingles come in 60-80 lb bundles that need rooftop loading with a crane or conveyor.
Delivery isn't a nice-to-have in building materials distribution -- it's a core service. And it's where a lot of margin disappears.
What Delivery Actually Costs
For most building materials distributors, delivery runs 4-8% of revenue. That includes:
| Cost Component | Typical % of Revenue |
|---|---|
| Truck depreciation / leasing | 1.0-1.5% |
| Fuel | 0.8-1.5% |
| Driver wages and benefits | 1.5-2.5% |
| Insurance | 0.3-0.5% |
| Maintenance | 0.2-0.4% |
| Boom / crane truck costs | 0.3-0.8% |
| Total | 4.1-7.2% |
On a 25% gross margin, delivery costs alone consume 16-29% of your gross profit. And that's before you account for job-site conditions: unpaved roads, tight access, waiting time for the contractor to show up, and return trips for rejected or damaged material.
Where Delivery Eats Margin
Small orders without surcharges. Sending a flatbed to deliver $300 worth of 2x4s costs the same in fuel and driver time as delivering $3,000 worth of framing lumber. Without a minimum order or delivery fee, small orders destroy margin.
Job-site delivery vs. yard pickup. A contractor picking up at your yard costs almost nothing. Job-site delivery 30 miles away costs $150-$400 per trip. If both customers pay the same product price, you're subsidizing delivery with margin.
Return trips and partial loads. Contractor changed the spec. Wrong material ordered. Can't access the site today. Every return trip is a direct margin hit.
How to Price Delivery Profitably
Top distributors don't hide delivery in the product price. They price it explicitly: minimum order values ($500-$1,500) for free delivery, delivery fees ($75-$150) below the minimum, zone-based pricing by distance, fuel surcharges updated monthly, boom/crane surcharges for rooftop loading, and wait-time charges after a 15-30 minute window.
This isn't nickel-and-diming. It's making the true cost of service visible so you can price it into the relationship instead of silently absorbing it.
Contractor Relationships and Pricing Tiers
Building materials distribution is a relationship business. Your top 20% of accounts probably represent 60-80% of your revenue. Those relationships create pricing complexity.
Three Customer Channels, Three Pricing Models
| Channel | Typical Discount | Margin Target | Key Risk |
|---|---|---|---|
| Pro accounts | 15-25% off list | 18-25% gross | Stale pricing that doesn't track costs |
| Bid / project work | Aggressive | 10-15% gross on commodities | Quote-to-delivery cost changes |
| Walk-in trade | Small discounts | 25-35% gross | Low volume per transaction |
The Account Pricing Trap
Here's where building materials distributors consistently leak margin: account pricing that doesn't keep up with costs. A contractor negotiated "cost plus 12%" when lumber cost $400/mbf. Costs have moved, but "cost" in the formula might still reference the original landed cost rather than today's replacement cost.
McKinsey found that at one building materials company, sales reps negotiated contracts based on costs from up to 18 months prior to delivery, with no mechanism to adjust when costs increased (McKinsey, 2023).
The fix: tie account pricing to current replacement cost, set automatic repricing triggers when costs move more than 5%, review all account pricing quarterly, and include escalation clauses on bid work.
Where Building Materials Distributors Leak Margin
These are the most common margin leakage sources specific to building materials distribution:
1. Stale Account Pricing (0.5-2% of Revenue)
Account prices set during a different cost environment that nobody updated. Lumber cost went up 15% but the contractor's "cost plus" formula still references last quarter's cost basis. This is especially dangerous in commodity categories where costs move fast.
2. Unrecovered Delivery Costs (1-3% of Revenue)
Delivery costs absorbed into product margins instead of charged separately. Sales reps waiving delivery fees to close deals. Small orders shipped at the same delivery rate as full loads. For building materials, where products are heavy and job-site delivery is the norm, this is often the single biggest leak.
3. Bid Work Without Full Cost Loading (0.5-1.5% of Revenue)
Quoting project work based on product cost and target margin, but not loading in delivery, credit, handling, and return costs. A bid that looks like 15% gross margin on paper turns into 8% when you account for six deliveries, two returns, and 60-day payment terms.
4. Small-Order Subsidization (0.3-1% of Revenue)
No minimum order policy, or one that isn't enforced. Every $200 order that requires a truck delivery is a net loss when you account for delivery cost. These add up fast. A mid-market distributor doing 50 small orders per week at $150 loss each is burning $390K per year.
Small-Order Margin Drain:
50 small orders/week x $150 avg loss per order x 52 weeks = $390,000/year
That's roughly 0.5% of revenue for a $75M distributor, coming straight off the bottom line.
5. Discount Stacking on Project Work (0.5-1% of Revenue)
Account discount + project discount + volume rebate + early pay discount. Each looks reasonable in isolation. Together, they take a 22% gross margin order down to 12%. Without a price waterfall analysis, nobody sees the aggregate effect.
6. Commodity Repricing Lag (Variable, 0.5-3% of Revenue)
Prices in the system don't reflect current market costs. In a rising market, you're selling below replacement cost. In a falling market, you're overpriced and losing orders. The lag between when costs change and when your sell prices update is where some of the biggest margin swings happen.
For a $75M building materials distributor, these sources commonly add up to $2-5M in recoverable margin. That's the difference between a 3% net margin and a 6% net margin -- between surviving and thriving.
For a deeper dive on identifying and fixing these issues across distribution verticals, see our guide on margin leakage in distribution.
How Top Building Materials Distributors Manage Pricing
The gap between average and top-performing building materials distributors is wide. L.E.K. Consulting found that building and construction distributors have experienced a decade of EBITDA margin expansion, but that future gains require active pricing and operational improvement rather than relying on market tailwinds (L.E.K. Consulting, 2024).
Here's what the best operators do differently:
Separate commodity and specialty pricing. They run commodity pricing like a trading desk -- daily updates, tight spreads, position management -- and specialty pricing like a value-based business with quarterly reviews. BlueLinx's reporting illustrates this: specialty margins of 17-18% vs. structural margins of 8-9% in Q3 2025 (BlueLinx, 2025). Those two businesses need completely different approaches.
Invest in pricing visibility. McKinsey's research found that many building materials companies lack visibility into profitability drivers because sales is disconnected from procurement (McKinsey, 2023). Top distributors track real-time margin by customer and transaction, replacement cost vs. historical cost on every order, and price variance by sales rep and branch.
Enforce delivery cost recovery. They price delivery transparently, set clear minimum orders, and make the economics visible to the sales team. When a rep sees that a $400 order costs $165 to deliver, the conversation changes.
Use escalation clauses on bid work. A quote might read: "Valid 30 days. Lumber and panel pricing subject to adjustment if Random Lengths composite exceeds $X/mbf at time of order." Contractors are accustomed to volatility. They'd rather have an honest clause than a distributor who pads quotes with 15% contingency.
Review account pricing quarterly. Once per year isn't enough in building materials. The top distributors review their top 50 accounts quarterly, checking that pricing reflects current costs and that the customer is hitting the volume that justified their discount tier.
Building Materials vs. Other Distribution Verticals
| Metric | Building Materials | Electrical | HVAC | Industrial MRO |
|---|---|---|---|---|
| Typical gross margin | 23-28% | 22-28% | 25-35% | 28-35% |
| Typical net margin | 2-5% | 2-4% | 3-6% | 3-7% |
| Commodity exposure | Very high | Low-moderate | Low | Low |
| Delivery intensity | Very high | Moderate | Moderate | Low-moderate |
| Price volatility | High | Low | Low | Low |
Building materials runs lower margins than HVAC and industrial MRO primarily because of commodity exposure and delivery costs. But the volume opportunity is large -- the US construction materials market is valued at $145 billion (Fortune Business Insights, 2024), and the NLBMDA represents over 6,000 member companies, with an estimated 7,000+ independent operators industry-wide (NLBMDA, 2026). That fragmented market means pricing discipline varies wildly, creating opportunity for distributors who get it right.
For more context on how distributor margins work across sectors, see our guide to margin leakage.
What Building Materials Distributors Should Do Next
If you're running pricing from spreadsheets or ERP reports that don't separate commodity from specialty margins, here's where to start:
-
Split your margin reporting. Separate commodity products (lumber, panels, structural) from specialty products (roofing, decking, insulation, doors/windows) in your P&L. The blended number hides what's actually happening.
-
Audit your top 20 accounts. Pull 12 months of transaction data and calculate actual pocket margin -- after delivery costs, rebates, returns, and payment terms. Compare that to your target margin. The gap will surprise you.
-
Set delivery minimums and enforce them. If you don't have a minimum order for free delivery, you're subsidizing small orders with margin from large ones. Start with a minimum that covers your average delivery cost.
-
Reprice commodity SKUs weekly at minimum. If your lumber prices update monthly, you're leaving money on the table in both rising and falling markets. The best operators reprice daily.
-
Add escalation clauses to bid quotes. Protect yourself on project work that ships weeks or months after the quote date. Your contractors will understand.
For building materials distributors running 5,000-100,000 SKUs, doing this in Excel across thousands of transactions gets unmanageable fast. A price waterfall diagnostic can surface $200K-$2M in margin opportunities that are invisible in standard ERP reports. Pryse runs that analysis in 24 hours from a CSV upload -- no implementation, no enterprise contract.
Building materials distribution pricing is harder than most verticals. But those same complexities mean there's more margin hiding in the details. The distributors who treat pricing as a discipline are the ones running 5-7% net margins while their competitors fight over 2-3%.
Frequently Asked Questions
What gross margin should a building materials distributor target?
Target 23-28% blended gross margin, but split commodity from specialty in your reporting. Aim for 8-15% on structural lumber and panels, and 22-35% on specialty categories where you have more pricing power.
How often should building materials distributors update pricing?
Commodity lumber and panels: daily or weekly, tied to published indices like Random Lengths. Roofing and insulation: monthly or when manufacturers announce changes. Specialty products: quarterly. The mistake is updating everything on the same schedule.
Are delivery surcharges common in building materials distribution?
Yes, and increasingly so. Diesel costs, driver wages, and equipment costs have risen significantly since 2020. Distributors who don't charge for delivery aren't offering a better deal -- they're hiding delivery costs in higher product prices, which makes them less competitive on large orders.
How do tariffs affect building materials distributor pricing?
Cumulative tariffs on Canadian softwood lumber now exceed 40% (Lumber Capital, 2025). Steel and aluminum tariffs have pushed metal product prices up over 25% year-over-year (NAHB, 2026). Distributors need to pass these costs through promptly rather than absorbing them.
What's the best way to handle contractor price negotiations?
Anchor to value, not just price. Quantify what you're providing: next-day delivery, credit terms, inventory holds, job-site service. The yard across town might quote $200 less on material, but if they're cash-and-carry with a two-week lead time, your price includes real value the contractor is getting.
Last updated: Invalid Date
Frequently Asked Questions

Want to analyze your entire product catalog?
Pryse automatically identifies margin leakage across thousands of SKUs. Upload your data and find hidden profit in 24 hours.
One-time $1,499 diagnostic. No subscription required.