Margin Compression: What It Is, What Causes It, and How to Fight Back
Margin compression happens when costs rise faster than prices. Learn the causes, how it differs from margin erosion, and what distributors can do about it.
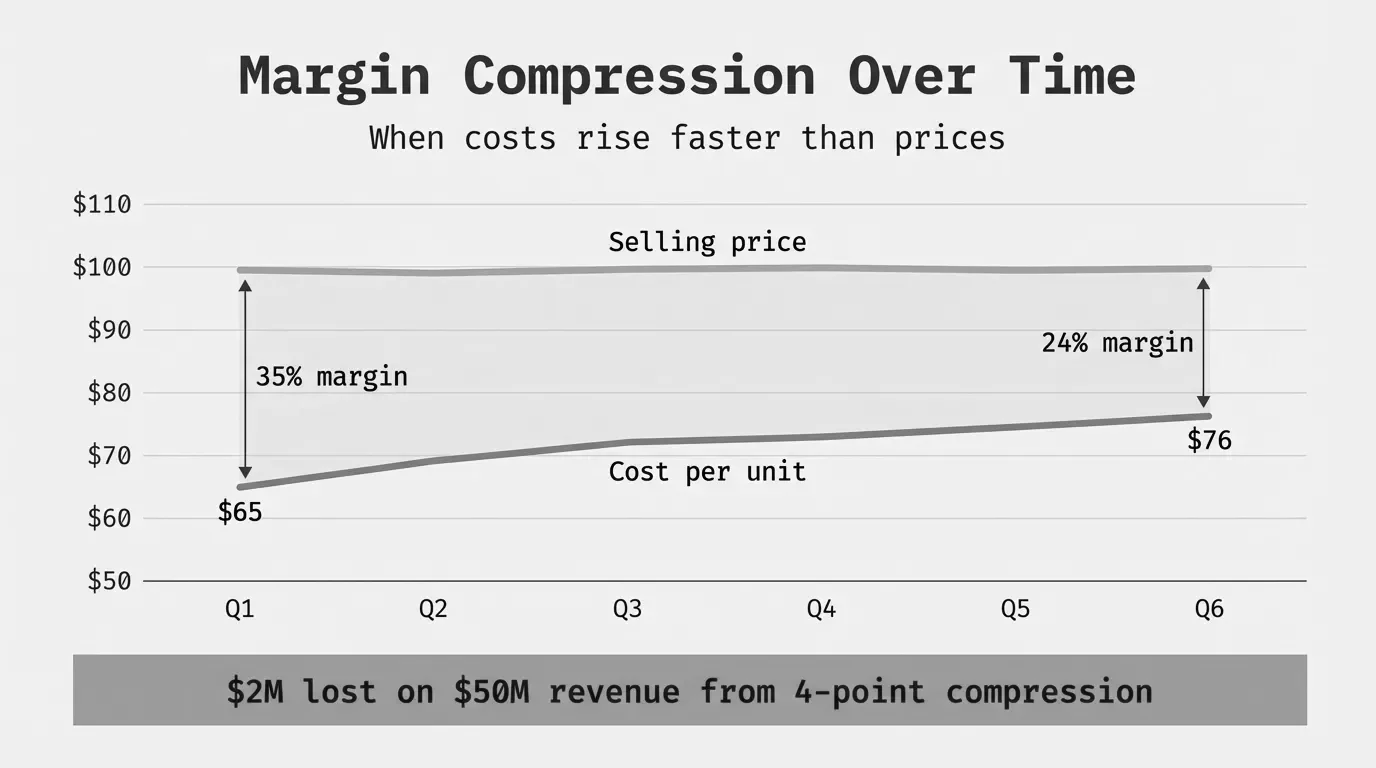
Margin compression is the narrowing of profit margins that happens when a company's costs rise faster than its ability to increase prices. It's the squeeze between what you pay and what you charge, and it's one of the most common profit killers in distribution and manufacturing.
If you run a $50M distribution company and your gross margin drops from 28% to 24% over 18 months, that's not a rounding error. That's $2 million in annual profit gone. And it probably didn't vanish in one dramatic moment. It bled out slowly across hundreds of SKUs, dozens of customer accounts, and a few supplier cost increases you didn't fully pass through.
Margin Compression = Prior Period Gross Margin % - Current Period Gross Margin %
Dollar Impact = Revenue x Margin Compression %
This article breaks down what margin compression actually means, how it differs from related concepts like margin erosion and margin leakage, what causes it in distribution and manufacturing specifically, and what you can do about it without hiring a team of consultants or buying a $100K pricing platform.
What Margin Compression Actually Means
Margin compression describes a specific financial phenomenon: profit margins shrinking over time because costs are growing faster than revenue per unit. It's a cost-side problem at its core.
Here's the simplest version. You buy a widget for $70 and sell it for $100. Your gross margin is 30%. Then your supplier raises the price to $78. If you don't raise your selling price, your gross margin drops to 22%. That's margin compression.
Before: ($100 - $70) / $100 = 30% gross margin
After: ($100 - $78) / $100 = 22% gross margin
Compression: 8 percentage points
In practice, it rarely looks this clean. Compression usually happens across thousands of SKUs simultaneously, with different cost increases hitting at different times, some customers accepting price increases while others don't, and freight surcharges fluctuating monthly. The effect compounds.
According to research from Bain & Company, only 55% of B2B companies successfully passed cost increases through to list prices that matched or exceeded their input cost growth. The other 45% absorbed some or all of the increases, directly compressing their margins.
Margin Compression vs. Margin Erosion vs. Margin Leakage
These three terms get used interchangeably, but they describe different problems. The distinction matters because each requires a different response.
| Concept | Primary Driver | Typical Timeframe | Direction of the Problem |
|---|---|---|---|
| Margin compression | Rising costs | Cyclical or sudden | Costs pushing up from below |
| Margin erosion | Falling prices + rising costs | Gradual and sustained | Prices falling from above and costs rising from below |
| Margin leakage | All of the above + operational gaps | Ongoing | Profit escaping through gaps in execution |
Margin compression is the cost side of the equation. Your inputs get more expensive. Steel prices spike. Freight rates double. Labor costs climb. Your margins compress because the cost floor is rising toward your price ceiling.
Margin erosion is broader. It includes compression, but also accounts for the revenue side: prices falling due to competition, discounting, or commoditization. Margin erosion is what happens when your costs go up AND your average selling price goes down. For more on the causes, see our breakdown of margin erosion causes.
Margin leakage is the umbrella concept. It covers every way profit slips through the cracks, including compression, erosion, unauthorized discounts, rebate mismanagement, pricing errors, and cost-to-serve imbalances. Our margin leakage guide covers the full picture.
The practical difference: compression can be temporary (commodity prices spike, then normalize). Erosion tends to be structural and harder to reverse. Leakage is ongoing and usually invisible until you go looking for it.
For a deeper comparison of the revenue-side dynamics, see margin erosion vs. margin leakage.
What Causes Margin Compression in Distribution and Manufacturing
Margin compression doesn't come from one source. It stacks. Each cause shaves a point or two off your margin, and together they can cut your profitability in half over a few years. Here are the primary drivers we see in mid-market distribution and manufacturing companies.
Rising Input Costs
This is the most obvious cause. Raw materials, components, freight, and labor all get more expensive. Between 2021 and 2025, manufacturers dealt with an extended period of input cost inflation that many hadn't experienced in decades.
According to a 2025 ISM survey, 54% of manufacturers said they planned to pass on only some cost increases from tariffs, absorbing the rest through reduced margins. Only a small fraction (8%) said they'd absorb all costs. But "passing on some" still means margin compression.
Here's what the progression looks like for a typical industrial distributor:
| Year | Avg. Cost per Unit | Avg. Selling Price | Gross Margin |
|---|---|---|---|
| 2021 | $64.00 | $100.00 | 36.0% |
| 2022 | $69.50 | $103.00 | 32.5% |
| 2023 | $73.00 | $105.50 | 30.8% |
| 2024 | $76.80 | $107.00 | 28.2% |
| 2025 | $79.50 | $108.50 | 26.7% |
Costs rose 24.2% over five years. Prices rose only 8.5%. That's 9.3 points of margin compression, equivalent to roughly $4.65 less profit on every $100 of revenue.
The categories that hit hardest for distributors and manufacturers:
| Cost Category | Typical Increase (2021-2025) | Pass-Through Rate |
|---|---|---|
| Raw materials (metals, plastics) | 25-40% | 50-70% |
| Freight and logistics | 30-60% | 40-60% |
| Direct labor | 15-25% | 30-50% |
| Energy | 20-35% | 20-40% |
| Packaging | 15-25% | 30-50% |
Notice the pass-through rates. None hit 100%. That gap between cost increase and price increase is margin compression by definition.
Competitive Pricing Pressure
When you sell the same products your competitors do (and in distribution, you often do), buyers can compare prices. That limits your ability to raise prices even when your costs justify it.
A distributor carrying Schneider Electric breakers or Parker hydraulic fittings doesn't have a monopoly on those products. If they raise prices 8% to cover cost increases and a competitor only raises 4%, they'll lose orders. So they split the difference, raise prices 5%, and absorb 3 points of compression.
This effect intensifies in industries where:
- Products are undifferentiated or commoditized
- Buyers have access to multiple suppliers
- Online marketplaces create price transparency
- Large buyers use competitive bidding processes
For commodity distributors, this alone can drive 2-4 points of annual compression during inflationary periods.
Customer Concentration
When a small number of customers account for a large share of your revenue, those customers have outsized bargaining power. And they use it.
In our analysis of mid-market distributors, companies where the top 5 customers represent more than 40% of revenue experience margin compression roughly 1.5x faster than companies with more diversified customer bases. The reason is straightforward: concentrated customers negotiate harder, demand volume discounts, and threaten to take their business elsewhere.
Here's a common scenario. Your largest customer does $4M a year with you. They account for 15% of your revenue. They ask for a 3% price reduction to renew their contract. You know switching costs are low for them. You agree. Your gross margin on that account drops from 26% to 23%, and because they're 15% of revenue, your blended margin drops by nearly half a point across the entire business.
Multiply this by your top 5 accounts running the same play, and you're looking at 1-2 points of compression annually just from customer negotiation, before input costs even enter the picture.
Product Commoditization
Products that were once differentiated become standardized over time. As they do, the basis of competition shifts from value to price, and margins compress accordingly.
This is the long-term structural version of compression. A specialty chemical that once commanded 45% margins gets reverse-engineered by competitors. Three years later, it's a commodity with 6 suppliers and 22% margins. The product didn't change. The market did.
In manufacturing, product commoditization tends to follow a predictable arc:
| Stage | Competitors | Typical Gross Margin | Pricing Power |
|---|---|---|---|
| Innovation | 1-2 | 45-60% | High |
| Early adoption | 3-5 | 35-45% | Moderate |
| Growth | 5-10 | 25-35% | Declining |
| Maturity | 10+ | 18-25% | Low |
| Commodity | Many | 12-20% | Minimal |
The problem for mid-market manufacturers is that most of their catalog sits in the growth-to-maturity stages. The high-margin innovation products are a small slice of the portfolio. The bulk of revenue comes from products facing steady compression.
Tariffs and Trade Policy
Since 2018, tariffs have added a new dimension to margin compression, especially for companies importing raw materials, components, or finished goods.
According to Wipfli's 2025 manufacturing trends report, 51.1% of manufacturers said tariffs had a negative business impact. The challenge isn't just the cost increase itself. It's the unpredictability. Companies can't plan pricing strategies around tariff structures that change based on political cycles.
A manufacturer importing steel components at 25% tariff rates either eats the cost (compression), passes it through (risking volume loss), or finds domestic suppliers (which are often more expensive anyway). There's no free option.
Slow Price Execution
This one is internal, and it's more damaging than most companies realize. There's a lag between when costs increase and when prices adjust. For companies managing prices in Excel spreadsheets (which, if you're reading this, is probably you), that lag can be 60-120 days.
Consider what happens:
- Supplier announces 6% price increase effective March 1
- You receive the new cost on invoices starting March 1
- Your pricing team reviews and approves new prices by April 15
- Updated price lists go to sales reps by May 1
- Reps begin quoting new prices on May 15
- Existing orders and contracts continue at old prices through June
That's 3.5 months of margin compression on every unit sold at the old price with the new cost. If March-June represents 30% of annual volume on those products, you've permanently lost margin on that volume.
McKinsey's research on digital pricing transformation found that companies implementing faster, data-driven pricing processes can generate 2 to 7 percentage points of margin improvement. Most of that improvement comes from simply closing the execution gap.
How to Measure Margin Compression
You can't fix what you can't see. And most mid-market companies don't track margin compression with enough granularity to act on it. Here's how to measure it properly.
Gross Margin Trend by Period
The most basic measurement. Track gross margin percentage quarterly or monthly, broken out by product line and customer segment.
Gross Margin % = (Revenue - COGS) / Revenue x 100
Period-over-Period Compression = GM% (Prior Period) - GM% (Current Period)
If your overall gross margin dropped from 29.4% in Q1 to 27.1% in Q4, that's 2.3 points of compression. But the aggregate number hides the real story. You need to know which product lines compressed and which customers are driving it.
Cost Pass-Through Rate
This tells you how much of your cost increases you're actually recovering through price increases.
Cost Pass-Through Rate = Price Increase % / Cost Increase % x 100
If your costs rose 8% and your prices rose 5%, your pass-through rate is 62.5%. Anything below 100% means you're absorbing some compression. In our analysis of mid-market distributors, the average pass-through rate runs 55-70%. Top performers consistently hit 85-95%.
Margin Bridge Analysis
A margin bridge breaks down exactly where margin moved between two periods. It answers: of the 2.3 points we lost, how much came from material cost increases, how much from freight, how much from customer mix shift, how much from discounting?
| Margin Factor | Impact (bps) |
|---|---|
| Starting gross margin (Q1) | 2,940 |
| Material cost increases | -120 |
| Freight cost increases | -60 |
| Customer mix shift | -40 |
| Increased discounting | -30 |
| Price increases captured | +80 |
| Product mix improvement | +40 |
| Ending gross margin (Q4) | 2,710 |
This kind of analysis is where most companies get stuck. Building a margin bridge in Excel across thousands of SKUs and hundreds of customers is genuinely painful. It's also where the most actionable insights live.
For a full framework on how to approach this, see our guide on margin analysis.
How to Respond to Margin Compression
Recognizing compression is step one. Responding to it effectively requires a different approach depending on whether the compression is temporary (cyclical cost spikes) or structural (permanent market shifts).
Targeted Price Increases
Not all products have the same pricing elasticity. Some items can absorb a 10% increase with minimal volume impact. Others will lose 30% of their volume if you raise prices 3%.
The goal is to raise prices where you can and hold where you must. In distribution, this usually means:
- Raise aggressively on tail SKUs (low volume, hard to compare, low buyer sensitivity)
- Raise moderately on standard items (match competitor increases)
- Hold or raise carefully on high-volume A-items where you're being actively benchmarked
Companies that take a blanket approach (raise everything 5%) almost always leave money on the table on some items and lose volume on others. Targeted increases based on price elasticity and competitive position outperform blanket increases by 150-300 basis points, according to Bain's research on B2B pricing.
Renegotiate Supplier Terms
If your suppliers are driving compression, negotiate back. Options include:
- Volume commitment agreements for better per-unit pricing
- Early payment discounts (2/10 net 30 terms can save 1-2%)
- Long-term contracts that lock in costs
- Consolidating purchases with fewer suppliers for better pricing power
Mid-market companies often have more negotiating power than they think, especially if they represent significant volume for regional suppliers.
Fix Cost-to-Serve Imbalances
Some customers cost more to serve than others. Small-order customers who require special handling, frequent deliveries, and heavy sales support might generate 30% gross margins on paper but single-digit net margins after cost-to-serve.
Map your customer base by gross margin AND cost-to-serve. You'll likely find that 20-30% of your customers are destroying margin, and 10-15% are far more profitable than your averages suggest. Adjust pricing, minimum order quantities, and service levels accordingly.
Shift Product Mix
If commodity products are compressing and specialty products aren't, shift investment toward specialty. This isn't a short-term fix, but it's the most sustainable long-term response.
For manufacturers, that might mean investing in custom or configured products that are harder to commoditize. For distributors, it means building value-added services (kitting, assembly, VMI programs) that create switching costs and support higher margins.
Close the Pricing Execution Gap
The 60-120 day lag between cost increases and price adjustments is pure margin destruction. Every day you sell at old prices with new costs, you're compressing your own margins.
The fix doesn't require enterprise pricing software. It starts with:
- Establishing a regular price review cadence (monthly, not annually)
- Monitoring supplier cost changes in real time, not when invoices arrive
- Setting pricing rules that automatically flag when margins drop below thresholds
- Empowering sales teams with floor prices they can't go below
McKinsey's research suggests that companies implementing systematic pricing processes see margin improvements of 2-7 percentage points, with initial benefits appearing in as little as 3-6 months.
Industry Benchmarks: Are Your Margins Actually Compressed?
It helps to know what "normal" looks like. Here are gross margin benchmarks for common distribution and manufacturing segments, based on industry data and Damodaran's NYU Stern research.
Distribution Gross Margins
| Segment | Healthy Range | Compressed Range | Severely Compressed |
|---|---|---|---|
| Electrical distribution | 22-28% | 18-22% | Below 18% |
| Industrial distribution | 25-32% | 20-25% | Below 20% |
| Building materials | 24-30% | 19-24% | Below 19% |
| HVAC distribution | 22-27% | 17-22% | Below 17% |
| Commodity/bulk | 15-20% | 10-15% | Below 10% |
Manufacturing Gross Margins
| Segment | Healthy Range | Compressed Range | Severely Compressed |
|---|---|---|---|
| Specialty chemicals | 35-45% | 28-35% | Below 28% |
| Industrial machinery | 30-40% | 24-30% | Below 24% |
| Auto parts/components | 20-28% | 15-20% | Below 15% |
| Metal fabrication | 25-35% | 20-25% | Below 20% |
| Food manufacturing | 25-35% | 20-25% | Below 20% |
If you're operating below the healthy range for your segment, compression has already done its damage. The question is whether it's temporary (costs will normalize) or structural (your market has permanently shifted).
According to Aprio's analysis of Q3 2024 results, even top-performing manufacturers dropped in overall profitability and operational efficiency, marking a continued decline from the boom profits of 2021. EBITDA margins contracted in 2022-2023 across most sectors, with only partial recovery in 2024 for building products and industrials, while transportation and electronic manufacturing continued to compress.
A Real-World Compression Scenario
Let's walk through a realistic example. Midwest Industrial Supply is a $75M industrial distributor carrying about 12,000 SKUs. Here's what margin compression looked like for them over three years.
Starting point (Year 1): 28.5% blended gross margin, $21.4M in gross profit.
Year 2 changes:
- Steel-based products (35% of revenue): supplier costs up 12%, prices raised 7%. Compression: ~1.75 points on those products
- Freight costs up 18% across all products, passed through about 40% via surcharges. Impact: ~0.6 points blended
- Top 3 customers (28% of revenue) renegotiated contracts, won average 2.5% price concession. Impact: ~0.7 points blended
Year 2 result: 25.8% gross margin. Down 2.7 points. Gross profit: $19.4M. That's $2M less profit on essentially the same revenue.
Year 3 changes:
- Raw material costs stabilized (compression stopped on the cost side)
- But competitive pressure continued as two competitors held lower prices
- Customer mix shifted toward larger, lower-margin accounts
- No systematic price increase process in place
Year 3 result: 24.3% gross margin. Down another 1.5 points. Gross profit: $18.2M. That's $3.2M less annual profit than Year 1.
Total Compression: 28.5% - 24.3% = 4.2 percentage points
Dollar Impact: $75M x 4.2% = $3.15M in lost annual gross profit
$3.15 million. Not because revenue dropped. Not because they made bad products. Because costs went up, prices didn't follow, and nobody had the data to see where the damage was accumulating.
This is the scenario Pryse is built for. Upload your transaction data, and in 24 hours you'll see exactly where compression is hitting, which product lines are bleeding margin, and which customers are driving the most damage. No six-month implementation. No $100K platform. Just answers.
How Margin Compression Connects to Broader Margin Health
Margin compression doesn't exist in isolation. It's one piece of your overall margin leakage picture. Here's how the pieces fit:
- Compression tells you costs are outpacing prices. It's the cost-side squeeze.
- Erosion tells you the problem is sustained and includes the revenue side. See margin erosion causes for the full breakdown.
- Leakage tells you profit is escaping through execution gaps: discounts, rebates, cost-to-serve, pricing errors.
- Margin analysis is the discipline of measuring all three and knowing which levers to pull.
Most mid-market companies experiencing compression are also experiencing erosion and leakage simultaneously. They just don't have the visibility to tell which is which. When your pricing lives in Excel and your cost data sits in your ERP, connecting the dots across 10,000 SKUs and 500 customers is practically impossible by hand.
That's the gap Pryse closes. A one-time diagnostic that quantifies your margin compression, identifies the biggest sources, and puts a dollar figure on the opportunity. If you're seeing margins slip and want to know exactly why, start your diagnostic today.
Frequently Asked Questions
What is margin compression?
Margin compression is the narrowing of profit margins caused when a company's costs rise faster than its prices. In distribution and manufacturing, it typically happens during periods of input cost inflation, freight rate increases, or material shortages, especially when competitive pressure prevents full cost pass-through to customers.
What causes margin compression in distribution?
The four main causes are rising input costs (materials, freight, labor), competitive pricing pressure that limits price increases, customer concentration giving large buyers negotiating power, and product commoditization that shifts competition to price. Slow pricing execution, where there's a 60-120 day lag between cost increases and price adjustments, is an internal cause that most companies underestimate.
How is margin compression different from margin erosion?
Margin compression is primarily a cost-side problem that can be cyclical (costs spike, then normalize). Margin erosion is broader, encompassing both rising costs and falling prices, and tends to be gradual and structural. Compression is one component of erosion. Both fall under the umbrella of margin leakage. See our full comparison of margin erosion vs. margin leakage.
How do you calculate margin compression?
Compare gross margin percentages across time periods. The formula is: Prior Period GM% minus Current Period GM%. To calculate the dollar impact, multiply your revenue by the compression percentage. For a detailed approach including margin bridge analysis, see our margin analysis guide.
Compression = Prior Period GM% - Current Period GM%
Dollar Impact = Total Revenue x Compression %
Can you reverse margin compression?
Yes. Bain & Company research shows that building pricing capabilities can add 200-600 basis points to a company's bottom line. The most effective tactics are targeted price increases on low-elasticity items, supplier renegotiation, cost-to-serve optimization, and closing the gap between cost changes and price adjustments. Most mid-market companies recover meaningful margin within 3-6 months of implementing systematic pricing processes.
What is a normal gross margin for distributors and manufacturers?
Wholesale distributors typically run 20-30% gross margins, with specialty distributors reaching 35-40% and commodity distributors running 15-20%. Manufacturers range from 20-45% depending on the sector. According to NYU Stern's industry data, manufacturing and distribution consistently show lower gross margins than technology or services sectors because of the inherent cost of making and moving physical goods.
How does margin compression relate to margin leakage?
Margin leakage is the umbrella term for all the ways profit escapes a business. Margin compression (cost-side pressure) and margin erosion (price-side decline) are both components of leakage. A complete leakage analysis also includes unauthorized discounts, rebate mismanagement, pricing errors, and cost-to-serve imbalances. Our margin leakage guide covers the full framework.
Last updated: January 29, 2026
Frequently Asked Questions

Want to analyze your entire product catalog?
Pryse automatically identifies margin leakage across thousands of SKUs. Upload your data and find hidden profit in 24 hours.
One-time $1,499 diagnostic. No subscription required.