9 Causes of Margin Leakage in Distribution and Manufacturing
Margin leakage has identifiable root causes. Here are the 9 most common ones we see in mid-market distributors and manufacturers, with real numbers and fixes.
Margin leakage is profit lost through price erosion, uncontrolled cost increases, or both. It happens at the transaction level, accumulates across thousands of line items, and rarely shows up in standard P&L reports until the damage is already done.
In our analysis of mid-market distributors and manufacturers ($20M-$200M in revenue), margin leakage typically accounts for 2-5% of total revenue. On a $75M distribution company, that's $1.5M to $3.75M in profit that's gone before anyone notices.
The problem isn't that companies have margin leakage. Every company does. The problem is that most companies don't know where it's coming from. And without knowing the cause, every fix is a guess.
This article breaks down the nine most common causes of margin leakage we see in distribution and manufacturing businesses, with the numbers behind each one.
For a broader view of what margin leakage is and how to measure it, see our margin leakage guide.
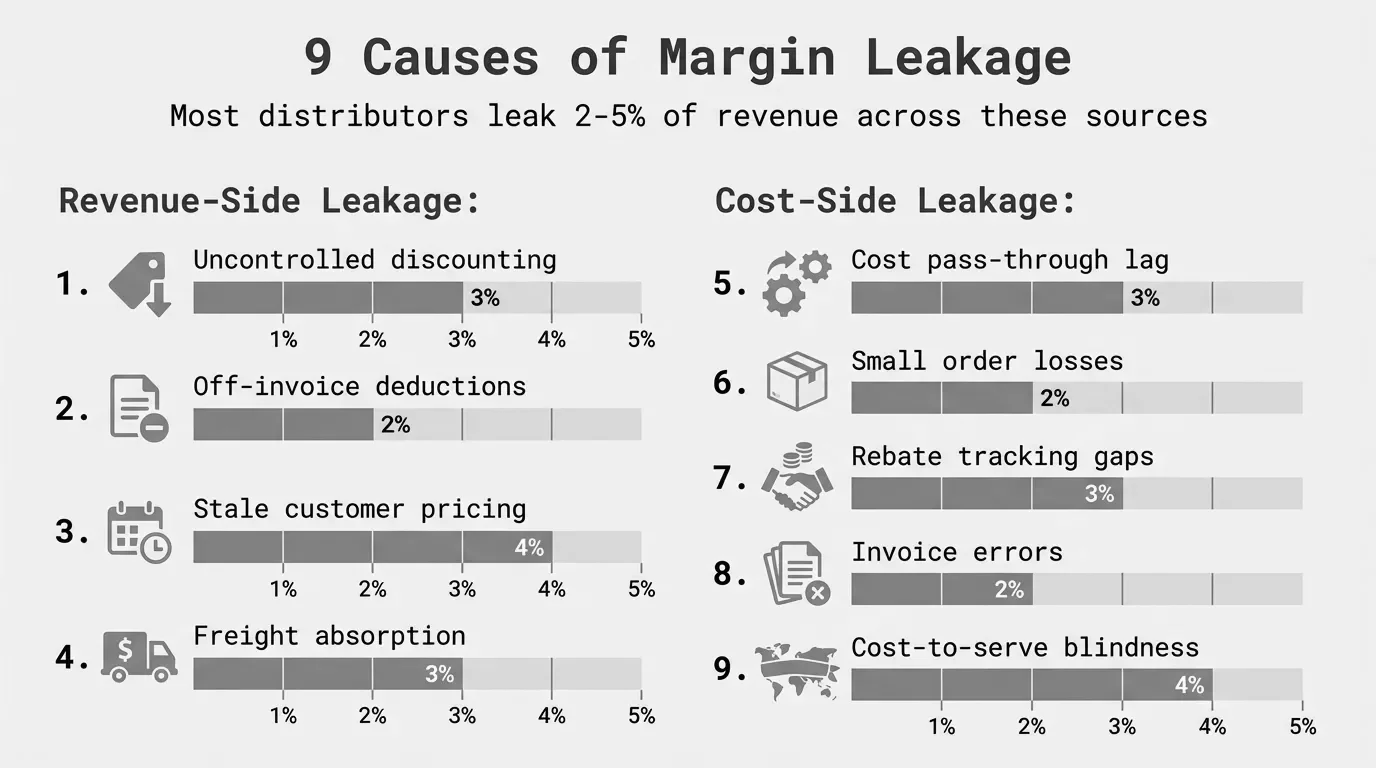
1. Uncontrolled Discounting by Sales Teams
This is the single biggest source of margin leakage in distribution. It's also the most politically sensitive, which is why it persists.
Here's how it works: Sales reps have discount authority (either explicit or informal). They use it to close deals, keep customers, or hit volume targets. Each individual discount seems reasonable. But when you add them up across every rep and every deal, the numbers get ugly.
McKinsey found that in one industrial company, a single sales territory was applying 5-7% more in off-invoice discounts than any other territory, with zero corresponding increase in volume. That territory's discount behavior was invisible in aggregate reports. It only showed up when someone analyzed transactions rep by rep.
The math on this is straightforward but painful:
Annual Revenue Impact = Average Excess Discount % x Revenue per Territory x Number of Affected Territories
For a $50M distributor with 8 territories, if 3 territories are over-discounting by an average of 3%, that's:
0.03 x ($50M / 8) x 3 = $562,500 per year
That's pure margin loss. The product shipped, the customer paid (less), and nobody flagged it.
Common patterns we see:
- Reps defaulting to the maximum authorized discount on every deal
- Discounts given to retain customers who weren't actually at risk of leaving
- Stacking discounts (volume discount + promotional discount + "relationship" discount)
- Quoting lower prices verbally and adjusting invoices after the fact
The fix isn't eliminating discounts. It's making discount patterns visible and setting guardrails. When sales leaders can see that Rep A averages 18% off list while Rep B averages 11% off list and both sell comparable volumes, the conversation becomes specific rather than abstract.
2. Off-Invoice Deductions Nobody's Tracking
This is the sneaky one. On-invoice discounts are visible. Off-invoice costs are not. They live in different systems, get charged to different cost centers, and rarely get attributed back to specific customers or transactions.
A price waterfall analysis makes this visible. It shows how list price erodes to invoice price (on-invoice discounts) and then how invoice price erodes further to pocket price (off-invoice deductions).
McKinsey's classic study of a lighting manufacturer found 16.3 percentage points of margin erosion that never appeared on any invoice. The pocket price was roughly half the list price, and most of the damage was off-invoice.
Common off-invoice deductions in distribution and manufacturing:
| Deduction Type | Typical Impact | Where It Hides |
|---|---|---|
| Volume rebates (annual) | 1-5% of revenue | Accruals in AP/finance |
| Freight absorption | 2-8% per shipment | Logistics/shipping budget |
| Early payment discounts taken | 1-2% per transaction | AR/collections |
| Cooperative advertising | 0.5-3% of revenue | Marketing budget |
| Returns and allowances | 1-4% of revenue | Customer service/warehouse |
| Special handling/packaging | 0.5-2% per order | Operations budget |
None of these show up on the sales invoice. None of them get attributed to the customer in most ERP systems. But every one of them reduces what you actually pocket from the sale.
A $100M distributor with 3% in untracked off-invoice deductions is leaving $3M in margin unmanaged. Not necessarily lost, but unmanaged. Nobody's deciding whether those costs are worth it for each specific customer.
3. Stale Pricing That Doesn't Reflect Cost Changes
Cost of goods doesn't stay still. Raw materials fluctuate. Supplier price increases land quarterly or annually. Freight surcharges change. Energy costs spike. Tariffs shift.
The question is: how fast do your prices follow?
For most mid-market distributors and manufacturers, the honest answer is "not fast enough." Many companies update pricing annually, sometimes semi-annually. A few review quarterly. Almost none adjust in real-time.
The gap between when costs rise and when prices follow is margin leakage by definition:
Leakage per SKU = (New Cost - Old Cost) x Units Sold During Lag Period
Consider a distributor with 15,000 SKUs. A supplier sends a 4% price increase effective March 1. The distributor's pricing team reviews it, updates the ERP, and rolls out new prices to customers by April 15. That's 45 days of selling at the old price on the new cost.
If those SKUs represent $8M in annual revenue and the cost increase is 4%, the lag costs:
$8,000,000 x 0.04 x (45 / 365) = $39,452
That's one supplier. Most distributors have dozens of suppliers, each with their own increase cycles. Across an entire product portfolio, pricing lag easily costs 0.5-1.5% of revenue per year.
The Bain & Company 2024 B2B pricing survey found that 45% of companies were not passing through cost increases quickly enough to preserve margins. The companies that did pass through costs faster saw margin improvement. The ones that didn't saw erosion.
4. Customer-Level Margin Disparity
Not all customers are equally profitable. That's obvious in theory. In practice, most companies don't know which customers are the least profitable, let alone why.
When we run customer-level margin analysis on distribution data, here's what we typically find:
- The top 20% of customers by revenue generate 150-200% of total profit
- The bottom 20% of customers by margin actually destroy 30-50% of total profit
- The middle 60% roughly break even after full cost allocation
This distribution isn't surprising. What's surprising is the size of the gap. The worst customers aren't just unprofitable. They're significantly unprofitable, often at negative pocket margins once you allocate freight, returns, small-order handling, and service costs.
A common scenario: A $40M industrial distributor has 850 active customers. Sorting by pocket margin reveals 120 customers (14%) operating below a 5% margin floor, and 40 of those (5%) are at negative margins after cost-to-serve allocation. Those 40 customers represent $4.2M in revenue but negative $180K in profit. They're consuming margin generated by profitable accounts.
The cause is usually a combination of factors we cover elsewhere in this article: aggressive discounts locked in years ago, high freight costs from remote locations or small orders, above-average return rates, and pricing that was never updated when costs changed.
The fix starts with visibility. You can't fix customer profitability you can't see. For more on this approach, see our guide on margin analysis.
5. Freight and Logistics Absorption
Freight is one of the most common margin leaks for distributors and manufacturers because it's treated as a cost of doing business rather than a pricing variable.
Here's how it happens: A sales rep offers "free shipping" to win a deal. Or the company has a blanket policy of free freight over a certain order size. Or a customer in a remote location gets the same freight terms as one 30 miles from the warehouse. In all cases, the cost is real but invisible in the customer's pricing.
Since 2020, freight costs have been volatile. Fuel surcharges, carrier rate increases, and capacity constraints have pushed logistics costs up 15-30% for many distributors. But freight policies haven't kept pace. A free shipping threshold set when freight was $8/hundredweight doesn't work when it's $12/hundredweight.
The numbers matter. For a typical industrial distributor, freight runs 3-7% of revenue. If half of that is absorbed (not billed to customers), that's 1.5-3.5% of revenue in margin leakage from freight alone.
Where it gets worse:
| Order Profile | Freight Cost as % of Order | Margin Impact |
|---|---|---|
| Full truckload, nearby | 2-4% | Manageable |
| LTL, medium distance | 5-8% | Erodes margin |
| Small parcel, remote | 10-18% | Can wipe out margin |
| Emergency/expedited | 15-30% | Almost always unprofitable |
Companies with blanket free-freight policies are subsidizing their high-cost customers with margin from their low-cost ones. The customer 20 miles from the warehouse is paying the same price as the customer 600 miles away, but the cost to serve them is dramatically different.
6. Rebate and Incentive Mismanagement
Rebate programs are supposed to drive volume and reward loyalty. In practice, they often leak margin because they're poorly structured, rarely audited, and difficult to track.
Three common problems:
Rebates paid without volume thresholds being met. Annual volume rebates are accrued based on projected volume. The customer gets quarterly or annual payments. But if actual volume falls short of projections, the rebate rate should adjust. In many companies, it doesn't. The rebate gets paid at the higher rate because nobody reconciled the accrual.
Stacked rebate programs nobody oversees. A customer qualifies for a growth rebate, a loyalty rebate, and a promotional rebate simultaneously. Each program was designed independently. Combined, they reduce the effective price below the margin floor. A 2% growth rebate plus a 1.5% loyalty rebate plus a 3% promotional rebate is 6.5% off pocket price. On a product line with 22% gross margins and 5% operating margins, that rebate stack just ate all the operating profit.
Legacy rebate agreements still active. We regularly see rebate agreements from 3-5 years ago that nobody's reviewed. The customer's buying pattern changed, the cost structure changed, but the rebate terms didn't. A 3% rebate that made sense when COGS was 60% of list doesn't make sense when COGS is now 68% of list.
Rebate leakage is hard to quantify without clean data, but in distribution businesses with active rebate programs, we typically see 0.5-2% of revenue in rebate-related margin leakage.
7. Small Order and Minimum Quantity Problems
Every order has a fixed cost to process: pick, pack, ship, invoice, collect. That fixed cost doesn't change much whether the order is $200 or $20,000. Which means small orders are disproportionately expensive.
The math is simple:
Cost to Process One Order = Warehouse Labor + Packing Materials + Freight + Invoice Processing + AR Management
For most distributors, this cost runs $25-$75 per order, depending on complexity. On a $5,000 order, that's 0.5-1.5% of revenue. On a $200 order, that's 12.5-37.5% of revenue.
Now consider a distributor processing 150 orders per day. If 30% of those orders are under $500, and the average processing cost is $45:
Daily Small Order Cost = 150 x 0.30 x $45 = $2,025
Annual Small Order Cost = $2,025 x 250 working days = $506,250
Half a million dollars per year in processing costs for orders that, in many cases, barely cover their COGS. If those small orders average 20% gross margin and $350 in value, the gross profit per order is $70. Minus $45 in processing costs, the contribution is $25 before any allocated overhead. If the customer also gets free freight ($15-$30 for small parcel), the order is breakeven or underwater.
Most companies know they have a small-order problem. Few know how big it is, because they don't track cost-to-serve at the order level.
Solutions include minimum order quantities, small-order surcharges, web-only ordering for small quantities, or restructured pricing that builds handling costs into the unit price for small-quantity SKUs. But you can't right-size the policy without first measuring the problem.
8. Invoice Errors and Billing Discrepancies
This one is boring but real. Pricing errors on invoices are a direct margin leak, and they almost always go in the customer's favor.
Think about why. If you overcharge a customer, they call to complain and you issue a credit. If you undercharge a customer, nobody says a word. The error sticks. You shipped the product, sent the invoice, and collected less than you should have.
Common sources of invoice error in distribution:
- Price file updates that didn't sync to the ERP
- Customer-specific pricing that overrides should-be-higher list prices
- Old quotes honored past their expiration date
- Manual price overrides entered incorrectly
- Promotional pricing that wasn't removed after the promotion ended
The error rate on pricing in distribution is higher than most people assume. Studies of B2B transaction data suggest 1-3% of invoices contain pricing errors, and the net direction of those errors favors the customer.
On a $60M distributor processing 40,000 invoices per year, if 2% contain a pricing error averaging $85 in the customer's favor:
Annual Invoice Error Leakage = 40,000 x 0.02 x $85 = $68,000
That's a modest number on its own. But it compounds with every other source of leakage on this list. And because nobody's checking, the errors persist invoice after invoice for the same customers.
The more complex your pricing structure (customer-specific pricing, contract pricing, tiered discounts, promotional pricing), the more likely errors become. A distributor with 15,000 SKUs and 500 active price lists has 7.5 million potential price points. The odds that all of them are correct at any given time are approximately zero.
9. Cost-to-Serve Gaps in Pricing
This is the systemic cause that underlies several of the others. Most companies price based on product cost and target margin. Very few price based on the total cost to serve a customer.
Cost-to-serve includes everything it takes to win, fulfill, and support a customer's business:
| Cost Element | What It Includes | Varies By |
|---|---|---|
| Sales cost | Rep time, travel, entertainment | Customer complexity, location |
| Order processing | Entry, picking, packing, checking | Order frequency, line count |
| Logistics | Freight, delivery, fuel | Distance, order size, frequency |
| Returns/warranty | Processing, restocking, credits | Product type, customer behavior |
| Customer service | Calls, emails, technical support | Customer sophistication |
| Payment terms | Carrying cost of AR | Days to pay, credit risk |
| Special services | Custom packaging, labeling, kitting | Customer requirements |
Two customers buying $500K per year at the same price and discount level can have wildly different profitability. Customer A orders weekly in standard quantities, pays in 30 days, returns 1% of product, and is 50 miles from the warehouse. Customer B orders daily in small quantities, pays in 60 days, returns 6% of product, and is 400 miles away.
Same revenue. Same gross margin on paper. Dramatically different pocket margin after cost-to-serve.
When pricing doesn't account for cost-to-serve, low-cost customers subsidize high-cost ones. The company's average margin looks OK, but the distribution is bimodal: some customers are very profitable and some are very unprofitable.
McKinsey's research on distribution pricing found that companies managing all elements of the price waterfall, including cost-to-serve, can capture 1-2% additional margin. For a $50M distributor, that's $500K to $1M. For a $150M manufacturer, it's $1.5M to $3M.
How These Causes Compound
These nine causes don't operate independently. They stack. A customer might get an aggressive discount (Cause 1), plus a volume rebate that wasn't reconciled (Cause 6), plus free freight to a remote location (Cause 5), on a product whose price wasn't updated after the last cost increase (Cause 3). Each individual leakage might be 2-3%. Combined, they're 10-12%.
On a 22% gross margin product, that turns a profitable transaction into a breakeven or losing one.
The compounding effect is why aggregate margin analysis misses most leakage. When you look at total gross margin, the profitable transactions mask the losers. It's only at the transaction level, customer by customer and SKU by SKU, that the pattern becomes clear.
McKinsey's data backs this up. Across a database of 130 global distributors, they estimated that a 1% price increase yields a 22% increase in EBITDA margins. The flip side is equally true: a 1% price erosion from accumulated leakage cuts EBITDA by a comparable amount. When distributors operate on 3-5% net margins, small percentages aren't small. They're existential.
Finding Your Specific Leakage Sources
Knowing the nine causes is useful. Knowing which ones are actually draining your margin is actionable.
The starting point is transaction-level data. You need every invoice line item, with the following:
- List price and invoice price (to measure on-invoice discounting)
- Customer-specific pricing and contract terms
- Rebate accruals and payments by customer
- Freight costs by shipment
- Returns and credits by customer
- Payment terms and actual days-to-pay
With that data, you can build a price waterfall analysis that shows exactly where margin erodes from list price to pocket price. The biggest bars in the waterfall are your biggest leakage sources.
For most distributors, the data already exists. It's in the ERP, the TMS, the rebate system, and the AR system. The challenge is pulling it together and analyzing it at the transaction level rather than the aggregate.
That's exactly what Pryse does. Upload your transaction data, and within 24 hours you'll have a waterfall showing where your margin is going, which customers and products are leaking, and the dollar opportunity in each category.
Key Takeaways
Margin leakage in distribution and manufacturing comes from nine primary sources, all of which are identifiable and fixable with the right data:
- Uncontrolled discounting erodes margin at the point of sale
- Off-invoice deductions hide erosion across multiple systems
- Stale pricing creates gaps between cost changes and price changes
- Customer-level disparity means some customers destroy profit
- Freight absorption transfers logistics costs to your margin
- Rebate mismanagement pays out more than intended
- Small order costs make low-value transactions unprofitable
- Invoice errors systematically undercharge customers
- Cost-to-serve gaps let high-cost customers hide behind averages
The common thread is visibility. Most companies know margin leakage exists in theory. Few can quantify where it comes from in practice. The difference between the two is the difference between hoping margins improve and actually improving them.
Frequently Asked Questions
What is margin leakage?
Margin leakage is profit lost through price erosion (revenue leakage) and uncontrolled cost increases (margin compression). It happens at the transaction level and accumulates across customers, products, and time periods. Most margin leakage is invisible in standard P&L reports because it's buried in the gap between list price and pocket price.
How much margin leakage is normal?
There's no "normal," but there are benchmarks. McKinsey found that the gap between invoice price and pocket price is 15-30% for most B2B companies. For distributors operating on 2-5% net margins, even the low end of that range represents a significant share of total profit. Most mid-market distributors we analyze have 2-5% of revenue in addressable margin leakage.
What is the fastest way to find margin leakage?
Build a price waterfall. Take your transaction data, calculate list price to invoice price to pocket price, and look at the gaps by customer segment and product line. The largest gaps point directly to the causes. A basic waterfall analysis in Excel works for a starting point, though it gets difficult with more than a few thousand SKUs.
Is margin leakage the same as revenue leakage?
They're related but different. Revenue leakage is money you should have collected but didn't (unbilled services, pricing errors, missed charges). Margin leakage is broader. It includes revenue leakage plus cost-side erosion: freight absorption, cost-to-serve gaps, rebate overpayment, and any cost that reduces the margin on a transaction below what was intended.
How do I prioritize which leakage sources to fix first?
Start with the biggest dollar impact, not the biggest percentage. A 1% leakage on your highest-volume product line will matter more than a 5% leakage on a niche product. Then prioritize by ease of fix. Pricing errors and stale pricing are usually quick wins. Restructuring customer agreements and freight policies takes longer but delivers larger sustained improvements.
Last updated: January 29, 2026
Frequently Asked Questions

Want to analyze your entire product catalog?
Pryse automatically identifies margin leakage across thousands of SKUs. Upload your data and find hidden profit in 24 hours.
One-time $1,499 diagnostic. No subscription required.