10 Causes of Margin Erosion in Distribution and Manufacturing (With Real Numbers)
Margin erosion costs distributors 2-12% of profit annually. Here are 10 specific causes, how to detect each one in your data, and what they actually cost.
Margin erosion is the gradual decline in profit margins over time, caused by rising costs outpacing price increases, pricing mistakes that go undetected, competitive pressure that forces prices down, or some combination of all three.
It's the most common profit problem in distribution and manufacturing, and the hardest to see. Revenue keeps growing. Orders keep flowing. But the spread between cost and selling price quietly narrows, quarter after quarter, until the P&L forces a conversation nobody wanted to have.
In our analysis of mid-market distributors and manufacturers ($20M-$200M revenue), we consistently find margin erosion of 2-5 percentage points that leadership didn't know existed. That's not a rounding error. On $80M in revenue, 3 points of margin is $2.4M walking out the door every year.
This article breaks down the 10 most common causes of margin erosion, split between internal causes you control and external ones you don't. For each, we'll show what it looks like in real numbers, how to detect it in your own data, and what it actually costs.
For a broader look at how margin loss works, see our complete guide to margin leakage.
How Margin Erosion Works
Before getting into the causes, it helps to understand the math.
Margin Erosion Rate = (Prior Period Margin % - Current Period Margin %) / Prior Period Margin % x 100
If your gross margin was 28% two years ago and it's 25.5% today, your erosion rate is 8.9%. That might sound small, but on a $50M business it's $1.25M in annual profit that vanished.
Margin erosion compounds. A 1-point decline this year makes next year's starting position worse. Over five years, small annual declines stack into material profit loss.
| Starting Gross Margin | Annual Erosion | Margin After 5 Years | Cumulative Profit Lost (on $50M revenue) |
|---|---|---|---|
| 28% | 0.5 points/yr | 25.5% | $3.1M |
| 28% | 1.0 points/yr | 23.0% | $6.3M |
| 28% | 2.0 points/yr | 18.0% | $12.5M |
| 25% | 1.0 points/yr | 20.0% | $5.6M |
McKinsey research shows that a 1% improvement in price yields an 8% improvement in operating profit, assuming volume holds. The reverse is also true: small price declines hit profit hard because they drop straight to the bottom line.
Internal Causes of Margin Erosion
These are the causes you can control. They're also the ones most mid-market companies overlook because they happen inside your own pricing, operations, and sales processes.
1. Unmanaged Discounting and Deal Exceptions
This is the number one margin killer in distribution. Sales reps give discounts to close deals, and nobody tracks the cumulative impact.
Here's how it plays out. Your list price on a product is $100. Standard margin is 28%. A rep gives a customer 5% off to win the order. Then another rep matches that discount for a different customer. Within six months, three more reps have heard about the lower price and started quoting it as their baseline.
That 5% discount on a 28% margin product doesn't reduce margin by 5%. It reduces it by 17.8% (from 28% to 23%). On a product line doing $5M in annual revenue, that's $250K in lost margin from a single discount that spread.
Zilliant research shows that B2B distributors lose between 2% and 11.7% of profit annually from misaligned and inconsistent pricing. The wide range reflects how much worse the problem gets when there are no guardrails.
How to detect it: Pull margin reports by sales rep for the same product categories. If there's more than a 5-point spread between your highest-margin and lowest-margin reps on similar products, you have a discounting problem. Also look at average discount depth over time. If it's creeping up quarter over quarter, erosion is underway.
2. Failure to Pass Through Cost Increases
Supplier costs go up. You absorb the increase. Margins shrink.
This sounds obvious, but it's shockingly common. In our analysis, roughly 60% of mid-market distributors don't have a systematic process for reviewing and passing through cost increases. They react to big, visible increases (steel up 30%) but miss the steady 2-4% annual creep across hundreds of product lines.
A distributor carrying 15,000 SKUs might receive 200+ supplier cost increases per year. If the pricing team only updates prices on the ones they notice, 30-50% of those increases get absorbed silently.
Absorbed Cost Increase = (New Supplier Cost - Old Supplier Cost) x Units Sold at Old Price
A $50M distributor absorbing just 2% of cost increases across their catalog gives up $1M in annual margin without anyone making a conscious decision to do so.
How to detect it: Compare supplier cost change dates against your price change dates for the same items. Calculate the lag in days. Then multiply the lag by daily unit sales volume at the old margin. That's your absorption cost. If the average lag exceeds 30 days, you're bleeding money.
3. Customer Mix Shift
Not all customers generate the same margin. When your revenue mix shifts toward lower-margin customers, overall margins erode even if individual account pricing stays flat.
This happens naturally as your largest accounts grow faster (they typically negotiate harder on price) while smaller, higher-margin accounts stay flat or churn. A common pattern: your top 10 accounts grow from 35% to 45% of revenue over three years. Those accounts run 22% gross margin. Your other accounts run 30%. The mix shift alone drops blended margin by 0.8 points.
| Customer Segment | % of Revenue (Year 1) | % of Revenue (Year 3) | Gross Margin | Impact |
|---|---|---|---|---|
| Top 10 accounts | 35% | 45% | 22% | Dragging margin down |
| Mid-tier accounts | 40% | 35% | 28% | Stable but shrinking share |
| Small accounts | 25% | 20% | 32% | Highest margin, lowest growth |
| Blended margin | 26.5% -> 25.3% | -1.2 points |
How to detect it: Run a customer margin analysis quarterly. Track each customer segment's share of revenue and its margin. If your highest-volume segment is also your lowest-margin segment, and that segment is growing faster than the rest, your blended margin will keep falling regardless of what you do on pricing.
4. Product Mix Deterioration
Same concept as customer mix, applied to products. When commodity or low-margin SKUs grow faster than specialty or high-margin SKUs, blended margins decline.
This is particularly common in distribution when you add product lines to win larger orders. A building materials distributor might add commodity lumber to supplement their specialty fastener business. Lumber does $8M at 14% margin. Fasteners do $12M at 32% margin. Revenue looks great. Blended margin dropped from 32% to 24.8%.
The problem accelerates when sales compensation is based on revenue, not margin. Reps naturally gravitate toward easy-to-sell, high-volume commodity products because it hits their targets faster.
How to detect it: Run a product margin analysis that shows margin contribution by product category over time. Build a margin waterfall showing how product mix changes affect blended margin quarter over quarter. If your fastest-growing categories are also your thinnest-margin categories, the trend won't fix itself.
5. Cost-to-Serve Blindness
You know what you pay for products. You probably don't know what it costs to serve each customer.
A customer ordering full pallets on a predictable schedule costs far less to serve than one placing 50 small orders per month with next-day delivery requirements and frequent returns. Yet most distributors price both customers using the same margin targets.
Carrying costs alone run between 15% and 30% of total inventory value for most distributors. When customers demand you stock specialty items for them that turn slowly, those carrying costs eat margin that never shows up on a standard P&L review.
Typical cost-to-serve components that go untracked:
| Cost Component | Range (% of revenue) | Often Tracked? |
|---|---|---|
| Freight and delivery | 2-6% | Sometimes |
| Order processing (small orders) | 1-3% | Rarely |
| Returns and credits | 0.5-2% | Sometimes |
| Inventory carrying (customer-specific stock) | 1-3% | Almost never |
| Rush/expedited orders | 0.5-1.5% | Rarely |
| Technical support and presales | 1-2% | Almost never |
A customer generating 25% gross margin on paper might actually produce 15% net margin after cost-to-serve. If that customer is one of your largest, the impact on total profitability is significant.
How to detect it: Pick your top 20 accounts by revenue. Calculate total margin on each one, then subtract estimated delivery costs, return costs, order processing costs (especially for high-frequency, small-dollar orders), and any dedicated inventory you hold. Rank them by true profitability, not gross margin. The reordering is usually a surprise.
6. Rebate and Incentive Leakage
Supplier rebates, volume incentives, and promotional allowances can represent 1-3% of revenue for distributors. When you don't earn, claim, or correctly apply these to your margin calculations, the money simply disappears.
McKinsey's research found that off-invoice price leakages can add up to 16.3% of the standard list price. These leakages include rebates, promotional allowances, freight allowances, and other post-transaction adjustments that tend to be scattered across divisions and left unmanaged.
Common ways rebate dollars leak:
- Missing volume thresholds by small amounts because nobody tracked progress mid-quarter
- Failing to submit claims within supplier deadlines
- Not applying earned rebates back to product-level margin calculations, so pricing decisions are made on understated margins
- Stacking customer discounts on top of already-promotional pricing without recognizing the rebate is funding the promotion
A $30M distributor with 2% of revenue in available rebates who captures only 70% of what they're entitled to leaves $180K on the table annually.
How to detect it: Audit every supplier rebate program you participate in. Compare earned vs. claimed amounts for the last four quarters. Check whether rebate income is allocated back to product-line margin reporting or sits in a separate "other income" bucket where it doesn't inform pricing decisions.
External Causes of Margin Erosion
These causes originate outside your company. You can't prevent them, but you can detect them faster and respond before they eat margin for months.
7. Raw Material and Input Cost Volatility
If you manufacture or distribute products tied to commodity inputs, cost swings will compress margins unless you adjust prices in near-real-time.
Steel, copper, resin, lumber, and fuel are the usual suspects. The World Bank reported that raw material prices spiked 45% in 2022, then dropped roughly 21% in 2023, but didn't return to pre-spike levels. Manufacturers who didn't raise prices during the spike lost margin immediately. Those who did raise prices but didn't lower them during the correction gained margin temporarily but risked volume loss.
ISM forecast a 3.2% increase in raw material prices in early 2024. Manufacturing labor costs hit $33.70 per hour by late 2023, up 21% from January 2019. These aren't one-time events. They're persistent, compounding cost pressures.
Material Margin Impact = (Current Material Cost - Baseline Material Cost) / Selling Price x 100
A manufacturer with 35% gross margin selling a product at $200, where materials represent $80 of the $130 cost base: if material costs rise 10% ($8), and the selling price doesn't move, gross margin drops from 35% to 31%. That's a 4-point hit from a single input category.
How to detect it: Track material cost indices for your top 10 input categories monthly. Compare the rate of cost increase against the rate of your price increases over the same period. If costs are rising faster than prices, margin is eroding. Simple, but most companies don't do it systematically across their full product range.
8. Competitive Price Pressure
When a competitor drops prices, the market usually follows. This happens in waves: one player undercuts the market, others match to avoid losing accounts, and the new lower price becomes the baseline.
In commoditized segments of distribution and manufacturing, this race-to-the-bottom dynamic is constant. Bain & Company has noted that except in monopoly or oligopoly markets, prices tend to fall over the lifecycle of any product category. The question isn't whether competitive pressure will compress margins. It's how fast and how much.
The pattern is especially damaging for distributors when:
- An online competitor enters with lower overhead and thinner margin requirements
- A large national distributor buys a regional competitor and uses scale pricing to win market share
- A manufacturer starts selling direct, cutting out the distributor entirely (disintermediation)
The Deloitte 2025 MarginPLUS study found that 43% of companies cited competitor actions as a top trigger for cost transformation programs, tied with inflation as the most common trigger.
How to detect it: Track win/loss rates by product category and customer segment. If you're losing more quotes than usual in specific categories, pull competitor pricing where available. Monitor your average selling price trend on high-volume SKUs. A steady decline in average selling price on stable products signals competitive pressure pulling your prices down.
9. Tariffs, Trade Policy, and Regulatory Costs
Tariffs act like a sudden cost increase that you may not be able to pass through to customers. A 10-25% tariff on imported components or materials can demolish margin on affected product lines overnight.
Beyond tariffs, regulatory compliance costs accumulate quietly: environmental reporting, safety certifications, product labeling requirements, and industry-specific regulations all add cost that rarely gets priced into the product.
A building materials distributor importing fasteners from Asia saw a 25% tariff applied to their product category. On a product with a $2.00 landed cost and a $3.00 selling price (33% gross margin), the tariff added $0.50 to cost. If the selling price stayed at $3.00, margin dropped from 33% to 16.7%. The options were: absorb the hit, raise prices and risk losing volume, or find domestic suppliers at potentially higher base costs.
How to detect it: Catalog every product line by country of origin and applicable tariff classification. Run a scenario model showing what happens to margin if tariff rates change by 5%, 10%, and 25%. This prep work takes a few days but prevents months of reactive scrambling when policy shifts occur.
10. Freight and Logistics Cost Inflation
Transportation and logistics costs have been on a structural uptrend. Diesel prices, driver shortages, carrier consolidation, and surcharge structures all push delivery costs higher.
For distributors, freight is typically 2-6% of revenue. When freight costs spike 15-20% in a year (as they did in 2021-2022), and your pricing doesn't adjust, that's 0.3-1.2 points of margin erosion from freight alone.
The problem compounds when you offer "free freight" above certain order thresholds. As freight costs rise, the threshold that once broke even now loses money on every shipment.
| Freight Scenario | Prior Cost | Current Cost | Revenue Impact | Margin Hit |
|---|---|---|---|---|
| Standard delivery (3-5 day) | 3.0% of revenue | 3.8% of revenue | None | -0.8 points |
| Free freight threshold ($500 orders) | Break-even at $500 | Loses money below $650 | None | -0.5 points |
| Expedited/next-day | 1.5% of relevant revenue | 2.2% of relevant revenue | None | -0.7 points |
| Combined freight erosion | -1.0 to -2.0 points |
How to detect it: Pull actual freight cost as a percentage of revenue by month for the last 24 months. Compare against the same metric from two years prior. If the percentage is climbing and your pricing hasn't adjusted, freight is eroding margin. Break it down by delivery method (standard, expedited, customer pickup) to see where the worst bleeding is.
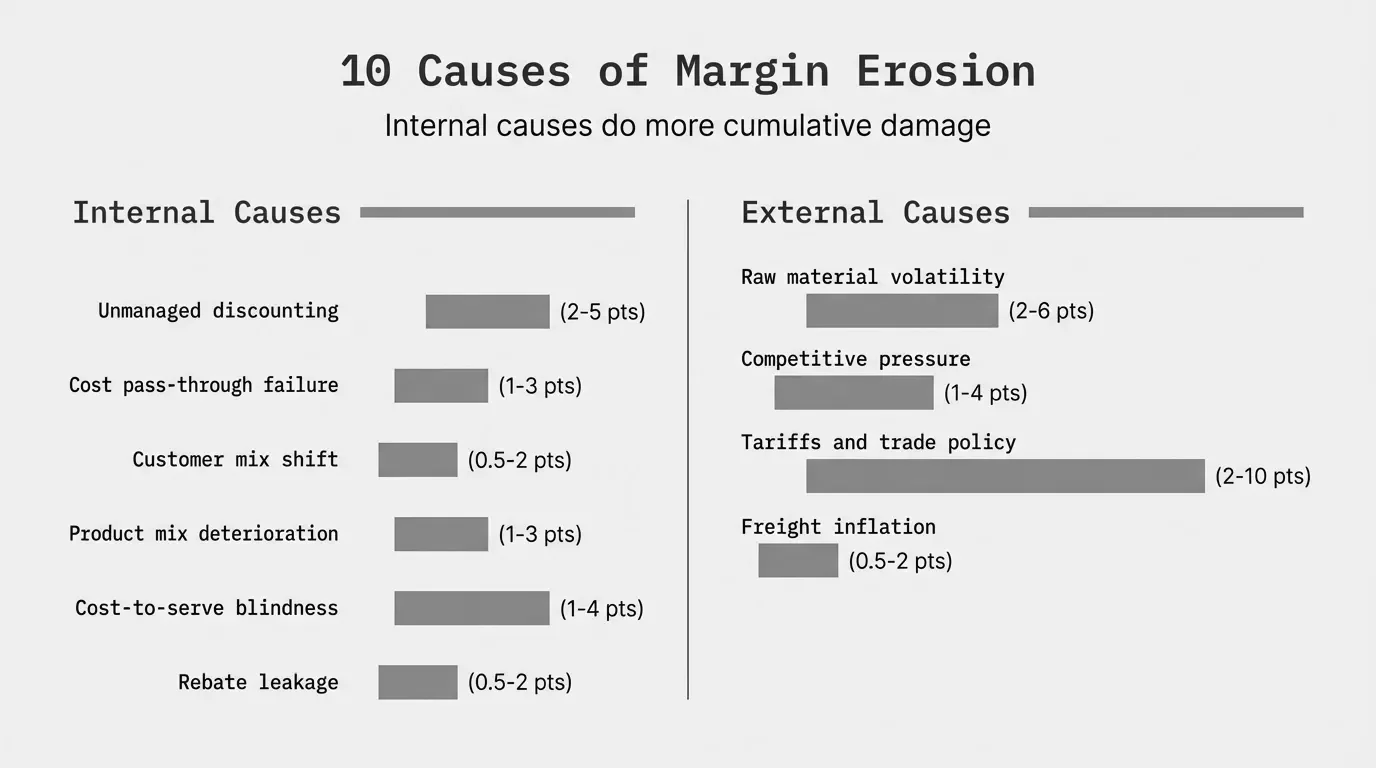
Internal vs. External: What Causes the Most Damage?
In practice, internal causes do more cumulative damage because they're persistent and compound over years without detection. External causes tend to be more visible (everyone notices when steel prices spike) and get addressed faster.
| Cause Type | Typical Margin Impact | Detection Difficulty | Speed of Impact |
|---|---|---|---|
| Internal Causes | |||
| Unmanaged discounting | 2-5 points | Hard (hidden in transaction data) | Gradual |
| Failure to pass through cost increases | 1-3 points | Medium | Gradual |
| Customer mix shift | 0.5-2 points | Medium | Slow |
| Product mix deterioration | 1-3 points | Medium | Slow |
| Cost-to-serve blindness | 1-4 points | Hard | Always present |
| Rebate leakage | 0.5-2 points | Hard | Ongoing |
| External Causes | |||
| Raw material volatility | 2-6 points | Easy (visible) | Fast |
| Competitive pressure | 1-4 points | Medium | Gradual |
| Tariffs and trade policy | 2-10+ points | Easy (visible) | Sudden |
| Freight inflation | 0.5-2 points | Easy | Gradual |
The companies that lose the most margin are the ones where multiple causes stack. Unmanaged discounting (3 points) plus absorbed cost increases (2 points) plus customer mix shift (1 point) equals 6 points of erosion. On a $75M business, that's $4.5M in annual profit that nobody consciously decided to give away.
How to Detect Margin Erosion in Your Data
You don't need pricing software to find the first layer of erosion. You need your transaction data, a spreadsheet, and a few hours.
Start with these four analyses:
1. Margin trend by quarter. Plot gross margin percentage by quarter for the last 8-12 quarters. Is the line flat, rising, or declining? If it's declining, you have erosion. The slope tells you the rate.
2. Margin variance by sales rep. Pull average margin by rep for the same product categories. A spread greater than 5 points between your highest and lowest reps means discounting discipline is inconsistent.
3. Price-cost gap tracking. For your top 50 SKUs by revenue, compare how your selling price has changed vs. how your cost has changed over the last 24 months. Where cost has risen faster than price, margin eroded.
4. Customer profitability ranking. Rank your top 20 customers by gross margin percentage, not by revenue. Compare against the same ranking from two years ago. If the highest-revenue customers are also the lowest-margin customers, and they're growing, your blended margin will keep falling.
For a step-by-step approach to this analysis, see our guides on margin analysis and margin erosion vs. margin leakage.
Why Revenue Growth Masks Margin Erosion
This is the most dangerous aspect of margin erosion: it hides behind top-line growth.
A company growing revenue 8% per year while losing 1.5 margin points per year still shows increasing gross profit dollars for the first few years. Leadership sees growing revenue, growing gross profit dollars, and assumes the business is healthy. The percentage decline in margin gets buried in the excitement of the top line.
The math breaks down eventually. If you start at $50M revenue and 28% gross margin:
| Year | Revenue (8% growth) | Gross Margin % | Gross Profit $ |
|---|---|---|---|
| 1 | $50.0M | 28.0% | $14.0M |
| 2 | $54.0M | 26.5% | $14.3M |
| 3 | $58.3M | 25.0% | $14.6M |
| 4 | $63.0M | 23.5% | $14.8M |
| 5 | $68.0M | 22.0% | $15.0M |
Gross profit grew from $14M to $15M over five years. Looks fine. But if margin had stayed at 28%, year 5 gross profit would be $19.0M. The gap between what you earned ($15M) and what you should have earned ($19M) is $4M. Revenue growth masked $4M in annual margin erosion.
This is why tracking margin percentage is more important than tracking margin dollars. Dollars can mislead you. Percentages tell the truth.
What to Do About It
Identifying the causes is the first step. Fixing them requires different actions depending on the cause.
For internal causes, the playbook is straightforward:
- Discounting: Implement approval workflows for discounts above threshold levels. Track discount depth by rep. Review quarterly.
- Cost pass-through: Build a systematic process that flags supplier cost changes and triggers price reviews within 14 days.
- Mix management: Build margin goals into sales compensation alongside revenue goals. Track customer and product mix quarterly.
- Cost-to-serve: Calculate true margin on your top 20 accounts including all delivery, returns, and service costs. Reprice the unprofitable ones.
- Rebates: Assign ownership of every rebate program. Track progress monthly. Allocate earned rebates back to product margin reporting.
For external causes, it's about speed of detection and response:
- Input costs: Track commodity indices weekly for your top inputs. Set alerts for changes above 3%.
- Competitive pressure: Monitor win rates and average selling prices monthly. Don't match every price drop. Differentiate on service and availability where possible.
- Tariffs: Maintain a country-of-origin database for all products. Model tariff scenarios in advance.
- Freight: Review freight-as-percentage-of-revenue quarterly. Adjust free-freight thresholds when costs change.
A pricing diagnostic can quantify exactly where your margin is eroding and how much each cause is costing you. It takes the analysis from "we think margins are declining" to "we're losing $1.8M per year from these four specific causes, and here's the priority order for fixing them."
Frequently Asked Questions
What is margin erosion?
Margin erosion is the gradual decline in profit margins over time. It happens when the gap between what you sell for and what it costs you narrows, either because costs rise faster than prices or because pricing decisions (discounts, customer mix, product mix) reduce the average margin earned. It's different from a one-time margin hit because it compounds over time.
What is the single biggest cause of margin erosion?
For distributors and manufacturers, unmanaged discounting causes the most damage. Industry data shows distributors lose 2-12% of annual profit from inconsistent pricing alone. The wide range reflects how much worse it gets without controls. Companies with formal discount approval processes and regular margin-by-rep reviews lose less.
How do you calculate your margin erosion rate?
Compare your gross margin percentage across two periods. The formula: (Prior Margin % - Current Margin %) / Prior Margin % x 100. If your margin was 28% last year and 26% this year, your erosion rate is 7.1%. Track this quarterly to spot trends before they become crises.
Can margin erosion be reversed?
Yes, but it requires identifying the specific causes first. Internal causes (discounting, cost absorption, mix shift) are fixable through pricing discipline and process changes. External causes (commodity costs, competitive pressure) require faster detection and response. Most mid-market companies can recover 2-4 points of margin within 12 months by addressing the top two or three causes.
How is margin erosion different from margin leakage?
Margin erosion vs. margin leakage is a common question. Margin erosion is the broad term for declining margins from any cause. Margin leakage is a specific type of erosion where profit escapes through identifiable gaps: unclaimed rebates, unrecovered freight charges, unauthorized discounts, and similar operational holes. Leakage is always a subset of erosion, and it's usually the easiest to fix because the causes are concrete and measurable.
How often should you audit for margin erosion?
Quarterly at minimum. Monthly is better for transaction-level metrics like average discount depth and margin by rep. The companies that catch erosion early review their top 50 SKUs and top 20 customers monthly, and run a full margin analysis quarterly. Annual reviews are too infrequent because a full year of erosion is hard to reverse.
Does margin erosion affect manufacturers and distributors differently?
Manufacturers face more exposure to raw material and labor cost volatility, which creates sudden margin swings. Distributors face more exposure to competitive pricing pressure and discounting drift, which creates gradual erosion. Both face cost-to-serve and mix shift issues. Manufacturers tend to have fewer SKUs but deeper margins. Distributors tend to have more SKUs and thinner margins, so the same absolute erosion in points hurts more as a percentage of total profit.
Last updated: January 29, 2026
Frequently Asked Questions

Want to analyze your entire product catalog?
Pryse automatically identifies margin leakage across thousands of SKUs. Upload your data and find hidden profit in 24 hours.
One-time $1,499 diagnostic. No subscription required.