7 Margin Leakage Examples That Cost Distributors Real Money
Real margin leakage examples from distribution and manufacturing companies. See the exact numbers, root causes, and dollar impact of hidden profit loss.
Margin leakage is the gap between the profit margin a company expects to earn and the margin it actually collects after all discounts, rebates, freight costs, and off-invoice deductions are accounted for. In distribution and manufacturing, this gap averages 2-5 percentage points of revenue, and most companies don't know it exists until they look at transaction-level data.
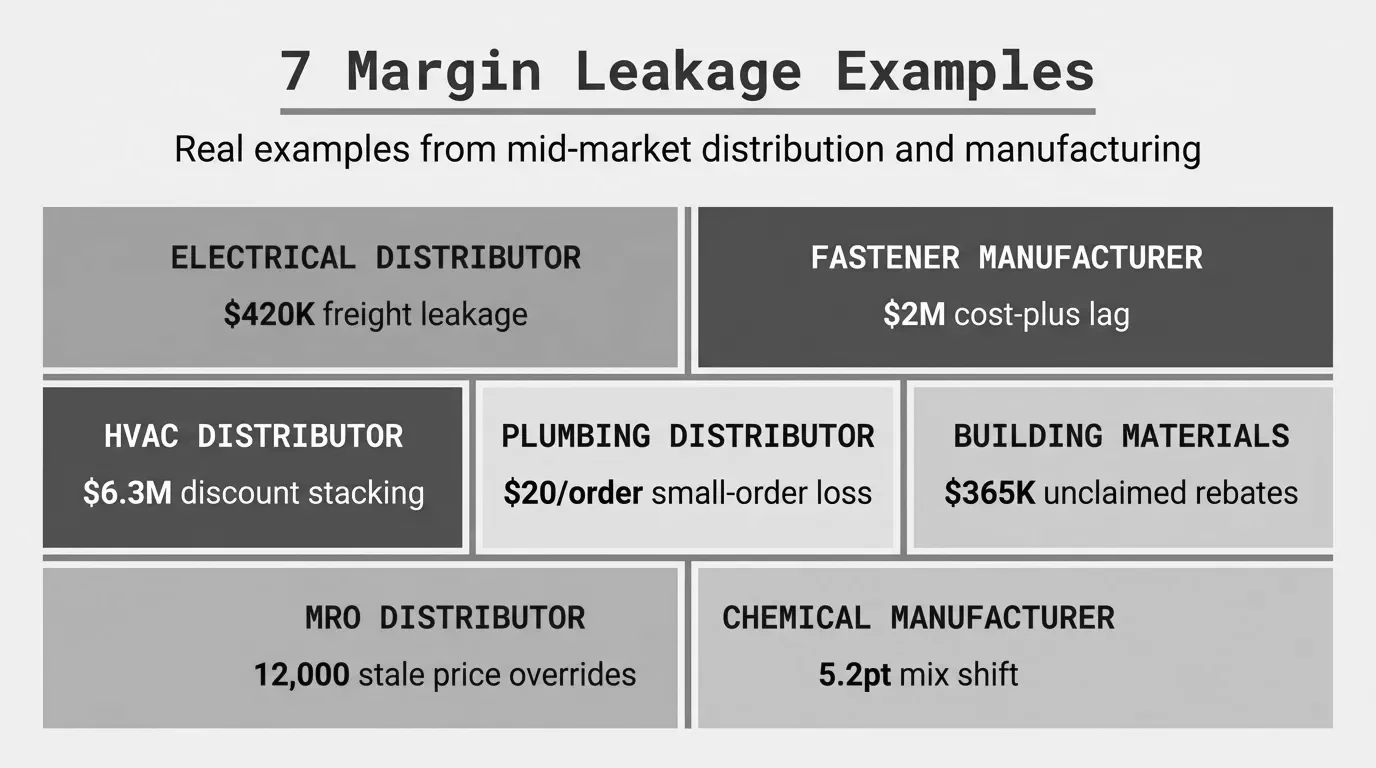
That sounds abstract. So here are seven real-world examples of how margin leaks, with specific numbers, root causes, and the dollar impact on each business.
If you want the full framework for finding and fixing these problems, start with our margin leakage guide.
Why Margin Leakage is Hard to Spot
Before the examples, it's worth understanding why these problems persist at companies that have competent finance teams and functioning ERPs.
Margin leakage doesn't show up in aggregate reporting. A distributor running a 24% gross margin might look healthy at the P&L level. But when you break that down to the transaction level and account for every off-invoice cost, you might find that 30% of transactions run below 15% pocket margin and 8% of transactions are actually underwater.
McKinsey's research on the power of pricing found that off-invoice price leakages average 16.3% of the standard list price. These costs are scattered across accounting codes, buried in AP, or tracked in spreadsheets that nobody reconciles against sales data.
The examples below all share a common trait: the leakage was invisible in the company's standard reports. It only appeared when someone pulled transaction-level data and looked at what actually happened on individual orders.
Example 1: The Freight Absorption Blind Spot
A regional electrical distributor ($65M revenue, 12,000 SKUs, 14 branches) gave sales reps authority to waive freight charges on orders over $500. The intent was to match competitors on large orders. In practice, reps were waiving freight on 72% of all outbound shipments, including small orders they bundled together to cross the threshold.
| Metric | Value |
|---|---|
| Total annual freight cost | $2.1M |
| Freight recovered from customers | $1.05M |
| Freight absorbed by company | $1.05M |
| Freight recovery rate | 50% |
| Industry benchmark recovery rate | 70-80% |
| Annual margin leakage from freight | $420K-$630K |
The company's ERP tracked freight as a line item on invoices where it was charged. But it didn't flag the absence of freight charges. Nobody was looking at what wasn't there.
The NAW reports that most distributors recover only about 70% of freight costs, with the unrecovered 30% eating 60-150 basis points of revenue. This distributor was well below that average.
A new CFO ran a simple query: total outbound freight cost divided by total freight charged to customers. The 50% recovery rate was a shock. Branch-level analysis showed one branch recovering 85% and another recovering just 31%.
They set minimum order amounts for free freight at $2,000 (not $500), required manager approval for freight waivers below that, and added a freight recovery metric to the monthly branch scorecard. Within six months, recovery climbed to 74%, recapturing roughly $500K annually.
Freight Leakage = Total Freight Cost - Total Freight Recovered
Leakage as % of Revenue = Freight Leakage / Total Revenue
Example 2: The Cost-Plus Pricing Lag
An industrial fastener manufacturer ($42M revenue, 8,500 SKUs, selling through distributors and direct) used cost-plus pricing: raw material cost + labor + overhead + 35% markup. The problem was timing. Steel prices rose 22% over eight months. The company updated its cost tables quarterly. For two quarters, they sold fasteners at margins calculated on costs that were 10-18% below actual.
| Quarter | Steel Cost Index | Cost Table Used | Actual Margin | Target Margin |
|---|---|---|---|---|
| Q1 | 100 (baseline) | Current | 34.8% | 35% |
| Q2 | 108 | Q1 costs | 28.1% | 35% |
| Q3 | 118 | Q2 costs | 22.4% | 35% |
| Q4 | 122 | Q3 costs (updated) | 30.2% | 35% |
Over the full year, the gap between target and actual gross margin averaged 4.8 points. On $42M in revenue, that's roughly $2M in lost margin.
Quarterly cost updates are standard in manufacturing. Nobody thinks of it as "leakage" because it's just how the business works. But when input costs move fast, that lag becomes a margin drain. And it's asymmetric: when costs drop, sales reps lower prices immediately to win deals. When costs rise, the price increase takes months.
The controller built a comparison in Excel: actual material cost per unit at time of production versus the cost figure used in the pricing formula. The average lag was 47 days.
The fix: monthly cost updates for their top 200 SKUs (which represented 60% of revenue) and a raw material surcharge mechanism that could be activated when commodity indices moved more than 5% in a rolling 60-day window. Year-two margin recovered to 33.9%.
For more on analyzing margin gaps like this, see our margin analysis guide.
Example 3: The Stacked Discount Problem
This HVAC parts distributor ($87M revenue, 22,000 SKUs, 400+ active customers) had three discount programs running at once:
- Customer-tier discounts (5%, 10%, or 15% based on annual volume)
- Promotional discounts (seasonal campaigns, typically 10-20% on select categories)
- Sales rep discretionary discounts (up to 8% with manager approval)
The system applied all three. A Tier 2 customer buying a promotional item with a rep discount could get 10% + 15% + 8% stacked. That's not 33% off. It's multiplicative:
Stacked Price = List Price x (1 - 0.10) x (1 - 0.15) x (1 - 0.08)
Stacked Price = List Price x 0.90 x 0.85 x 0.92
Stacked Price = List Price x 0.7038
Effective Discount = 29.6%
On products with a 28% gross margin at list price, that leaves negative margin.
The numbers:
| Discount Scenario | Effective Discount | Gross Margin (if 28% at list) |
|---|---|---|
| Tier discount only (10%) | 10.0% | 20.0% |
| Tier + promo (10% + 15%) | 23.5% | 6.3% |
| Tier + promo + rep (10% + 15% + 8%) | 29.6% | -2.3% |
In their analysis, 14% of line items in the prior year had all three discounts applied. Another 31% had two. The weighted average discount across all transactions was 19.2%, against a planned average of 12%.
The 7.2-point gap between planned and actual average discount, applied to $87M in revenue, is $6.3M in margin leakage. Not all of that is recoverable, but even tightening to a 15% average saves $2.6M.
An operations analyst exported 12 months of line-item transactions and added a column for "total discount percentage." The histogram showed a bimodal distribution, with a second peak at 25-30% that nobody expected.
The response: discount caps. No transaction could exceed 22% total discount without VP approval, regardless of how many programs were in play. They also added a real-time margin check in the ERP that flagged orders below a 12% gross margin floor before the invoice was generated.
Example 4: The Small-Order Margin Trap
A plumbing supply distributor ($110M revenue, 35,000 SKUs, 1,200 active accounts) treated all orders equally. A $47 order got picked, packed, invoiced, and delivered with the same process as a $4,700 order. The cost to process an order, regardless of size, was roughly $38 (warehouse labor, picking, packing, invoice generation, delivery or shipping).
The numbers:
| Order Size | % of Orders | % of Revenue | Avg. Gross Margin | Avg. Processing Cost | Net Margin per Order |
|---|---|---|---|---|---|
| Under $100 | 34% | 4% | $18 | $38 | -$20 |
| $100-$500 | 28% | 14% | $62 | $38 | $24 |
| $500-$2,000 | 22% | 28% | $195 | $42 | $153 |
| Over $2,000 | 16% | 54% | $510 | $48 | $462 |
One-third of all orders lost money. Those 34% of orders generated just 4% of revenue but consumed a massive share of warehouse and delivery labor.
About 4,500 orders per year in the under-$100 bucket, each losing an average of $20. That's $90K in direct losses, not counting the opportunity cost of warehouse labor spent on money-losing picks.
But here's the real leakage: many of these small orders came from large accounts. A contractor with $200K in annual purchases might place 150 small call-in orders for odds and ends. The account looks profitable in aggregate, but those small orders drag the actual pocket margin well below what the account-level report shows.
The controller built a cost-to-serve model by assigning fixed processing costs per order and per line item, then joined that to the transaction data. The "profit per order" distribution was eye-opening.
They introduced a $15 small-order surcharge on orders under $150, set up a "will-call bin" system so contractors could batch small needs into weekly pickups, and created a web portal with a $100 minimum order. Small orders dropped by 40% within a quarter. Most of that volume consolidated into larger, more efficient orders.
Example 5: The Rebate Reconciliation Gap
A building materials distributor ($78M revenue, 18,000 SKUs, 45 supplier rebate programs) earned rebates from suppliers based on volume thresholds, growth targets, and product mix. In theory, these rebates added 1.5-3% to gross margin. In practice, they were leaving a significant portion uncollected.
The problem was tracking. Rebate programs had different qualification periods (monthly, quarterly, annual), different calculation methods (percentage of purchases, per-unit, tiered), and different claim processes (some automatic, some required manual submission with proof of performance). The company tracked rebates in a spreadsheet maintained by one person in accounting.
The numbers:
| Rebate Category | Estimated Eligible | Actually Claimed | Gap |
|---|---|---|---|
| Volume rebates (auto-applied) | $780K | $745K | $35K |
| Growth target rebates | $340K | $195K | $145K |
| Product mix rebates | $210K | $88K | $122K |
| Co-op advertising | $115K | $52K | $63K |
| Total | $1.445M | $1.08M | $365K |
They were leaving $365K on the table every year. Growth target rebates were the biggest gap because nobody tracked progress toward thresholds until the period was already over. Product mix rebates required specific reporting that the one accountant didn't have time to compile for all 45 programs.
During a vendor review, one supplier mentioned that the distributor had qualified for a $48K annual growth rebate but never submitted the claim. The CFO asked the accounting team to audit all rebate programs. The spreadsheet was three months out of date and missing six programs entirely.
They invested in a rebate management module in their ERP, assigned rebate tracking to a dedicated analyst, and started running monthly reports showing progress toward each threshold. They also renegotiated five rebate programs to simplify the qualification criteria. First-year improvement: $280K in additional rebate income.
Rebate Leakage = Total Eligible Rebates - Total Claimed Rebates
Rebate Recovery Rate = Total Claimed / Total Eligible x 100
Example 6: The Customer-Specific Pricing Drift
Over 15 years, an industrial MRO distributor ($53M revenue, 28,000 SKUs, 850 active accounts) had accumulated 12,000+ customer-specific price overrides in their ERP. These were one-off prices negotiated by sales reps for specific customers on specific products. Some were legitimate contract prices. Many were stale.
The problem: nobody cleaned them up. A price override created in 2019 for a customer who was buying 500 units per month was still active in 2025, even though that customer now bought 20 units per month. Cost basis had changed. Market prices had changed. The override hadn't.
The numbers:
| Override Age | Count | Avg. Margin | Current Standard Margin |
|---|---|---|---|
| Less than 1 year | 2,100 | 24.8% | 26.2% |
| 1-3 years | 4,300 | 21.1% | 26.2% |
| 3-5 years | 3,400 | 17.3% | 26.2% |
| Over 5 years | 2,200 | 12.6% | 26.2% |
Overrides older than three years were running 9-14 points below current standard margin. These 5,600 overrides affected roughly $8.2M in annual revenue. At an average 11-point margin gap, that's approximately $900K in annual margin leakage.
Some of the worst offenders were prices set during the 2020 supply crunch when the company offered discounts to retain key accounts. The crisis passed, the discounts didn't.
During an ERP migration planning project, a consultant flagged the 12,000 price overrides as a data quality risk. The pricing manager exported them with last-modified dates and joined that to current cost and margin data. The age-versus-margin correlation was clear and alarming.
The fix: a price override expiration policy. All overrides older than 18 months were flagged for review. Sales reps had 60 days to re-justify or the override reverted to standard pricing. They also added a "margin floor" rule: no override could be created below 15% gross margin without director approval. In the first year, they reviewed and adjusted 4,200 overrides, recovering an estimated $520K in margin.
See price waterfall analysis for more on how to visualize these gaps.
Example 7: The Mix Shift Nobody Measured
A specialty chemical manufacturer ($95M revenue, 6,200 SKUs, selling to distributors and OEMs) held a steady 31-32% gross margin for three years. Leadership was satisfied. But beneath that average, the product mix was shifting in a way that masked a growing problem.
Their product line had three tiers:
| Product Tier | Avg. Gross Margin | Revenue Share (Year 1) | Revenue Share (Year 3) |
|---|---|---|---|
| Specialty formulations | 48% | 30% | 22% |
| Standard products | 28% | 45% | 48% |
| Commodity chemicals | 14% | 25% | 30% |
Specialty formulations, the high-margin products, were losing share to competitors with faster lead times. Commodity chemicals were growing because the sales team found them easier to sell on price. The blended margin held steady only because the company raised prices on standard products by 6% during the period, masking the mix shift.
The numbers:
Year 1 Blended Margin = (0.30 x 48%) + (0.45 x 28%) + (0.25 x 14%) = 14.4% + 12.6% + 3.5% = 30.5%
Year 3 Blended Margin = (0.22 x 48%) + (0.48 x 28%) + (0.30 x 14%) = 10.6% + 13.4% + 4.2% = 28.2%
Without the 6% price increase on standard products (which added roughly 2.9 points to blended margin), the year-three blended margin would have been about 25.3%. That's a 5.2-point decline hidden by a price increase.
On $95M revenue, 5.2 points of margin is $4.9M. The company was effectively spending its pricing power to cover a product mix problem rather than growing profit.
A new VP of Sales asked for a margin bridge analysis: what drove the change in total gross profit dollars from year one to year three? When the finance team decomposed it into volume, price, mix, and cost components, the mix effect was a negative $2.1M, completely offset by the price effect of +$2.8M.
They re-invested in the specialty formulations business, cutting lead times by hiring additional lab staff and pre-qualifying more raw material sources. They also added a product mix metric to the sales compensation plan: reps earned a higher commission rate on specialty products. Within two years, specialty share recovered to 27%.
How to Identify Margin Leakage in Your Business
These seven examples have a common thread: the leakage was real, it was significant, and it was invisible in standard financial reporting.
To find leakage in your own business, you need transaction-level data and the willingness to look at it from angles your ERP doesn't offer by default.
Here's what to look for:
Pull transaction-level data. Not monthly summaries, not account-level rollups. Individual invoices with line items, discounts applied, freight charges, rebates, and returns. The more granular, the better.
Calculate pocket margin per transaction. Start with invoice price, subtract every off-invoice cost you can attribute (freight, rebates, payment term costs, returns), subtract COGS. That's your pocket margin.
Pocket Margin = Invoice Price - Off-Invoice Costs - COGS
Pocket Margin % = Pocket Margin / Invoice Price x 100
Look at the distribution. Your average margin might be 25%. But what does the histogram look like? If 15% of transactions are below 10%, you have a leakage problem.
Segment and compare. Break pocket margin by customer, product, sales rep, branch, and order size. Leakage hides in specific segments that get averaged away in aggregate reports.
Check the waterfall. A price waterfall analysis shows where each dollar goes between list price and pocket price. It turns a vague "margins are soft" into a specific "freight absorption is costing us 1.8 points."
The Compound Effect of Multiple Leaks
In practice, most companies don't have one leak. They have several, and they compound.
Take a hypothetical $75M distributor with a target gross margin of 26%:
| Leakage Source | Margin Impact | Annual Dollar Impact |
|---|---|---|
| Freight under-recovery | -0.8% | $600K |
| Stacked discount overages | -1.2% | $900K |
| Stale price overrides | -0.6% | $450K |
| Unclaimed rebates | -0.4% | $300K |
| Small-order losses | -0.3% | $225K |
| Total | -3.3% | $2.475M |
That 3.3 points of leakage on a company with, say, 4% operating margin represents over 80% of operating profit. This is why McKinsey found that a 1% price improvement translates to an 8% improvement in operating profit. The math works in reverse too: a few points of unmanaged leakage can gut profitability.
None of these leaks appeared in this hypothetical company's income statement as a line item. They showed up as slightly lower gross margins, slightly higher operating costs, and a vague sense that "the business should be more profitable than it is."
What to Do Next
If these examples look familiar, you're not alone. Most distributors and manufacturers in the $20M-$200M range have at least two or three of these leakage patterns running simultaneously. The difference between companies that grow profit and companies that stay flat is often just visibility into where the money goes between list price and pocket price.
Start with data. Pull your transactions, build a pocket margin view, and look at the distribution. The biggest leaks will jump out.
For a step-by-step approach, read our complete guide to margin leakage. If you want to run the analysis yourself, Pryse can identify these patterns from a standard CSV export of your transaction data in under 24 hours.
Frequently Asked Questions
What is margin leakage?
Margin leakage is the gap between expected profit margin and actual profit margin on a transaction, caused by untracked discounts, unrecovered costs, and off-invoice deductions. It's different from margin erosion (which happens gradually from market forces) because leakage is usually fixable with better data and tighter processes.
How common is margin leakage in distribution?
It's nearly universal. McKinsey's research found that off-invoice deductions alone average 16.3% of list price across B2B companies. For distributors running 20-28% gross margins, even a couple of points of leakage represents a significant share of operating profit.
What is the most common source of margin leakage?
Pricing errors and unmanaged discounts are the most frequent source. This includes stacked discounts, stale customer-specific pricing, failure to update cost-plus formulas, and sales reps giving away freight or other concessions without tracking the cost.
Can margin leakage be positive (i.e., you earn more than expected)?
Yes. Some transactions will show pocket margins above target. The question is whether the distribution is symmetric or skewed. If your above-target transactions barely exceed the target and your below-target transactions are way below, the average gets pulled down even if it looks acceptable.
How is margin leakage different from revenue leakage?
Revenue leakage is uncollected revenue: unbilled services, missed invoices, pricing errors that undercharge. Margin leakage is broader. It includes revenue leakage but also cost-side problems like freight absorption, small-order processing costs, and unclaimed vendor rebates. You can have flat revenue and still experience margin leakage.
What tools do I need to detect margin leakage?
At minimum, you need transaction-level data (line items, discounts, freight, rebates) and a way to calculate pocket margin per transaction. Many companies start with Excel or Google Sheets. The challenge isn't the tool; it's getting the data out of siloed systems (ERP, TMS, rebate tracking, AP) into one view. That's what a price waterfall analysis is designed to do.
How quickly can margin leakage be fixed?
Some leaks are fixable in weeks. Setting discount caps, adding freight recovery minimums, or cleaning up stale price overrides are operational changes that can take effect immediately. Others, like restructuring rebate programs or changing the product mix, take months. Most companies see measurable improvement within one quarter of identifying the problem.
Last updated: January 29, 2026
Frequently Asked Questions

Want to analyze your entire product catalog?
Pryse automatically identifies margin leakage across thousands of SKUs. Upload your data and find hidden profit in 24 hours.
One-time $1,499 diagnostic. No subscription required.