How to Fix Margin Leakage: 7 Fixes That Recover 2-5% of Revenue
Practical fixes for margin leakage in distribution and manufacturing. Covers discount stacking, freight absorption, rebate tracking, and cost pass-through.
Fixing margin leakage means identifying and closing the specific pricing gaps, process failures, and policy holes that drain profit from individual transactions, then building systems that prevent them from reopening.
That's different from general "margin improvement," which could mean anything from renegotiating supplier contracts to cutting headcount. Margin leakage fixes target money you're already earning but not keeping. It's the difference between finding new revenue and plugging the holes in revenue you already have.
In our analysis of mid-market distributors and manufacturers, the typical company leaks 2-5% of total revenue through fixable pricing gaps. NAW research confirms that most distributors leave at least two percentage points of gross margin on the table. For a $75M distributor, that's $1.5M in profit sitting in spreadsheet cracks and process gaps.
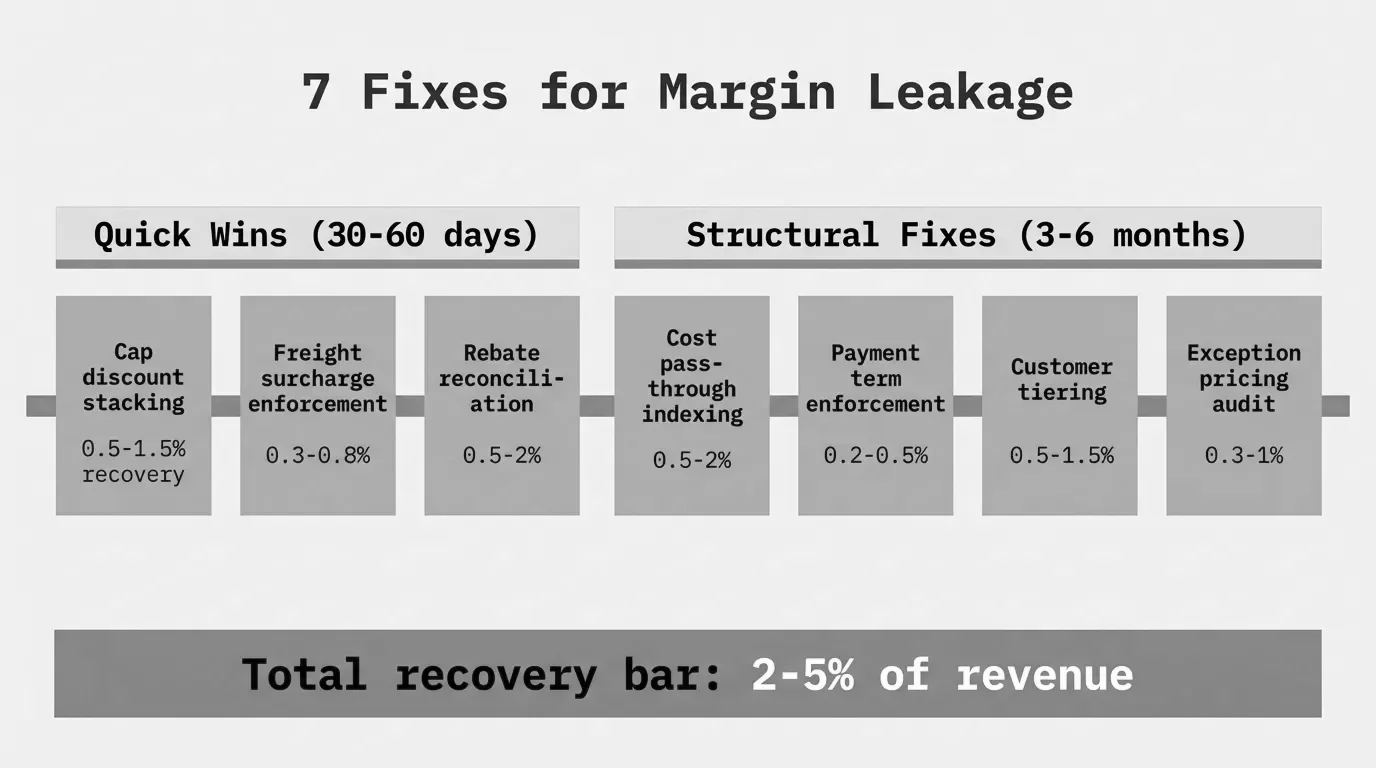
This guide covers the seven most common leakage sources we see, how to detect each one, the specific fix, and what kind of margin recovery to expect. We've organized them from quickest wins to longer-term structural fixes.
For a broader overview of what causes margin leakage in the first place, see our margin leakage guide.
The Price Waterfall: Where Leakage Actually Happens
Before fixing anything, you need to see where margin disappears. That's what a price waterfall analysis does — it tracks every deduction between your list price and your pocket price (what you actually keep after everything is subtracted).
Pocket Price = List Price - On-Invoice Discounts - Off-Invoice Deductions - Cost to Serve
Pocket Margin = (Pocket Price - COGS) / Pocket Price x 100
Most companies track margin at the invoice level. They see list price minus discount and call that their margin. But the average B2B transaction has roughly five additional deductions below the invoice line: rebates, freight allowances, payment terms, marketing co-op funds, and returns handling. That's where leakage hides.
A Zilliant analysis found that companies who only measure at the invoice level miss 15-25% of total margin erosion. The off-invoice portion of the waterfall is where the real problems live.
Here's how the seven fixes map to the waterfall:
| Waterfall Stage | Leakage Source | Typical Impact | Fix Difficulty |
|---|---|---|---|
| On-invoice | Discount stacking | 1-2% of revenue | Quick (30-60 days) |
| On-invoice | Cost pass-through lag | 0.5-2% of revenue | Medium (60-90 days) |
| Off-invoice | Freight absorption | 0.3-1% of revenue | Quick (30-60 days) |
| Off-invoice | Unclaimed rebates | 0.5-1.5% of revenue | Medium (60-90 days) |
| Off-invoice | Payment term costs | 0.2-0.5% of revenue | Medium (60-90 days) |
| Structural | Customer mix drift | 1-3% of revenue | Long (3-6 months) |
| Structural | Exception pricing decay | 0.5-2% of revenue | Long (3-6 months) |
Fix 1: Stop Discount Stacking
The Problem
Discount stacking happens when multiple discounts accumulate on the same transaction without anyone seeing the total impact. A customer gets a volume discount (10%), plus a promotional discount (5%), plus a loyalty rebate (3%), plus a sales rep's negotiated discount (7%). Each one was approved individually. Combined, they've taken 25% off the list price — and nobody approved a 25% discount.
This is the single most common leakage source in distribution. It happens because discounts live in different systems: volume tiers in the ERP, promotions in marketing, negotiated pricing in the CRM, rebates in a spreadsheet. No single person sees the stack.
PriceFX research on manufacturing companies found that fixed discounting (applying the same discount regardless of customer willingness to pay) is the default approach for most manufacturers, and it's one of the weakest pricing strategies possible.
How to Detect It
Export 12 months of transaction data. For each line item, calculate:
Total Discount % = (List Price - Pocket Price) / List Price x 100
Discount Count = Number of distinct discount types applied per transaction
Flag every transaction where:
- Total discount exceeds 20% (or whatever your target max is)
- Three or more discount types are stacked on one line
- The discount percentage is more than 1.5x the customer segment average
Sort by total discount descending. The top 10% of over-discounted transactions usually represent 40-60% of total discount leakage.
The Fix
-
Set cumulative discount caps. Define a maximum total discount by customer tier. Example: Tier 1 customers cap at 30%, Tier 2 at 22%, Tier 3 at 15%. Any stack that exceeds the cap needs manager approval before the order ships.
-
Build a discount waterfall report. Create a weekly report showing each discount layer by transaction. Sales managers review any line where the total stack exceeds the segment average by more than 5 points.
-
Eliminate duplicate discount types. If you're giving a volume discount AND a loyalty discount AND a growth incentive, you have three programs incentivizing the same behavior (buying more). Consolidate to one.
Expected Impact
In our analysis, distributors who implement discount caps and waterfall reporting recover 0.8-1.5% of revenue within 90 days. One $60M industrial distributor found that 12% of its transactions had discount stacks exceeding 25% — a threshold nobody had ever approved. Capping those transactions at 25% added $340,000 in annual margin.
Fix 2: Close the Cost Pass-Through Lag
The Problem
Your costs go up. Your prices don't, at least not for weeks or months. That gap is the cost pass-through lag, and it's one of the most damaging leakage sources because it compounds over time.
McKinsey's research on cost volatility found that manufacturers feel the negative effects of raw-material cost increases almost immediately, but it often takes sustained increases over several months for the organization to even consider action. Once it does, changes can take months or quarters to produce a meaningful margin benefit.
The lag gets worse when you have to give customers advance notice of price increases. During the notification period, customers front-load purchases at the old price. Meanwhile, your input costs keep rising. By the time the increase takes effect, it may not fully offset the margin damage.
One consumer goods manufacturer McKinsey studied didn't realize its core component costs had risen 12% over 14 months because it bundled input costs with other manufacturing expenses. To recover, the company needed an average 8% price increase.
How to Detect It
Track two numbers monthly:
Cost Index = Current Weighted Average COGS / Baseline Weighted Average COGS x 100
Price Index = Current Weighted Average Selling Price / Baseline Weighted Average Selling Price x 100
Lag Gap = Cost Index - Price Index
If your cost index is at 108 and your price index is at 103, you have a 5-point lag gap. On $50M in revenue, that's roughly $2.5M in unrecovered cost.
Run this calculation at the product category level. Aggregate numbers hide category-specific problems. Your steel-based products might be lagging 8% while plastics are fine.
The Fix
-
Index prices to input costs. For commodity-heavy products, tie your pricing to published cost indices (steel, resin, copper, freight rates). Update prices monthly or quarterly based on index movement. Many industrial customers already expect this.
-
Shorten the notification window. If you give 90-day notice on price changes, you're eating 90 days of margin damage on every increase. Move to 30-day notice where contracts allow. Some distributors use "price at time of shipment" terms for volatile categories.
-
Automate cost monitoring. Set alerts for when any product category's COGS changes by more than 2% in a rolling 30-day period. Don't wait for the quarterly review to discover you've been absorbing a cost increase for five months.
-
Segment your response. Not every product needs the same approach. High-cost, low-margin commodity items should be indexed. Specialty items with healthy margins can absorb moderate cost changes without immediate action.
Expected Impact
Distributors who implement monthly cost-index tracking and 30-day pricing cadences typically recover 0.5-1.5% of revenue. The impact is highest during periods of cost volatility. A $45M building materials distributor reduced its average pass-through lag from 97 days to 28 days and recovered $380,000 in annual margin — mostly from lumber and steel categories.
Fix 3: Eliminate Freight Absorption Leakage
The Problem
Freight is one of the easiest costs for sales reps to give away. "Free shipping" or "we'll absorb freight" sounds like a small concession during a negotiation, but it adds up fast.
Food manufacturers incur freight-related costs at roughly 5% of COGS or 3% of revenue. For distributors, the number is similar or higher depending on delivery radius. When reps absorb freight to close deals, they're giving away 2-5% of the transaction value without it showing up as a "discount" anywhere.
The problem compounds because freight costs aren't stable. Rate volatility means the freight you absorbed at $800 per shipment in January might cost $1,100 by June. Your sales rep committed to "free freight" based on January's costs, and nobody updated the calculation.
How to Detect It
Pull every transaction where freight was charged to the company rather than the customer. Calculate:
Freight Absorption Rate = Total Freight Absorbed / Total Revenue x 100
Freight as % of Transaction = Freight Cost / Invoice Amount x 100
Break this down by:
- Sales rep (who is giving away the most freight?)
- Customer (which accounts get the most free freight?)
- Product category (are high-weight/low-margin items disproportionately affected?)
One pattern we see repeatedly: the top 3-5 sales reps in freight absorption account for 40-60% of total absorbed freight costs.
The Fix
-
Make freight visible on every quote. Even if you're not charging for it, show freight as a line item with a "$0 — absorbed" notation. This forces the conversation and makes the cost visible to everyone reviewing the deal.
-
Set freight absorption thresholds. Allow reps to absorb freight on orders over a specific amount (e.g., $5,000+), but require approval for smaller orders. This concentrates the incentive where it has the most strategic value.
-
Implement minimum order quantities for free freight. Instead of absorbing freight on every order, set a minimum order size. This encourages larger orders and reduces per-order freight cost ratios.
-
Add a fuel surcharge mechanism. Tie a portion of freight charges to diesel or fuel cost indices. Most customers in B2B distribution understand and accept fuel surcharges because they face the same dynamics in their own businesses.
Expected Impact
Freight absorption fixes typically recover 0.3-0.8% of revenue. A $90M plumbing distributor discovered that one sales territory was absorbing $420,000 in annual freight — 3x the company average. After implementing minimum order thresholds for free freight and adding fuel surcharges, the territory recovered $280,000 in the first year.
Fix 4: Capture Unclaimed Rebates
The Problem
Rebates are complicated. Supplier rebate programs have different tiers, qualification windows, and reporting requirements. Most distributors track rebates in spreadsheets. And most distributors miss money because of it.
According to industry analyses, roughly 4% of rebate revenue goes unclaimed by distributors due to poor tracking. Enable (a rebate management platform) reports that 40-60% of distributor bottom-line profit comes from rebates. If your rebate program drives half your profit and you're leaving 4% of it unclaimed, the math is painful.
Even more striking: 57% of distributors in buying groups admit they don't really know how much they're earning from individual manufacturer rebate programs.
The root cause is manual tracking. Spreadsheet-based rebate management almost always leads to forgotten agreements, missed qualification thresholds, and unclaimed payments. One distributor discovered a $1M discrepancy in its rebate program that had been bleeding money for months before anyone noticed.
How to Detect It
Start with a rebate reconciliation:
- List every supplier rebate program you participate in
- Pull the qualification criteria for each (volume tiers, growth targets, product mix requirements)
- Compare your actual purchases against each qualification threshold
- Identify programs where you're within 5-10% of the next tier but haven't hit it
- Check for programs where you qualified but never submitted a claim
The most common misses:
- Tier threshold gaps: You bought $480K and the next rebate tier kicks in at $500K. A $20K purchase increase would've earned a $15K rebate bump.
- Expired claims: You qualified, but the claim window closed before you submitted paperwork.
- Category mix misses: You hit the volume target overall but didn't meet the product category mix requirement buried in section 4 of the agreement.
The Fix
-
Build a rebate calendar. Map every program's qualification period, claim deadline, and tier thresholds. Review monthly, not at year-end.
-
Create a "near-miss" report. For every program, flag when your run-rate puts you within 10% of the next tier. Route these to purchasing managers so they can shift volume strategically.
-
Automate claim submission. Even without dedicated rebate software, you can automate the data pull from your ERP. Set up monthly exports of purchase data by supplier, and compare against tier thresholds automatically.
-
Assign rebate ownership. Somebody has to own each supplier relationship's rebate performance. If nobody's name is on it, nobody's checking it.
Expected Impact
Rebate capture improvements typically recover 0.5-1.5% of revenue. The impact is proportional to how much of your profit comes from rebates. A $55M electrical distributor that moved from spreadsheet tracking to monthly rebate reconciliation captured an additional $430,000 in rebates in the first year — mostly from tier upgrades and on-time claims they'd previously missed.
Fix 5: Price Your Payment Terms
The Problem
Net-30, Net-60, and 2/10 Net-30 terms all have a cost. If you're extending Net-60 terms to a customer and borrowing at 7% to fund your working capital, those 60 days cost you roughly 1.15% of the invoice value. On a $100K order, that's $1,150 in financing cost that doesn't show up on the invoice.
Payment Term Cost = Invoice Amount x (Annual Borrowing Rate / 365) x Days Outstanding
Example: $100,000 x (0.07 / 365) x 60 = $1,151
Most distributors treat payment terms as a standard policy rather than a cost element. They offer Net-30 to everyone regardless of order size, margin, or customer risk profile. Some extend Net-60 or Net-90 to win deals without calculating the real cost.
How to Detect It
Calculate the implied cost of payment terms for every active customer:
- Pull average days-to-pay by customer (not the stated terms, the actual payment behavior)
- Multiply by your cost of capital
- Express as a percentage of revenue per customer
You'll likely find that your stated terms and actual payment behavior don't match. Net-30 customers who consistently pay at day 45-50 are costing you an extra 15-20 days of financing you didn't price in.
The Fix
-
Tier your terms by customer profitability. High-margin, high-volume accounts earn better terms. Low-margin accounts get standard or stricter terms. This isn't punitive. It's matching the cost of extending credit to the profit the account generates.
-
Enforce early-payment discounts properly. If you offer 2/10 Net-30, make sure customers who take the 2% discount actually pay within 10 days. Audit this quarterly. We've seen cases where 15-20% of early-pay discount claims arrive after the 10-day window but the discount is applied anyway.
-
Add terms to your pocket price calculation. When sales reps quote a price, the system should show the pocket margin after payment term costs. A $100 sale at 25% gross margin with Net-60 terms and a 7% cost of capital is really a 23.85% margin deal.
Expected Impact
Payment term optimization typically recovers 0.2-0.5% of revenue. The impact is highest for companies with long average collection cycles and high borrowing costs. A $70M industrial distributor that moved to tiered payment terms and started enforcing early-pay windows recovered $210,000 annually, mostly from customers who had been paying at 50-60 days on Net-30 terms.
Fix 6: Fix Customer Mix Drift
The Problem
Over time, your customer mix shifts. Accounts that started as high-margin specialty buyers gradually push for lower prices. Small accounts that bought at full price grow into mid-size accounts demanding volume discounts. New customers acquired through aggressive pricing stay at those low prices even after they're established.
The result: your average margin per customer declines even though each individual pricing decision seemed reasonable at the time. This is customer mix drift, and it's one of the harder leakage sources to detect because it happens slowly.
NAW research describes a useful segmentation framework: core customers (high volume, high margin), opportunistic customers (low volume, high margin), marginal customers (high volume, low margin), and service drains (low volume, low margin). Most distributors have never done this segmentation. They treat all customers roughly the same.
How to Detect It
Run a customer margin analysis that includes:
Customer Pocket Margin = (Net Revenue - COGS - Allocated Cost to Serve) / Net Revenue x 100
Customer Margin Trend = Current Year Pocket Margin - Prior Year Pocket Margin
Plot every customer on a 2x2 matrix: revenue on one axis, pocket margin on the other. Then compare this year's plot to last year's. Look for:
- Customers who moved from the high-margin quadrant to the low-margin quadrant
- New customers clustered below your target margin
- Large accounts where margin has declined 2+ points year-over-year
The Fix
-
Segment customers by profitability, not just revenue. Your $2M account at 8% pocket margin is worth less than your $800K account at 22% pocket margin. Price and serve them accordingly.
-
Set margin floors by segment. Define a minimum acceptable pocket margin for each customer tier. Any deal that falls below the floor requires VP-level approval. This prevents the slow drip of margin concessions.
-
Implement annual price reviews by customer. Don't wait for customers to request a price decrease. Proactively review your top 50 accounts annually. Where margins have eroded, build a case for a price correction and present it with data on the value you deliver.
-
Handle low-margin accounts directly. For accounts consistently below your margin floor, you have three options: raise prices with a clear justification, reduce cost-to-serve (smaller order minimums, fewer delivery days, self-service ordering), or accept the margin if there's a strategic reason (reference account, gateway to a vertical).
Expected Impact
Customer mix correction is a longer-term fix with bigger payoff. Distributors who implement customer-level profitability analysis and margin floors typically recover 1-3% of revenue over 12-18 months. A $110M building materials distributor identified 340 accounts (out of 4,200) that were below its margin floor. After 12 months of targeted price corrections and service adjustments, average pocket margin on those accounts improved by 4.2 points, adding $890,000 in annual margin.
Fix 7: Clean Up Exception Pricing
The Problem
Exception pricing starts with good intentions. A sales rep asks for a special price to win a competitive deal. The manager approves it. The special price goes into the system. And it stays there. Forever.
Over time, exception prices accumulate like sediment. They made sense when they were created — matching a competitor's bid, winning a new account, responding to a temporary market condition — but the original context disappeared. The special price remains.
Most distributors we've analyzed have 15-30% of their active SKU-customer price combinations set as exceptions. Many of these exceptions are more than 12 months old. The competitive situation that justified them has changed, but nobody reviews them.
How to Detect It
Pull your pricing master file and flag:
- Every price that deviates from the standard matrix by more than 5%
- Exception prices created more than 6 months ago
- Exception prices with no documented justification or expiration date
- Customers with more than 20% of their line items on exception pricing
Calculate the total margin impact:
Exception Price Leakage = SUM of (Standard Price - Exception Price) x Volume for all exception SKU-customer combinations
The Fix
-
Add expiration dates to all exception prices. No exception should last indefinitely. Set a default expiration of 90 days. Require re-approval to extend.
-
Require documented justification. Every exception needs a reason code (competitive match, new account win, market condition, strategic account) and a brief note. This creates accountability and makes review possible.
-
Run a quarterly exception audit. Sort exceptions by margin impact. Review the top 50 by dollar amount each quarter. Ask: does the original justification still hold? If not, migrate the account to standard pricing with 30-day notice.
-
Sunset old exceptions in bulk. For exceptions older than 12 months with no recent review, move them to standard pricing. Send customers a notice framed as a "pricing update" rather than an increase. Many won't push back because they've forgotten the exception existed too.
Expected Impact
Exception pricing cleanup recovers 0.5-2% of revenue, depending on how long exceptions have accumulated. A $40M HVAC distributor found 4,800 active exception prices, 60% of which were more than a year old. After sunsetting exceptions older than 18 months (with customer notification), the company recovered $310,000 in annual margin. Only 8% of affected customers requested a re-negotiation.
Quick Wins vs. Structural Fixes
Here's how the seven fixes compare on timeline and difficulty:
| Fix | Timeline | Effort | Typical Recovery | Requires Software? |
|---|---|---|---|---|
| Discount stacking caps | 30-60 days | Low | 0.8-1.5% of revenue | No |
| Freight absorption limits | 30-60 days | Low | 0.3-0.8% of revenue | No |
| Cost pass-through indexing | 60-90 days | Medium | 0.5-1.5% of revenue | No |
| Rebate reconciliation | 60-90 days | Medium | 0.5-1.5% of revenue | No |
| Payment term optimization | 60-90 days | Medium | 0.2-0.5% of revenue | No |
| Exception pricing cleanup | 90-180 days | Medium | 0.5-2% of revenue | No |
| Customer mix correction | 6-18 months | High | 1-3% of revenue | Helpful |
Start with the top two. They require nothing more than a data export and a policy decision. If you're a $50M distributor, discount stacking caps alone can recover $400-750K. That's money you can find in 30 days with a spreadsheet.
The structural fixes (customer mix, exception pricing) take longer but have a bigger total impact. Think of them as the second wave: start the analysis now, but expect results over the next 6-18 months.
Putting It All Together: A 90-Day Plan
Days 1-30: Assess and Quick Win
- Run a price waterfall analysis on your top 200 customers
- Identify discount stacking violations and implement caps
- Flag freight absorption by sales rep and set thresholds
- Pull your rebate program list and start a reconciliation
Days 31-60: Medium Fixes
- Set up monthly cost-index tracking by product category
- Shorten price increase notification windows
- Audit early-payment discount compliance
- Build a near-miss report for rebate tier thresholds
Days 61-90: Structural Foundation
- Run a customer margin analysis with cost-to-serve allocation
- Segment customers into profitability tiers
- Audit exception pricing and set expiration dates
- Define margin floors by customer segment
By day 90, you'll have recovered the quick wins and built the analytical foundation for the bigger structural fixes. The quick wins fund the effort. The structural fixes sustain it.
What "Fixed" Looks Like
You don't eliminate margin leakage — you manage it. Even well-run distributors have some leakage because price exceptions, freight negotiations, and rebate complexity are part of doing business. The difference between a 3% leakage rate and a 1% leakage rate is real money — on $75M in revenue, that's $1.5M in annual margin.
The companies that keep leakage low share three habits:
They measure pocket margin, not invoice margin. If your margin reporting stops at the invoice level, you're missing 40-60% of your leakage. Track margin through the full waterfall down to pocket price.
They review pricing at regular cadences. Monthly for cost indices and rebate tracking. Quarterly for exception pricing and discount compliance. Annually for customer profitability and segmentation. The cadence matters more than the format.
They assign ownership. Every leakage source has somebody's name on it. Freight absorption is tracked by the logistics manager. Rebate capture is owned by procurement. Discount compliance is the sales ops team's responsibility. When nobody owns it, nobody fixes it.
Frequently Asked Questions
What is the fastest way to fix margin leakage?
Run a discount stacking audit. Export your transaction data, flag invoices with three or more concurrent discounts, and set a cumulative discount cap by customer tier. Most distributors recover 0.5-1.5% of revenue within 60 days. This requires no software — just Excel and a policy decision.
How much margin leakage is normal?
NAW research indicates most distributors leave at least 2 percentage points of gross margin on the table. In our analysis, companies with manual pricing processes average 3-5% leakage. Companies with structured pricing governance keep leakage under 1%. The range depends on how many SKUs you manage, how many pricing decisions happen per day, and how much is left to individual sales rep discretion.
Can I fix margin leakage without buying pricing software?
Yes. Every fix in this guide can be executed with ERP data exports and Excel. Software helps when you're managing 10,000+ SKUs or making hundreds of pricing decisions daily — the manual approach doesn't scale past that point. But the first $200-500K in recovered margin doesn't require a software purchase.
How do I know which leakage source to fix first?
Start with the one that's easiest to measure. For most distributors, that's discount stacking — pull your transaction data, calculate total discount per line, and look for outliers. If you can see the problem in the data, you can fix it in 30 days. Cost pass-through lag is the second priority if your input costs have risen in the past 12 months.
What's the difference between margin leakage and margin erosion?
Margin erosion is the trend — your margins are declining over time. Margin leakage is the cause — the specific, transaction-level gaps that produce erosion. You might have margin erosion from competitive pressure (not leakage) or from rising costs you haven't passed through (leakage). The distinction matters because leakage is fixable through process and policy changes, while competitive erosion may require a different strategic response.
Should I hire a consultant or do this myself?
For companies under $100M in revenue, the analysis is straightforward enough to do internally if you have someone comfortable with data. The fixes are operational, not strategic — they're about setting policies and enforcing them. Where consultants add value is in benchmarking (how do your leakage rates compare to peers?) and in building the analytical framework if you don't have pricing expertise in-house.
How do I prevent margin leakage from coming back?
Build recurring measurement into your operations. A quarterly price waterfall review catches new leakage before it compounds. Monthly cost-index tracking prevents pass-through lag. A rebate calendar prevents missed claims. The fixes themselves are one-time; the monitoring is ongoing. Plan for 2-4 hours per week of pricing governance once the initial fixes are in place.
Last updated: January 29, 2026
Frequently Asked Questions

Want to analyze your entire product catalog?
Pryse automatically identifies margin leakage across thousands of SKUs. Upload your data and find hidden profit in 24 hours.
One-time $1,499 diagnostic. No subscription required.