Margin Leakage Calculator: Formulas, Examples, and Excel Walkthrough
Calculate margin leakage with step-by-step formulas. Includes worked examples for distributors and manufacturers, Excel templates, and leakage type breakdowns.
A margin leakage calculator measures the difference between what you should earn on a transaction and what you actually pocket after all discounts, rebates, freight costs, and off-invoice deductions are applied.
Margin Leakage = List Price - Pocket PriceThat gap between list price and pocket price is where your profit disappears. For most distributors and manufacturers, it's a bigger number than anyone in the building realizes.
McKinsey's research on B2B pricing found that off-invoice price leakages average 16.3% of the standard list price. When you combine that with on-invoice discounts, the typical pocket price can drop to roughly half the original list price. The NAW (National Association of Wholesaler-Distributors) found that pricing overrides account for 50% or more of transactions at most distribution companies, and that fixing pricing leakage can recover 800+ basis points of margin.
This article walks through the exact formulas, a complete worked example for a $45M distributor, and how to build a margin leakage calculator in Excel. For background on the broader concept, see our margin leakage guide.
The Core Margin Leakage Formulas
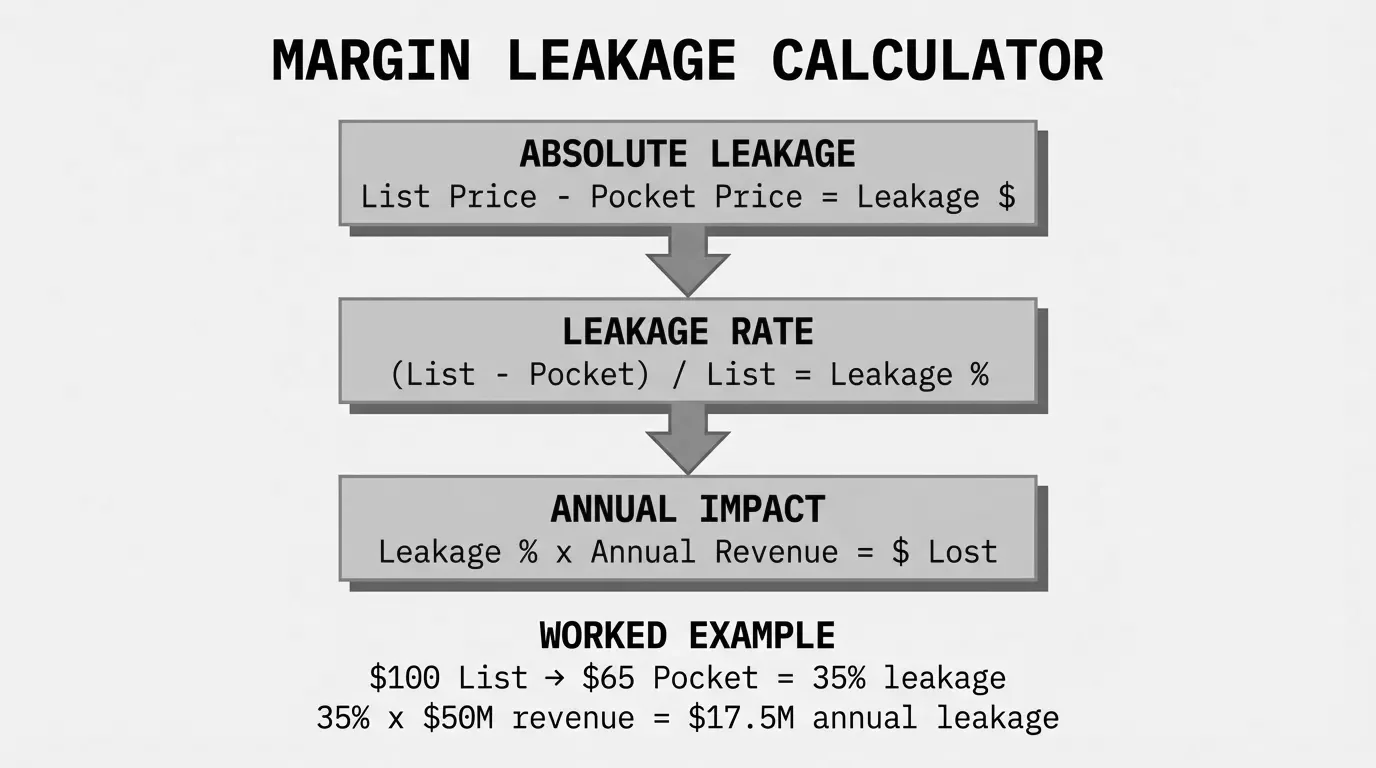
There are three calculations you need. Each one answers a different question.
1. Absolute Leakage (Per Transaction)
How many dollars did I lose on this transaction?
Leakage ($) = List Price - Pocket PriceThe pocket price is what you actually receive after every deduction. Not the invoice price. The pocket price. Those are two different numbers, and the difference between them is where most leakage hides.
2. Leakage Rate (Per Transaction)
What percentage of my list price leaked away?
Leakage Rate (%) = (List Price - Pocket Price) / List Price x 100This percentage lets you compare leakage across products, customers, and time periods. A leakage rate above 5% on a given transaction should trigger a review.
3. Annualized Leakage (Portfolio-Level)
How much total margin am I losing per year?
Annual Leakage ($) = SUM of (List Price - Pocket Price) across all transactionsThis is the number that gets executive attention. For a $50M distributor running a 3% leakage rate, that's $1.5M in margin that vanished.
The Seven Types of Margin Leakage (and How to Calculate Each)
Not all leakage comes from the same place. Here's how each type shows up in your calculations, along with realistic dollar amounts for a $100 list price item.
| Leakage Type | What It Is | Example Deduction | Pocket Price Impact |
|---|---|---|---|
| Standard discount | Published volume/customer tier discount | -$15.00 (15%) | $85.00 |
| Promotional discount | Time-limited price reduction | -$5.00 (5%) | $80.00 |
| Discount stacking | Multiple discounts applied to one order | -$4.00 (extra 5% on discounted price) | $76.00 |
| Negotiated concession | Sales rep override or special pricing | -$3.00 | $73.00 |
| Rebate leakage | Rebates paid but not earned by volume | -$2.00 | $71.00 |
| Freight absorption | Shipping costs you absorb | -$3.50 | $67.50 |
| Payment term cost | Early pay discounts / extended terms cost | -$1.50 (2/10 net 30) | $66.00 |
In this example, the pocket price is $66.00 on a $100.00 list price item. That's a 34% total leakage rate. The on-invoice portion (standard + promotional + stacking + concession) is 27%. The off-invoice portion (rebate + freight + payment terms) is another 7%.
Most companies track the on-invoice discounts because they're visible. The off-invoice deductions are the ones that accumulate silently.
Calculating Discount Stacking
Discount stacking deserves its own formula because it's the most common source of unexpected leakage. It happens when a customer gets a volume discount AND a promotional discount AND a loyalty discount, all on the same order.
Stacked Price = List Price x (1 - Discount A) x (1 - Discount B) x (1 - Discount C)Example: a $100 item with a 15% volume discount, 5% promo, and 3% loyalty discount.
$100 x 0.85 x 0.95 x 0.97 = $78.31That's a 21.7% effective discount, not the 23% you'd get by adding them up (15 + 5 + 3). The math works slightly in your favor because each discount compounds on the reduced price. But here's the problem: most ERP systems and Excel sheets add the discounts linearly, showing 23%. So you record 23% but the actual deduction is 21.7%.
That sounds like good news until you realize the real issue: nobody approved a 21.7% discount. They approved three separate discounts that were never supposed to stack.
Calculating Freight Absorption Leakage
Freight is one of the most common and most overlooked leaks. It shows up in your P&L as a shipping expense, not as a price reduction, so it never appears in pricing reports.
Freight Leakage = Freight Cost Absorbed / Revenue x 100For a distributor shipping $50,000/month to a customer and absorbing $2,500 in freight:
$2,500 / $50,000 = 5% freight leakageThat 5% comes directly off the margin. On a product with 25% gross margin, freight leakage of 5% drops your real margin to 20%, a 20% reduction in profitability on that customer.
Worked Example: How a $45M Distributor Calculated Their Margin Leakage
Here's a realistic calculation based on a composite of distribution companies we've analyzed. This distributor sells industrial supplies, runs about 12,000 SKUs, and does most pricing in a mix of ERP list prices and Excel override sheets.
Step 1: Gather the Raw Data
They pulled 12 months of transaction data:
| Data Point | Value |
|---|---|
| Annual revenue | $45,000,000 |
| Total transactions | 184,000 |
| Average order value | $244.57 |
| Average list price (weighted) | $287.73 |
| Average invoice price (weighted) | $253.20 |
| Published gross margin | 28.4% |
Step 2: Map the On-Invoice Leakage
On-invoice deductions are the ones that show up between list price and invoice price.
| On-Invoice Deduction | Avg % of List Price | Annual $ Impact |
|---|---|---|
| Standard volume discounts | 7.2% | $3,240,000 |
| Promotional pricing | 2.1% | $945,000 |
| Sales rep overrides | 1.8% | $810,000 |
| Customer-specific pricing | 1.0% | $450,000 |
| Total on-invoice | 12.1% | $5,445,000 |
The invoice price of $253.20 vs. list price of $287.73 confirms this: ($287.73 - $253.20) / $287.73 = 12.0%.
Step 3: Map the Off-Invoice Leakage
These deductions happen after the invoice is created. They sit in different line items across the P&L, which is why nobody sees them as pricing leakage.
| Off-Invoice Deduction | Avg % of Invoice Price | Annual $ Impact |
|---|---|---|
| Freight absorption | 2.3% | $1,035,000 |
| Volume rebates (over-earned) | 1.1% | $495,000 |
| Early payment discounts (2/10 net 30) | 0.8% | $360,000 |
| Returns and allowances | 0.6% | $270,000 |
| Cooperative advertising | 0.3% | $135,000 |
| Total off-invoice | 5.1% | $2,295,000 |
Step 4: Calculate Total Leakage and Pocket Price
Total Leakage = On-Invoice ($5,445,000) + Off-Invoice ($2,295,000) = $7,740,000Total Leakage Rate = $7,740,000 / ($287.73 x 184,000) = 14.6%Average Pocket Price = $287.73 - ($7,740,000 / 184,000) = $245.65Their published gross margin was 28.4%. But after accounting for all leakage, the actual pocket margin was closer to 22.8%.
Step 5: Identify the Recoverable Portion
Not all leakage is recoverable. Standard volume discounts are part of the pricing strategy. The question is: which leakage is unintentional?
| Leakage Source | Annual $ | Recoverable? | Recovery Estimate |
|---|---|---|---|
| Standard volume discounts | $3,240,000 | No (intentional) | $0 |
| Promotional pricing | $945,000 | Partial (20%) | $189,000 |
| Sales rep overrides | $810,000 | Yes (60%) | $486,000 |
| Customer-specific pricing | $450,000 | Partial (30%) | $135,000 |
| Freight absorption | $1,035,000 | Yes (40%) | $414,000 |
| Volume rebates (over-earned) | $495,000 | Yes (70%) | $346,500 |
| Early payment discounts | $360,000 | No (strategic) | $0 |
| Returns and allowances | $270,000 | Partial (25%) | $67,500 |
| Cooperative advertising | $135,000 | No (contracted) | $0 |
| Total | $7,740,000 | $1,638,000 |
The recoverable amount: $1,638,000. On a $45M business, that's 3.6% of revenue going straight to the bottom line.
This aligns with what McKinsey reports: pricing improvements typically add 200 to 400 basis points to the bottom line. For this distributor, recovering even half the identified leakage would add 182 basis points.
How to Build a Margin Leakage Calculator in Excel
You can do this calculation in Excel. It won't be as fast as automated software, but for a first pass, a spreadsheet gets the job done.
The Data You Need
Pull a transaction export from your ERP. You need these columns at minimum:
- Transaction date
- Customer ID and name
- Product/SKU
- List price
- Invoice price
- Quantity
- Freight charges (if absorbed)
- Rebate credits applied
- Payment terms and discounts taken
If your ERP can't export all of this in one report, you'll need to join data from your order management, accounts receivable, and freight systems. This is where it gets tedious. Most companies we talk to spend 2-3 days just assembling the data.
Excel Column Layout
Set up your spreadsheet with these columns:
| Column | Header | Formula |
|---|---|---|
| A | Transaction ID | (from ERP) |
| B | Customer | (from ERP) |
| C | SKU | (from ERP) |
| D | Qty | (from ERP) |
| E | List Price | (from ERP) |
| F | Invoice Price | (from ERP) |
| G | Freight Absorbed | (from shipping data) |
| H | Rebates Paid | (from A/R data) |
| I | Payment Discount | (from A/R data) |
| J | Pocket Price | |
| K | Leakage ($) | |
| L | Leakage Rate | |
| M | Extended Leakage |
Key Excel Formulas
Total leakage across all transactions:
=SUMPRODUCT((E2:E10000 - J2:J10000) * D2:D10000)Weighted average leakage rate:
=SUMPRODUCT((E2:E10000 - J2:J10000) * D2:D10000) / SUMPRODUCT(E2:E10000 * D2:D10000)Leakage by customer (use a pivot table, or this formula for a specific customer in cell B2):
=SUMPRODUCT((B2:B10000=O2) * (E2:E10000 - J2:J10000) * D2:D10000)Where O2 contains the customer name you're looking up.
What to Do With the Output
Sort by column M (Extended Leakage) descending. Your top 20 rows will likely account for 60-80% of total leakage. That's your action list.
Build a pivot table grouped by:
- Customer - which customers have the highest leakage rate?
- Product category - are certain categories leaking more than others?
- Sales rep - is one rep giving away more margin than others?
- Month - is leakage seasonal or getting worse over time?
For a more detailed walkthrough of margin calculations in Excel, see our guide on margin analysis in Excel.
Leakage Benchmarks by Company Size
Where does your leakage rate fall? Here's what we see across distribution and manufacturing companies at different revenue levels.
| Revenue Range | Typical Leakage Rate | Typical Annual $ Leaked | Primary Leakage Source |
|---|---|---|---|
| $10M - $25M | 2% - 4% | $200K - $1M | Sales rep overrides, no approval process |
| $25M - $50M | 3% - 5% | $750K - $2.5M | Discount stacking, freight absorption |
| $50M - $100M | 3% - 6% | $1.5M - $6M | Rebate mismanagement, customer-specific pricing drift |
| $100M - $200M | 4% - 7% | $4M - $14M | All of the above, plus cross-division inconsistency |
The leakage rate tends to increase with revenue because pricing gets more complex. More customers, more SKUs, more sales reps making pricing decisions, more exceptions to track. A $150M distributor might have 40 sales reps each managing their own customer pricing in Excel. That's 40 sources of uncoordinated margin leakage.
The NAW found that distributors who implement structured pricing governance outperform industry average profitability by 50% to 200%. That's not a typo. The gap between companies who manage pricing intentionally and those who don't is enormous.
Price Waterfall: Visualizing Where Leakage Happens
The best way to find margin leakage is a price waterfall analysis. A price waterfall charts every deduction from list price to pocket price, making each leak visible.
Here's the waterfall for our $45M distributor example:
| Stage | Price | Deduction | Cumulative Drop |
|---|---|---|---|
| List Price | $287.73 | - | 0% |
| After volume discounts | $267.01 | -$20.72 | 7.2% |
| After promo pricing | $260.97 | -$6.04 | 9.3% |
| After rep overrides | $255.79 | -$5.18 | 11.1% |
| After customer-specific | $252.91 | -$2.88 | 12.1% |
| Invoice Price | $252.91 | 12.1% | |
| After freight absorption | $247.09 | -$5.82 | 14.1% |
| After rebates | $244.37 | -$2.72 | 15.1% |
| After payment discounts | $242.35 | -$2.02 | 15.8% |
| After returns/allowances | $240.87 | -$1.48 | 16.3% |
| After co-op advertising | $240.13 | -$0.74 | 16.5% |
| Pocket Price | $240.13 | 16.5% |
Everything above the Invoice Price line is visible in your sales data. Everything below it is hidden across other departments. That's why companies that only look at invoice-level data underestimate their leakage by 30-40%.
For a deeper dive into waterfall construction, see our price waterfall analysis guide and the related margin analysis guide.
Common Calculation Mistakes
These mistakes show up in almost every margin leakage analysis we review.
Mistake 1: Using invoice price as pocket price. The invoice price only captures on-invoice discounts. Off-invoice deductions (freight, rebates, terms, allowances) can add another 5-8% of leakage that you're completely missing.
Mistake 2: Calculating leakage on averages instead of transactions. Averaging hides the outliers. Your overall leakage rate might be 4%, but that's a mix of customers at 1% and customers at 15%. The average tells you nothing actionable. Calculate per-transaction, then aggregate.
Mistake 3: Ignoring COGS changes. If your cost went up 6% and you raised prices 4%, that's 2% margin erosion, but it's not leakage. Leakage is specifically the gap between your intended price and your actual pocket price. Don't confuse margin erosion from cost pressure with leakage from pricing execution gaps.
Mistake 4: Counting intentional discounts as leakage. A volume discount to your #1 customer that was approved at the right tier is not leakage. It's strategy. Leakage is the discount that shouldn't have been applied, the rebate that wasn't earned, the freight that wasn't supposed to be free. Distinguish between intentional price reductions and execution failures.
Mistake 5: Running the analysis once. Leakage is ongoing. A one-time analysis tells you the current state, but leakage patterns change as customers, reps, and promotions shift. Build the calculator to run monthly.
When to Move Beyond Excel
Excel works for a first-pass calculation. It stops working when:
- You have more than 50,000 transactions per year and pivot tables start lagging
- You need to pull data from three or more systems (ERP, freight, A/R) every month
- Multiple people need access to the same analysis
- You want to track leakage trends over time automatically
- You need alerts when a transaction exceeds a leakage threshold
At that point, you need a tool that connects to your transaction data, calculates pocket price automatically, and surfaces leakage without 2-3 days of manual data assembly each month.
That's what Pryse does. Upload your transaction CSV, and you get a price waterfall visualization, automated leakage detection, and dollar-quantified recovery opportunities in 24 hours instead of weeks. It's built for distributors and manufacturers who have outgrown Excel but aren't ready for a $100K/year enterprise pricing platform.
FAQ
What is the margin leakage formula?
Margin Leakage ($) = List Price - Pocket PriceThe pocket price is your invoice price minus all off-invoice deductions: freight absorbed, rebates paid, early payment discounts, returns, allowances, and any other post-sale costs. The leakage rate is this dollar amount divided by the list price, expressed as a percentage.
What is a normal margin leakage rate for distributors?
Most distributors see a total leakage rate (list to pocket) between 12% and 20%. The recoverable portion, meaning the unintentional or mismanaged portion, typically runs 2% to 5% of revenue. According to NAW research, distributors who implement pricing governance can recover 800+ basis points of margin.
How do I calculate margin leakage in Excel?
Build a transaction-level spreadsheet with list price, invoice price, and all off-invoice deductions as separate columns. Calculate pocket price as invoice price minus off-invoice deductions. Leakage is list price minus pocket price. Use SUMPRODUCT to calculate weighted averages across your full dataset. See the Excel section above for exact formulas.
What are the most common sources of margin leakage?
In distribution: unauthorized sales rep overrides, discount stacking (multiple discounts applied to one order without approval), freight absorption on accounts that should pay shipping, rebates paid to customers who didn't hit volume thresholds, and payment term costs on extended net terms. Freight is the most overlooked because it shows up as a shipping expense rather than a price reduction.
How much revenue can I recover by fixing margin leakage?
McKinsey's research indicates that pricing improvements typically add 200 to 400 basis points to the bottom line. For a $50M distributor, that's $1M to $2M in annual margin recovery. The actual amount depends on how much unmanaged leakage exists. Companies with no pricing governance typically recover more; those with mature pricing processes have less to find.
What is the difference between margin leakage and margin erosion?
Margin leakage is profit lost through gaps in pricing execution: discounts applied incorrectly, rebates overpaid, freight absorbed unnecessarily. You can fix leakage by tightening controls. Margin erosion is the broader decline in margins from cost increases, competitive price pressure, commodity market shifts, and product mix changes. Erosion requires strategic responses like renegotiating supplier costs or repositioning products.
How often should I calculate margin leakage?
Run a full leakage analysis quarterly. Monitor key leakage indicators (override rate, average discount depth, freight absorption rate) monthly. Set up alerts for individual transactions that exceed your leakage threshold. The companies that recover the most margin are the ones tracking it continuously, not the ones running a study once a year.
Last updated: January 29, 2026
Frequently Asked Questions

Want to analyze your entire product catalog?
Pryse automatically identifies margin leakage across thousands of SKUs. Upload your data and find hidden profit in 24 hours.
One-time $1,499 diagnostic. No subscription required.