Margin Leakage Formula: How to Calculate Every Dollar You're Losing
Learn the margin leakage formula with worked examples. Calculate leakage rate, annualized loss, and per-SKU erosion for distribution and manufacturing.
The margin leakage formula is the difference between the margin you expected to earn and the margin you actually earned on a transaction, customer, or product line.
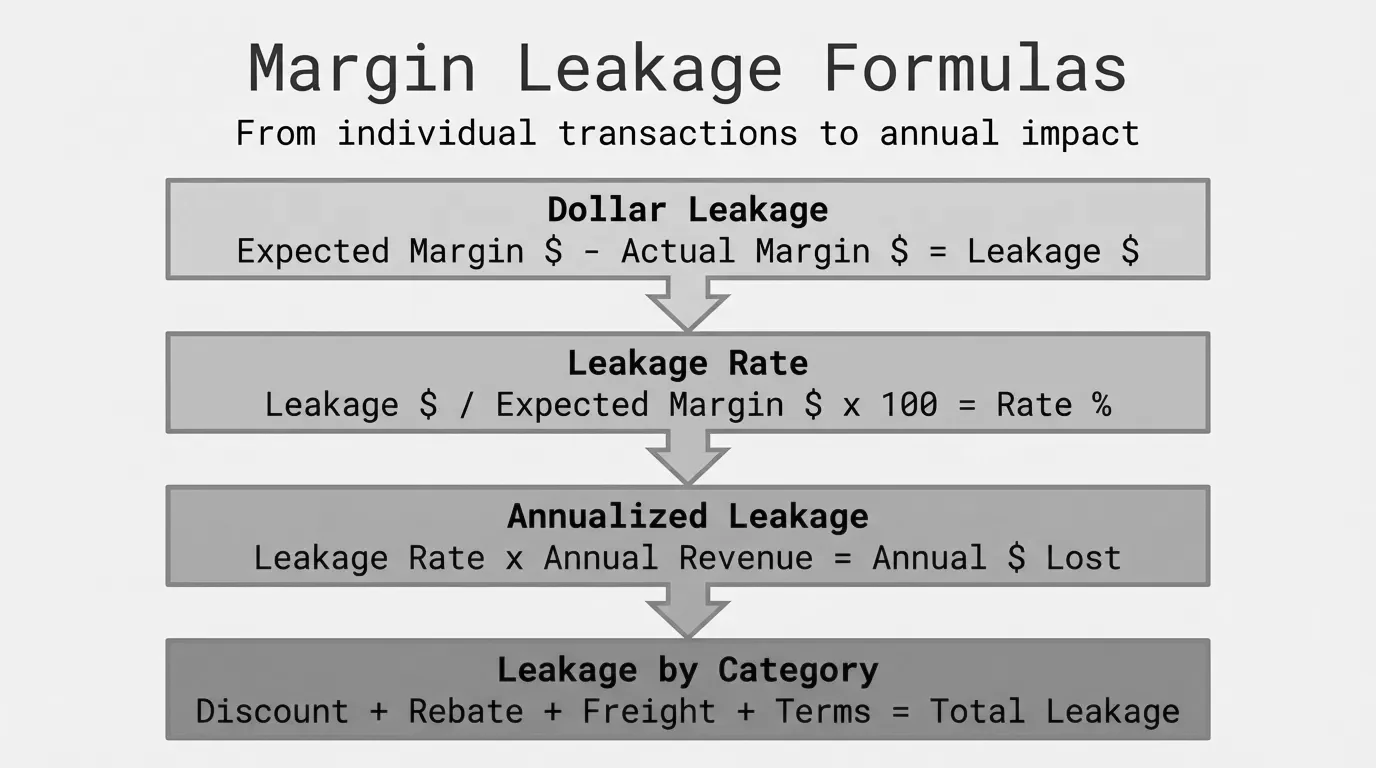
Margin Leakage = Expected Margin - Actual MarginThat's the core of it. Everything else — leakage rates, annualized loss projections, category breakdowns — builds on this one comparison. If your target gross margin on a product is 32% and you actually realized 24%, you leaked 8 percentage points. On a $100,000 revenue line, that's $8,000 gone.
McKinsey's research on pricing found that off-invoice price deductions alone average 16.3% of list price across companies they studied. When combined with on-invoice discounts, the actual "pocket price" can land 20-30% below what appears on the invoice. For a mid-market distributor doing $50M in revenue, even a conservative 3% leakage rate means $1.5M walking out the door every year.
This post breaks down every formula variation you need, with worked examples you can plug into your own data today. For the full picture on what causes leakage and how to stop it, see our margin leakage guide.
The Core Margin Leakage Formula
Let's start with the formula in dollar terms, since that's what gets attention in a management meeting.
Margin Leakage ($) = (Expected Margin % - Actual Margin %) x RevenueThis works at any level — per transaction, per customer, per SKU, or across the whole business.
Defining Expected Margin
Your expected margin is whatever you intended to earn when you set the price. This might be:
- List price margin: the margin built into your published price list
- Target margin by category: the minimum acceptable margin your pricing team set for a product group
- Contract margin: the margin agreed upon when the customer contract was signed
- Budget margin: the margin baked into your annual operating plan
Pick whichever makes sense for the analysis you're running. Most distributors I've worked with use their target margin by product category as the baseline, since list price margins are often inflated starting points that nobody actually expects to collect.
Defining Actual Margin
Actual margin is what you realized after every deduction hit. This is where it gets tricky, because you need to include both on-invoice and off-invoice items.
Actual Margin = (Pocket Price - True COGS) / Pocket Price x 100"Pocket price" is the revenue you actually kept. "True COGS" includes landed cost, not just the purchase price. If you're not familiar with pocket price calculations, our price waterfall analysis guide walks through the full breakdown.
Worked Example: Single Transaction
Say you sell industrial fasteners. A box of 1/4-20 hex bolts has:
- List price: $48.00
- Target margin: 35%
- Customer negotiated price: $42.50 (11.5% discount)
- Volume rebate owed to customer: 2% ($0.85)
- Freight absorbed: $1.20
- True COGS (landed): $29.50
Here's the math:
Pocket Price = $42.50 - $0.85 - $1.20 = $40.45Actual Margin = ($40.45 - $29.50) / $40.45 = 27.1%Margin Leakage = 35% - 27.1% = 7.9 percentage pointsMargin Leakage ($) = 7.9% x $42.50 = $3.36 per unit soldThat $3.36 doesn't look like much on a single box of bolts. But if you move 15,000 units a year of this SKU, it's $50,400 in annual leakage from one product.
Margin Leakage Rate Formula
The leakage rate tells you what fraction of your expected margin you're actually losing. It's useful for comparing leakage severity across different product categories or customers with very different price points.
Leakage Rate (%) = (Margin Leakage / Expected Margin) x 100Using the fastener example above:
Leakage Rate = (7.9% / 35%) x 100 = 22.6%That means you're losing nearly a quarter of your intended margin on this product. Here's how to interpret leakage rates:
| Leakage Rate | Severity | Typical Cause |
|---|---|---|
| Under 5% | Normal | Minor rounding, small contract adjustments |
| 5-10% | Worth monitoring | Competitive discounting, modest freight costs |
| 10-20% | Problem | Stale pricing, unmanaged rebates, cost increases not passed through |
| 20-30% | Serious | Unauthorized discounts, broken contract terms, systematic pricing gaps |
| Over 30% | Critical | Pricing policy breakdown, negative-margin transactions likely present |
Most mid-market distributors we see fall in the 10-20% range without realizing it. BCG's 2020 survey found that 45% of executives consider revenue leakage a systematic problem in their business.
Annualized Margin Leakage Formula
To project total leakage across your business, you need to aggregate by whatever dimension matters — customer, product category, sales rep, or branch.
Annualized Leakage = Sum of (Leakage per Transaction x Annual Volume) across all itemsOr, at the aggregate level:
Annualized Leakage = (Weighted Avg Expected Margin % - Weighted Avg Actual Margin %) x Annual RevenueWorked Example: Category-Level Annualized Leakage
Let's say you're a $75M electrical supply distributor and you pull margin data across three product categories:
| Category | Annual Revenue | Target Margin | Actual Margin | Leakage % | Annual Leakage ($) |
|---|---|---|---|---|---|
| Wire & Cable | $28,000,000 | 28% | 23.5% | 4.5% | $1,260,000 |
| Lighting | $22,000,000 | 34% | 28.1% | 5.9% | $1,298,000 |
| Switchgear | $25,000,000 | 31% | 29.2% | 1.8% | $450,000 |
| Total | $75,000,000 | 30.7% | 26.7% | 4.0% | $3,008,000 |
Three million dollars. That's real money that never showed up on anyone's income statement as a line item called "margin leakage." It's just baked into the results as lower-than-expected gross profit, and people shrug and say "market conditions" or "competitive pressure."
The category breakdown is where the insight lives. Wire & cable leaks at a high dollar amount because of volume, but lighting has the highest leakage rate. Different problems require different fixes.
Leakage by Source Formula
Once you know the total leakage, you need to decompose it by cause. The price waterfall gives you the structure, but the formula is straightforward.
Source Leakage = Expected Value of Deduction - Actual Value of DeductionFor each line in the waterfall — volume discounts, promotional pricing, rebates, freight, payment terms — you compare what you planned to give versus what you actually gave. The difference is leakage from that source.
The Major Leakage Sources
Here are the typical deduction categories in a distributor's waterfall, with formulas for each:
Discount leakage:
Discount Leakage = Actual Discount Given - Authorized Discount LevelIf your pricing matrix says this customer qualifies for an 8% discount but your rep gave 12%, the leakage is 4 percentage points on every dollar of that sale.
Rebate leakage:
Rebate Leakage = Rebates Paid - Rebates Earned by Customer ActivityThis catches customers who receive volume rebates but didn't actually hit the volume threshold, or rebates that continue past contract expiration.
Freight leakage:
Freight Leakage = Freight Cost Absorbed - Freight Recovered from CustomerMany distributors have free freight thresholds (e.g., free shipping on orders over $500). Freight leakage happens when the threshold is too low, or when sales reps override it.
Payment terms leakage:
Payment Terms Cost = (Discount % / (1 - Discount %)) x (360 / (Full Pay Days - Discount Days))A 2/10 net 30 term costs you the equivalent of 36.7% annualized. If 60% of your customers take the early-pay discount, that's a real cost that should show up in your leakage analysis.
Cost-increase leakage:
Cost Increase Leakage = (New COGS - Old COGS) x Units Sold at Old PriceThis one hits manufacturers and distributors hard. Your supplier raises prices 6%, you don't update customer pricing for 90 days, and every unit sold in that window leaks margin. For a fast-moving SKU, that window bleeds real money.
Worked Example: Source Decomposition
Back to our $75M electrical distributor. Here's where the $3M in leakage actually comes from:
| Leakage Source | Annual Impact | % of Total Leakage |
|---|---|---|
| Unauthorized/excess discounts | $890,000 | 29.6% |
| Cost increases not passed through | $720,000 | 23.9% |
| Rebate overpayment | $510,000 | 17.0% |
| Freight absorption | $430,000 | 14.3% |
| Payment term costs | $310,000 | 10.3% |
| Pricing errors (wrong price applied) | $148,000 | 4.9% |
| Total | $3,008,000 | 100% |
Now you know where to focus. Unauthorized discounts and cost passthrough delays account for over half the leakage. That's two workstreams, not twenty.
Customer-Level Leakage Formula
Not all customers leak equally. The customer-level formula helps you identify which accounts need pricing attention.
Customer Leakage = Sum of (Expected Margin - Actual Margin) across all transactions for that customerCustomer Leakage Rate = Customer Leakage / Customer Revenue x 100The Pareto Pattern
In almost every distribution company I've analyzed, leakage follows an 80/20 pattern — but it's not the pattern you'd expect. Your largest customers often have the tightest margins by design (you gave them volume pricing intentionally). The biggest leakage rates tend to cluster in your mid-tier accounts: customers large enough to have negotiated discounts but not large enough to be on anyone's pricing radar.
Here's a sample output:
| Customer | Revenue | Expected Margin | Actual Margin | Leakage Rate | Annual Leakage |
|---|---|---|---|---|---|
| Acme Industrial | $2,400,000 | 22% | 20.8% | 1.2% | $28,800 |
| Baker Electric | $890,000 | 30% | 21.3% | 8.7% | $77,430 |
| Central Supply | $340,000 | 33% | 18.6% | 14.4% | $48,960 |
| Delta Contractors | $1,100,000 | 28% | 25.1% | 2.9% | $31,900 |
Baker Electric is the red flag here. An 8.7% leakage rate on nearly $900K in revenue produces the largest dollar leakage despite being the second-largest account. Central Supply has an even worse leakage rate, but the smaller revenue base means lower absolute impact.
This is exactly the kind of analysis described in our margin analysis guide — segmenting customers by profitability to find the ones where pricing action will produce the biggest return.
SKU-Level Leakage Formula
For manufacturers and distributors with thousands of SKUs, you need to calculate leakage at the product level too.
SKU Leakage = (Target Margin % - Actual Margin %) x SKU RevenueSKU Leakage per Unit = Target Pocket Price - Actual Avg Pocket PriceVelocity-Weighted Leakage
A low-volume SKU leaking 15% barely matters. A high-volume SKU leaking 3% might cost you more. Weight your analysis by volume.
Velocity-Weighted Leakage = SKU Leakage Rate x Annual Units Sold x Avg Selling Price| SKU | Units/Year | Avg Price | Target Margin | Actual Margin | Leakage ($) |
|---|---|---|---|---|---|
| WC-10AWG-500 | 8,200 | $187.50 | 28% | 24.1% | $59,925 |
| LT-LED-4FT | 24,500 | $12.80 | 38% | 33.5% | $14,112 |
| SW-200A-3P | 340 | $1,450.00 | 26% | 25.2% | $3,944 |
| WC-12AWG-250 | 15,800 | $82.00 | 30% | 22.8% | $93,168 |
WC-12AWG-250 is your worst offender — not because it has the highest leakage rate (it does, at 7.2%), but because the combination of rate and volume produces the largest dollar impact. That single SKU accounts for more leakage than the next three combined.
Implementing the Formulas in Excel
If you're running this analysis in Excel (and most $20M-$200M distributors are), here are the patterns that work.
Data Setup
You need a transaction-level export with these columns at minimum:
| Column | Field | Example |
|---|---|---|
| A | Invoice Number | INV-2026-4481 |
| B | Customer ID | CUST-1042 |
| C | SKU | WC-10AWG-500 |
| D | Quantity | 12 |
| E | Unit Selling Price | $187.50 |
| F | Line Revenue | $2,250.00 |
| G | Unit COGS | $138.00 |
| H | Discount % Applied | 14% |
| I | Rebate Accrual | $45.00 |
| J | Freight Cost | $28.00 |
Key Formulas
Actual margin per line:
=((F2 - I2 - J2) - (G2 * D2)) / (F2 - I2 - J2)This gives you pocket margin per transaction line. F2 is revenue, I2 is rebate, J2 is freight, G2 is unit COGS, D2 is quantity.
Target margin lookup (using VLOOKUP against a pricing table):
=VLOOKUP(C2, PricingTable, 4, FALSE)Where column 4 of your pricing table contains the target margin for each SKU.
Leakage per line:
=MAX(0, (VLOOKUP(C2, PricingTable, 4, FALSE) - K2)) * F2Where K2 is the actual margin you calculated. The MAX(0,...) prevents negative leakage from inflating the total — if you're beating target on a line, that's margin outperformance, not negative leakage. Track it separately.
Total leakage by customer (SUMIF):
=SUMIF(B:B, "CUST-1042", L:L)Where column L contains your per-line leakage dollars.
Total leakage by product category (SUMIFS):
=SUMIFS(L:L, M:M, "Wire & Cable")Where column M contains the product category.
Pivot Table Approach
Honestly, once you have columns for actual margin, target margin, and leakage dollars, a pivot table does most of the heavy lifting. Drop customer or SKU into rows, and sum leakage dollars in values. Sort descending. The top 20 entries will tell you where to start.
The limitation with Excel is scale. If you have 50,000+ transaction lines per month, the spreadsheet gets slow and formulas get fragile. That's where tools like Pryse come in — you upload the CSV and get the same analysis in minutes instead of days.
Common Calculation Mistakes
After seeing dozens of margin leakage analyses from distribution and manufacturing companies, the same errors keep showing up.
Mistake 1: Using Invoice Price Instead of Pocket Price
This is the big one. If you calculate margin using invoice revenue (what's on the bill) instead of pocket revenue (what you actually collect after rebates, freight, and terms), you'll undercount leakage by 10-20%. McKinsey's research on a global lighting company found the pocket price was roughly half the list price — and 16.3 percentage points of that gap came from deductions that never appeared on an invoice.
Fix: Always start with pocket price. Include rebate accruals, freight costs absorbed, payment term discounts, and any other off-invoice deductions.
Mistake 2: Using Purchase Price Instead of Landed Cost
Your COGS isn't what you paid the supplier. It's what you paid plus inbound freight, warehousing allocation, and any handling costs. Using the PO price overstates your margin and undercounts leakage.
Landed Cost = Purchase Price + Inbound Freight + Warehouse Allocation + HandlingFor most distributors, landed cost runs 3-8% above purchase price.
Mistake 3: Setting Unrealistic Target Margins
If your target margin for a commodity category is 35% but no one in the industry earns above 22%, every sale will show as "leaking." That's not leakage — it's a bad benchmark. Set targets based on:
- What you've actually achieved on your best transactions in that category
- Published industry benchmarks for your segment
- What your pricing matrix was designed to produce, not aspirational goals from five years ago
Mistake 4: Ignoring Mix Effects
Your overall margin can decline even when every individual SKU's margin stays flat. If your product mix shifts toward lower-margin items (customers buying more commodity wire and less specialty lighting), aggregate leakage calculations will show a problem that doesn't exist at the item level.
Fix: Always run leakage at the SKU or category level first. Then aggregate. If SKU-level leakage is low but aggregate leakage is high, you have a mix problem, not a pricing problem.
Mistake 5: Counting Intentional Discounts as Leakage
A negotiated volume discount for your largest customer isn't leakage. It's a pricing decision. Leakage is the gap between what you decided to charge and what you actually collected.
This means your "expected margin" for a customer on a negotiated contract should be the contract margin, not the list margin. Otherwise, every contracted customer looks like a leak.
Building a Recurring Leakage Dashboard
One-time leakage analysis is useful. Monthly tracking is where the real value sits. Here's a minimal dashboard structure:
Monthly Metrics to Track
| Metric | Formula | Target |
|---|---|---|
| Total Leakage ($) | Sum of all line-level leakage | Trending down |
| Leakage Rate (%) | Total Leakage / Total Revenue | Under 5% |
| Top 10 Leaking Customers | Ranked by leakage $ | Review monthly |
| Top 10 Leaking SKUs | Ranked by leakage $ | Review monthly |
| Leakage by Source | Decomposed by cause | Shift from discount to non-discount causes |
| Cost Passthrough Lag | Avg days between cost increase and price update | Under 30 days |
What Good Looks Like
A well-managed distributor running $50M-$100M in revenue should aim for:
- Overall leakage rate below 5%
- No customer with a leakage rate above 15% (unless it's a strategic, temporary situation)
- Cost passthrough lag under 30 days
- Less than 1% of transactions at negative pocket margin
- Leakage trending flat or down quarter over quarter
If you're above these thresholds, the math in this post will show you exactly where the dollars are going. If you want to skip the spreadsheet work, Pryse runs this analysis automatically from a CSV upload and delivers results in 24 hours.
How Margin Leakage Connects to the Price Waterfall
The margin leakage formula and the price waterfall are two sides of the same coin. The waterfall shows you the path from list price to pocket price — every discount, rebate, and cost that chips away at your revenue. The leakage formula compares the result of that waterfall against what you intended.
Think of it this way:
Price Waterfall = The "what happened"Margin Leakage = The "versus what should have happened"You need both. The waterfall without a leakage calculation is just accounting. The leakage calculation without a waterfall doesn't tell you which deductions are out of bounds. Together, they give you a precise map of where money is disappearing and how much you can recover.
For most mid-market distributors and manufacturers, recovering even half of identified leakage adds 1-2 percentage points to gross margin. On $75M revenue, that's $750K-$1.5M in annual profit improvement — without selling a single additional unit.
Frequently Asked Questions
What is the margin leakage formula?
Margin Leakage = Expected Margin - Actual Margin. In dollar terms: (Expected Margin % - Actual Margin %) x Revenue. This measures the gap between the profit you planned to earn and what you actually realized after all discounts, rebates, freight, payment terms, and cost changes.
What is a normal margin leakage rate?
Below 5% is solid performance for a distribution or manufacturing company. Most mid-market companies we analyze run between 7% and 15%. Above 15% typically signals systemic pricing problems — expired contracts still in effect, unauthorized discounting, or cost increases that haven't been passed through in months.
How do I calculate margin leakage in Excel?
Export transaction-level data with revenue, COGS, discounts, rebates, and freight. Calculate actual pocket margin per line. Look up target margin from your pricing table using VLOOKUP. Subtract actual from target and multiply by revenue to get dollar leakage. Use SUMIF to aggregate by customer or SKU.
What are the biggest sources of margin leakage in distribution?
Unauthorized or excess discounting (reps giving more than the pricing matrix allows), cost increases from suppliers not reflected in customer pricing, rebate overpayments, freight absorption, and payment term costs. Of these, excess discounting and cost passthrough delays typically account for 50%+ of total leakage.
How does margin leakage differ from margin erosion?
Margin leakage is a point-in-time measurement: the gap between expected and actual margin on specific transactions. Margin erosion is a trend: declining margins over time. Leakage is one of the causes of erosion. You can have leakage without erosion (if you're also improving margins elsewhere) or erosion without leakage (if the market is genuinely compressing).
Can margin leakage be negative?
In this framework, no. If actual margin exceeds expected margin, that's outperformance, not negative leakage. Track outperformance separately. Mixing the two nets them out and hides the real leakage behind a "net" number that looks better than reality.
How often should I calculate margin leakage?
Monthly at minimum. Weekly if you have the data infrastructure. The value of leakage analysis compounds with frequency because you catch problems faster. A cost increase that goes unaddressed for 90 days leaks three times as much as one caught in 30 days.
Last updated: January 29, 2026
Frequently Asked Questions

Want to analyze your entire product catalog?
Pryse automatically identifies margin leakage across thousands of SKUs. Upload your data and find hidden profit in 24 hours.
One-time $1,499 diagnostic. No subscription required.