Pocket Price Waterfall: How to Find Your True Margin
A pocket price waterfall shows how list price erodes to actual margin. Learn the components, build your own, and find hidden profit in transaction-level data.
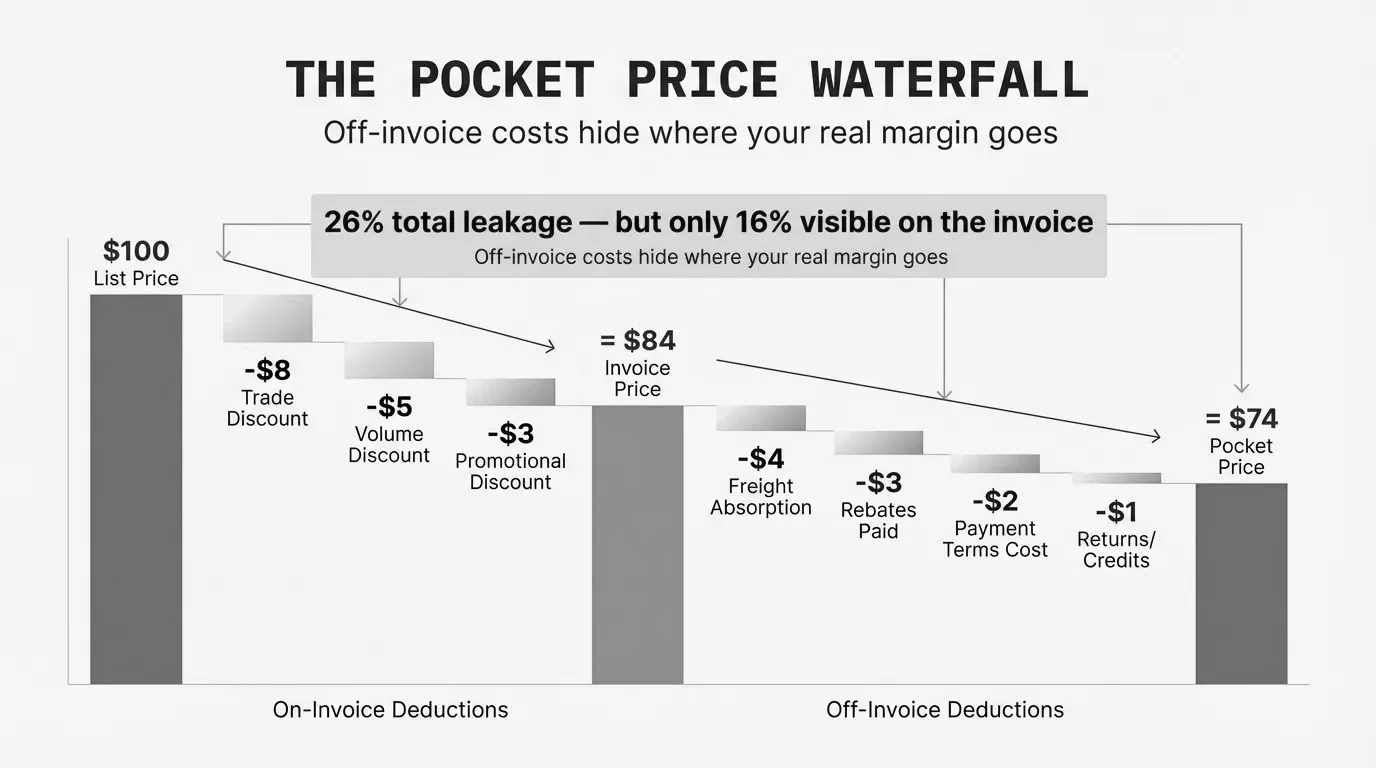
A pocket price waterfall is a visualization showing how list price erodes to pocket price through sequential deductions: invoice discounts, off-invoice rebates, freight costs, payment terms, and other allowances.
The concept comes from McKinsey research in the 1990s, and it exposed a problem most companies still have: the gap between what they think they're charging and what they actually collect is much larger than expected.
McKinsey's analysis of a lighting manufacturer found that invoice prices ran 32.8% below list. That's the visible erosion. But off-invoice costs added another 16.3 percentage points. The company's average pocket price was roughly half the standard list price.
That erosion wasn't in any single report. It was scattered across invoices, rebate accruals, freight bills, and AR aging. The pocket price waterfall brings it into one view.
List Price vs. Invoice Price vs. Pocket Price
These three prices measure different things. Most companies track the first two. Few track the third.
| Price Level | What It Represents | Typical Gap from List |
|---|---|---|
| List price | Published price before any discounts | Baseline |
| Invoice price | Price after on-invoice discounts | 25-40% below list |
| Pocket price | Actual cash collected after all costs | 35-55% below list |
List price is the starting point. It's published, standardized, and rarely what anyone pays.
Invoice price is what appears on the customer's bill after applying on-invoice discounts: volume breaks, promotional pricing, customer-specific deals. This is what most ERP systems track. This is what sales teams think they're achieving.
Pocket price is the actual revenue collected after subtracting everything else: rebates, freight you absorbed, early payment discounts taken, cooperative advertising funds, returns, and any other off-invoice concession. This is the number that matters.
Pocket Price = Invoice Price - Off-Invoice Deductions
Pocket Margin = Pocket Price - Cost of Goods Sold
The gap between invoice price and pocket price is where margin hides. And because off-invoice costs don't appear on the invoice or in the order management system, most companies don't see them until someone builds a waterfall.
Components of the Pocket Price Waterfall
A pocket price waterfall has two sections: on-invoice deductions and off-invoice deductions. Each bar represents money leaving the transaction.
On-Invoice Deductions
These appear on the invoice. They're visible but often uncoordinated.
| Component | Typical Range | What Drives It |
|---|---|---|
| Standard distributor discount | 10-20% | Channel pricing policy |
| Volume discount | 2-8% | Order size or annual volume |
| Promotional discount | 3-10% | Campaigns, seasonal pushes |
| Special pricing agreement | 5-15% | Customer negotiation |
| Competitive match | Variable | Price protection to retain customer |
For a company with standard list prices, on-invoice discounts typically total 25-40%. Industry analysis shows sales teams often believe they're giving "only 10%" when actual on-invoice discounting runs much higher.
Off-Invoice Deductions
These don't appear on any invoice. They're buried in separate systems: rebate accruals, freight invoices, AR aging, and promotional expense reports.
| Component | Typical Range | Where It Hides |
|---|---|---|
| Annual volume rebates | 2-5% | Accruals, vendor statements |
| Payment term cost | 1-3% | AR aging, cost of capital |
| Freight absorption | 2-5% | Freight invoices, delivery logs |
| Cooperative advertising | 1-3% | Marketing expense |
| Returns and allowances | 1-3% | Credits, RMA reports |
| Special services | 0.5-2% | Customer-specific cost tracking |
McKinsey's lighting company study found 16.3 percentage points of revenue reduction from off-invoice costs. Cash discounts for prompt payment, accounts receivable carrying costs, co-op advertising, volume rebates, promotional programs, and freight all contributed.
The problem: finance sees these costs in aggregate. They show up as line items in the P&L. What finance doesn't see is which customers drive which costs. A customer getting 60-day terms, free freight, and annual rebates costs 8-15% more to serve than one on standard terms paying for shipping.
How to Build a Pocket Price Waterfall
Building a waterfall requires pulling data from multiple systems. Here's the process.
Step 1: Start with List Price
Pull your published list prices by SKU or product category. If you don't have standardized list prices, use target prices or the highest price you actually charge.
Step 2: Layer On-Invoice Discounts
Export transaction data from your ERP or order management system. Calculate the average discount from list to invoice price, broken into categories:
- Standard channel/customer class discount
- Volume or quantity breaks
- Promotional discounts
- Negotiated customer-specific pricing
- Other on-invoice adjustments
Step 3: Add Off-Invoice Deductions
This is harder. You'll need data from:
- Rebate accruals: What rebates are you paying annually? Divide by the revenue those customers generated.
- Freight costs: What freight did you absorb versus charge? Compare outbound freight expense to freight recovery.
- Payment terms: What's the average days-to-pay? Calculate the carrying cost using your cost of capital.
- Co-op and marketing funds: What promotional allowances or marketing support did you provide?
- Returns and allowances: What credits or returns did you process?
Step 4: Calculate Pocket Price and Margin
Invoice Price = List Price - On-Invoice Discounts
Pocket Price = Invoice Price - Off-Invoice Deductions
Pocket Margin = (Pocket Price - COGS) / Pocket Price
Step 5: Segment by Customer or Product
Average waterfalls hide the story. The power is in segmentation. Build waterfalls for:
- Top 20 customers by revenue
- Customer segments (by size, industry, geography)
- Product categories
- Sales rep territories
You'll find pocket margins vary 20+ points across customers who look similar on the surface.
Pocket Price Waterfall Example: A $45M Distributor
Here's a realistic scenario for a mid-market distributor with $45M in revenue.
Company profile:
- Industrial MRO distributor
- $45M annual revenue
- 3,500 active customers
- 25% average gross margin (on invoice price)
Waterfall analysis results:
| Component | Amount | % of List Price |
|---|---|---|
| List Price | $60,000,000 | 100.0% |
| Standard discount | -$6,000,000 | -10.0% |
| Volume discount | -$3,000,000 | -5.0% |
| Promotional pricing | -$2,400,000 | -4.0% |
| Negotiated pricing | -$3,600,000 | -6.0% |
| Invoice Price | $45,000,000 | 75.0% |
| Annual rebates | -$1,350,000 | -2.3% |
| Payment term cost | -$675,000 | -1.1% |
| Freight absorption | -$1,125,000 | -1.9% |
| Co-op advertising | -$450,000 | -0.8% |
| Returns/allowances | -$540,000 | -0.9% |
| Pocket Price | $40,860,000 | 68.1% |
This distributor thinks they're selling at 25% off list (75% of list price). Their pocket price is actually 68.1% of list—32% total erosion versus the 25% they thought.
The hidden erosion: $4.14M in off-invoice costs ($45M invoice - $40.86M pocket) that didn't appear on any customer invoice. That's 9.2% of invoice revenue invisible in transaction-level reporting.
Margin impact:
Reported gross margin (on invoice price): 25.0%
COGS: $33,750,000
Pocket margin: ($40,860,000 - $33,750,000) / $40,860,000 = 17.4%
The company's actual margin is 17.4%, not 25%. That 7.6-point gap is the margin leakage hiding in the waterfall.
Common Margin Leakage Found in Waterfalls
After building waterfalls for mid-market distributors and manufacturers, the same problems appear repeatedly.
Payment Terms Growing Without Price Adjustment
A customer negotiated 30-day terms five years ago. They now pay in 55 days on average. Nobody adjusted pricing.
The math: If your cost of capital is 8%, a customer paying in 55 days versus 30 days costs you an extra 0.55% on every dollar of revenue. For a $2M customer, that's $11,000/year in carrying cost you're eating.
Freight Absorption on Small Orders
The sales team promises "free shipping" to close deals. Nobody tracks which customers get it or what it costs.
Typical finding: 40-60% of freight expense on orders under $500 is absorbed rather than charged. On a $50M distributor with 15% small orders, that's $375K-$750K in unrecovered freight.
Rebates Not Reflected in Customer Profitability
Customers getting 3-5% annual rebates are evaluated on invoice margin like everyone else. The rebate cost is expensed separately.
Result: Your "most profitable" customers may actually be margin-negative when rebates are included. Analysis of distributor invoice data shows using manual overrides and special pricing reliably reduces margins by 7-10 points.
Pocket Price Band: Wide Variation Across Similar Customers
McKinsey calls the distribution of pocket prices across transactions the "pocket price band." In the lighting company study, some transactions ran pocket prices at 30% of list. Others were at 90%—a 3x difference.
The band isn't random. McKinsey found that many large customers received modest discounts and high pocket prices. Meanwhile, small buyers with long-standing relationships got much greater discounts and lower pocket prices than their size would justify. These experienced customers were working the pocket price waterfall to their advantage.
Old Agreements Never Reviewed
Customer-specific prices set during competitive battles in 2019 are still active in 2026. Volume commitments that justified those prices were never met. Nobody noticed because nobody looked.
Finding rate: NAW research suggests most distributors leave at least 2 percentage points of gross margin on the table through pricing inconsistency. On $50M, that's $1M sitting in outdated pricing agreements.
The $500K Question: What's Hiding in Your Waterfall?
McKinsey's research found that by consciously managing all elements of the pocket price waterfall, companies can capture an additional 1% or more in realized prices. For a $50M company, that's $500K minimum.
The typical distribution of margin leakage:
| Source | Recoverable Margin | Notes |
|---|---|---|
| Customer pricing inconsistency | 1-3% | Similar customers paying different prices |
| Freight and delivery | 0.5-2% | Unrecovered shipping on small orders |
| Payment terms | 0.3-1% | Slow payers not charged for carrying cost |
| Rebate program structure | 0.5-1.5% | Rebates not tied to margin contribution |
| Total potential | 2.3-7.5% |
For context: a price increase of 1% generates an 8% increase in operating profits for the average company, according to McKinsey. The effect works both directions. Every point of margin leakage you're not seeing is cutting 8% off your operating profit.
From Waterfall to Action
The pocket price waterfall isn't an academic exercise. It's a diagnostic that tells you where to focus.
High-impact actions from waterfall analysis:
-
Set minimum order sizes for free freight. If orders under $500 run negative pocket margin after freight, either charge for shipping or set a $500 minimum.
-
Review customer-specific pricing annually. Any negotiated price over 12 months old gets re-evaluated against current volume and cost-to-serve.
-
Price payment terms. If standard terms are net-30, customers on net-60 pay 1-2% more. Build it into the price matrix.
-
Tie rebates to margin, not revenue. A customer driving $2M at 15% margin contributes more than one driving $3M at 8% margin. Rebate accordingly.
-
Track pocket margin by customer. Move from invoice-level reporting to pocket-level. Flag customers where pocket margin falls below threshold.
The goal isn't to eliminate all discounts. Discounts are a tool. The goal is to see what you're actually giving away and make it intentional.
For a complete framework on analyzing price waterfalls across your business, see our guide to price waterfall analysis.
Last updated: January 28, 2026
Frequently Asked Questions

Want to analyze your entire product catalog?
Pryse automatically identifies margin leakage across thousands of SKUs. Upload your data and find hidden profit in 24 hours.
One-time $1,499 diagnostic. No subscription required.