Price Waterfall Analysis Example: Complete Step-by-Step Walkthrough
Walk through a complete price waterfall analysis for a $60M industrial distributor, from data gathering to actionable insights with real numbers.
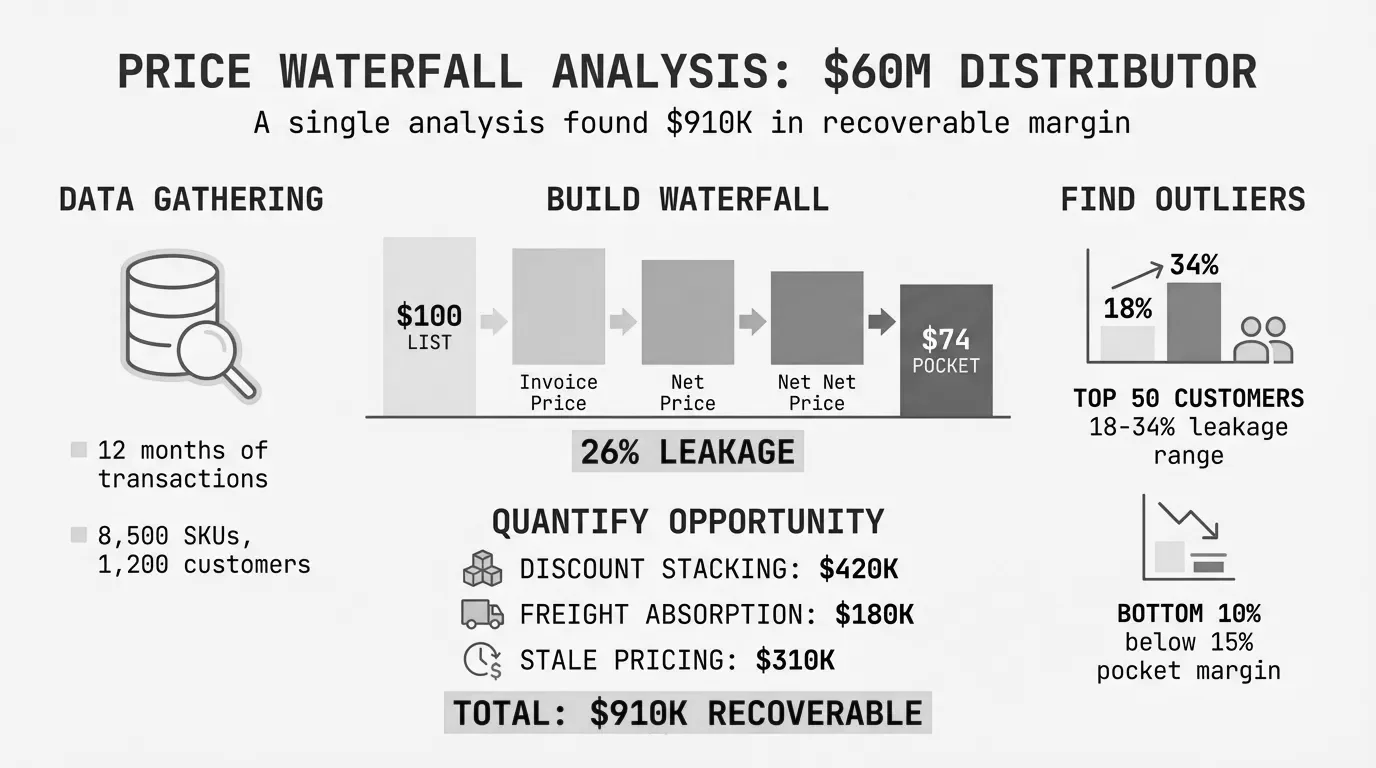
A price waterfall analysis example walks through the complete process of measuring how list price erodes to pocket price through sequential deductions.
This post covers one detailed analysis from start to finish. Not three scenarios showing different waterfalls - that's in our price waterfall examples post. Here we focus on the analysis process itself: what data to gather, how to structure the work, and how to turn waterfall findings into margin recovery.
The company: Midwest Industrial Supply (MIS), a $60M industrial distributor. The analysis: a full price waterfall covering 14,800 SKUs and 340 active customers. The result: $1.2M in identified recoverable margin.
For the underlying methodology, see our complete price waterfall analysis guide.
Setting Up the Analysis
The Company Scenario
MIS distributes fasteners, cutting tools, and abrasives to manufacturing plants across the Midwest. Revenue has held steady at $58-62M for three years. Reported gross margin averages 24.2%. But ownership noticed cash flow didn't match the margin reports.
The controller ran a quick calculation: rebates, freight costs, and payment term expenses totaled roughly $2.4M annually. That's 4% of revenue not captured in the reported gross margin. The actual pocket margin was closer to 20% - if not lower.
Management authorized a full waterfall analysis to find where margin was going.
Data Requirements
Price waterfall analysis requires data from multiple systems. For MIS, we pulled from:
| Data Source | System | Data Needed |
|---|---|---|
| Transaction detail | NetSuite ERP | Invoice prices, list prices, customer codes, product codes, dates |
| Customer pricing | NetSuite | Customer-specific pricing agreements, discount tiers |
| Rebates | AP system | Annual rebates paid by customer, quarterly accruals |
| Freight | Logistics software | Actual shipping cost per order, freight billed to customers |
| Payment terms | AR aging | Days to payment by customer, early payment discounts taken |
| Co-op/MDF | Marketing expense | Marketing development funds paid by customer |
| Returns | Credit memos | Credits issued by customer and reason |
Gathering this data took 11 days. The ERP export was straightforward. Matching freight costs to specific orders required manual work. Rebate allocations came from year-end AP records.
Time Period
We analyzed 12 months of transactions (calendar year 2025). Shorter periods miss seasonal patterns. Longer periods include stale pricing that may have changed.
Total transactions analyzed: 47,200 invoice lines across 14,800 SKUs.
Step 1: Calculate List-to-Invoice Erosion
The first waterfall layer covers on-invoice discounts - deductions that appear on the customer's bill.
Identifying On-Invoice Discounts
MIS had four on-invoice discount types:
Standard trade discount: Every customer received a base discount tied to their pricing tier. Four tiers: Tier A (25% off list), Tier B (20%), Tier C (15%), Tier D (10%).
Volume discount: Additional discount based on order size. Orders over $2,500 received 3% off. Orders over $5,000 received 5% off.
Promotional discount: Quarterly promotions on selected product lines. Averaged 8% on promoted items.
Customer-specific discount: Negotiated pricing for 47 "strategic" accounts. Discounts ranged from 2% to 12% on top of other discounts.
The Calculation
For each transaction, we calculated:
On-Invoice Erosion % = (List Price - Invoice Price) / List Price x 100Aggregated across all transactions:
| Discount Type | Average % of List | Total $ |
|---|---|---|
| Standard trade discount | 18.4% | $15,340,000 |
| Volume discount | 3.8% | $3,166,000 |
| Promotional discount | 2.1% | $1,750,000 |
| Customer-specific discount | 4.2% | $3,500,000 |
| Total on-invoice | 28.5% | $23,756,000 |
Starting from $83.4M in list-price revenue, MIS collected $59.6M at the invoice level.
What This Step Revealed
The customer-specific discounts caught management off guard. They expected 1-2% in negotiated pricing. The actual 4.2% meant strategic account pricing was more aggressive than anyone realized.
Forty-seven accounts had special pricing. Twenty-three of those accounts hadn't increased their purchase volume in two years. The discounts persisted while the relationship value declined.
Step 2: Identify Off-Invoice Deductions
Off-invoice deductions don't appear on customer invoices. They hit different departments: AP (rebates), logistics (freight), AR (payment terms), marketing (co-op funds). Nobody sees the total unless you bring the data together.
Rebate Programs
MIS ran two rebate programs:
Annual volume rebate: Customers earning over $50,000 annually received 2% back. Over $100,000 earned 3%.
Growth rebate: Customers growing 15%+ year-over-year received an additional 1.5% rebate.
We pulled rebate payments from AP for the year. Allocated them back to customer accounts based on their annual purchases.
| Rebate Type | Customers | Total Paid | % of Invoice Revenue |
|---|---|---|---|
| Annual volume | 87 | $892,000 | 1.5% |
| Growth rebate | 34 | $312,000 | 0.5% |
| Total rebates | $1,204,000 | 2.0% |
Freight Absorption
MIS offered "free shipping" on orders over $500. Below that threshold, customers paid actual freight. But actual freight exceeded billed freight significantly - even on supposedly paid orders.
We compared shipping costs (from the logistics system) to freight billed (from invoices) for every order:
| Order Category | Orders | Freight Cost | Freight Billed | Absorption |
|---|---|---|---|---|
| Under $500 | 8,400 | $378,000 | $312,000 | $66,000 |
| $500-$1,000 | 11,200 | $448,000 | $0 | $448,000 |
| Over $1,000 | 14,100 | $634,000 | $0 | $634,000 |
| Total | 33,700 | $1,460,000 | $312,000 | $1,148,000 |
Freight absorption equaled 1.9% of invoice revenue. The "free shipping over $500" policy sounded reasonable but cost nearly $1.15M annually.
Payment Terms Cost
MIS offered 2% / 10 net 30 terms. Customers paying within 10 days earned a 2% discount.
We also calculated the carrying cost for customers paying beyond terms. MIS's cost of capital was approximately 8% annually.
From AR aging:
| Payment Behavior | Customers | Annual Revenue | Cost |
|---|---|---|---|
| Took early payment discount | 189 | $31.2M | $624,000 |
| Paid within terms (11-30 days) | 98 | $18.4M | $0 |
| Paid late (31-60 days) | 41 | $8.1M | $108,000 |
| Paid very late (60+ days) | 12 | $1.9M | $63,000 |
| Total | $59.6M | $795,000 |
Payment terms cost 1.3% of invoice revenue between early pay discounts taken and late payment carrying costs.
Co-op Advertising and Other Allowances
MIS provided marketing development funds (MDF) to 23 accounts for local advertising, trade show participation, and catalog placement. Total MDF spend: $287,000 (0.5% of invoice revenue).
Returns processing and credits averaged $183,000 annually (0.3%).
Total Off-Invoice Deductions
| Off-Invoice Component | Amount | % of Invoice Revenue |
|---|---|---|
| Rebates | $1,204,000 | 2.0% |
| Freight absorption | $1,148,000 | 1.9% |
| Payment terms | $795,000 | 1.3% |
| Co-op/MDF | $287,000 | 0.5% |
| Returns/credits | $183,000 | 0.3% |
| Total off-invoice | $3,617,000 | 6.1% |
Step 3: Calculate Pocket Price and Pocket Margin
With all deductions identified, we calculated true pocket price.
Pocket Price = Invoice Revenue - Off-Invoice Deductions
Pocket Price = $59,644,000 - $3,617,000 = $56,027,000
The waterfall summary:
| Waterfall Step | Amount | % of List |
|---|---|---|
| List Price Revenue | $83,400,000 | 100.0% |
| Less: On-invoice discounts | -$23,756,000 | -28.5% |
| Invoice Price Revenue | $59,644,000 | 71.5% |
| Less: Off-invoice deductions | -$3,617,000 | -4.3% |
| Pocket Price Revenue | $56,027,000 | 67.2% |
Total erosion: 32.8% from list to pocket.
For margin calculation, MIS's COGS totaled $43.8M:
Pocket Margin = (Pocket Price - COGS) / Pocket Price x 100
Pocket Margin = ($56,027,000 - $43,800,000) / $56,027,000 x 100 = 21.8%
Compare this to the reported gross margin:
Invoice Gross Margin = ($59,644,000 - $43,800,000) / $59,644,000 x 100 = 26.6%
The 4.8 percentage point gap between reported margin (26.6%) and pocket margin (21.8%) represented the off-invoice erosion that wasn't being measured.
Step 4: Segment by Customer
Average waterfall numbers hide the real story. MIS's 340 customers had vastly different waterfalls.
Building Customer-Level Waterfalls
We calculated pocket margin for each customer by allocating:
- On-invoice discounts (direct from transactions)
- Rebates (from AP by customer)
- Freight (from logistics by customer)
- Payment terms (from AR by customer)
- Co-op/MDF (from marketing by customer)
The Pocket Price Band
MIS's pocket margins ranged from -3.2% to 34.8%. That's a 38-point spread among customers supposedly buying similar products at similar pricing.
| Pocket Margin Range | Customers | Revenue | Avg Pocket Margin |
|---|---|---|---|
| Over 30% | 28 | $4.2M | 32.1% |
| 25-30% | 67 | $11.8M | 27.4% |
| 20-25% | 112 | $24.1M | 22.3% |
| 15-20% | 89 | $14.2M | 17.8% |
| 10-15% | 32 | $4.8M | 12.4% |
| Under 10% | 12 | $1.5M | 4.2% |
The 44 customers earning under 15% pocket margin contributed only $6.3M in revenue but consumed disproportionate resources. These accounts required attention.
Top 20 Customer Analysis
MIS's top 20 customers represented $28.4M in invoice revenue (47.6% of total). Their waterfalls varied significantly:
| Customer | Invoice Revenue | Pocket Margin | Issue Identified |
|---|---|---|---|
| Acme Manufacturing | $3.1M | 24.3% | None - healthy account |
| Central Fabrication | $2.8M | 18.2% | Excessive freight absorption |
| Midwest Metals | $2.4M | 14.7% | All discounts stacked plus growth rebate |
| Johnson Products | $2.2M | 22.8% | None - healthy account |
| ... | ... | ... | ... |
| Precision Tool Co | $0.9M | 8.4% | Strategic pricing from 2021 never updated |
Eight of the top 20 customers had pocket margins below 20%. Combined, they represented $9.7M in revenue that needed pricing adjustment.
Step 5: Identify the Top 3 Leakage Sources
With the complete waterfall built, we ranked leakage sources by recoverable opportunity.
Leakage Source 1: Freight Absorption on Small Orders
Finding: Orders between $500-$1,000 had identical freight costs to orders over $1,000, but no economies of scale for MIS. The $500 threshold was set in 2018 when average order value was $420. Average order value had since grown to $580 - meaning most orders qualified for free freight.
Dollar impact: $448,000 annually on $500-$1,000 orders alone.
Root cause: Policy never updated as business mix changed.
Leakage Source 2: Customer-Specific Pricing Without Review
Finding: 23 customers had negotiated pricing from deals closed 3+ years ago. Their volume commitments hadn't been met, but pricing persisted. Average discount: 6.8% on top of tier pricing. Average pocket margin: 14.2% versus 21.8% company average.
Dollar impact: These 23 customers generated $8.4M in revenue at 7.6 points below average margin. That's $638,000 in margin erosion.
Root cause: No systematic review of customer-specific pricing.
Leakage Source 3: Rebate Program Overlap
Finding: The annual volume rebate and growth rebate often went to the same customers. Thirty-four customers qualified for both, receiving 3.5-4.5% in combined rebates. The growth rebate was intended for newer accounts growing business. Instead, established accounts qualified by simply maintaining volume against a low base year.
Dollar impact: $312,000 in growth rebates went to customers already receiving full volume rebates.
Root cause: Programs designed independently without overlap analysis.
Step 6: Quantify the Dollar Opportunity
Not all leakage is recoverable. Some discounts exist for competitive reasons. Some freight absorption maintains customer relationships. The goal was to identify addressable opportunity without damaging the business.
Recoverable Margin Summary
| Leakage Source | Total Leakage | Recoverable % | Recoverable $ |
|---|---|---|---|
| Freight policy adjustment | $1,148,000 | 40% | $459,000 |
| Customer pricing review | $638,000 | 70% | $447,000 |
| Rebate program restructure | $312,000 | 80% | $250,000 |
| Payment terms enforcement | $171,000 | 50% | $86,000 |
| Total | $2,269,000 | 55% | $1,242,000 |
The 55% recovery rate reflected realistic expectations. We assumed:
- Freight: Some absorption necessary for large accounts
- Customer pricing: A few deals have competitive justification
- Rebates: Growth program serves a purpose, just needs better targeting
- Payment terms: Some customers will push back on enforcement
Total recoverable margin: $1.24M annually, or 2.1% of invoice revenue.
Step 7: Recommended Actions
Based on the analysis, we recommended six specific actions with timelines.
Immediate (30 Days)
Action 1: Raise free freight threshold to $750.
The $500 threshold predated current order patterns. At $750, roughly 60% of orders would still qualify for free freight, but the company would recover approximately $200,000 annually on smaller orders.
Action 2: Implement pocket price floor.
Set a minimum pocket margin of 15% for any transaction. Orders falling below require manager approval. This stops future erosion while other fixes take hold.
Short-Term (90 Days)
Action 3: Audit 23 legacy pricing agreements.
Review each customer-specific deal. For accounts below committed volume, reset pricing to standard tier. For accounts meeting commitments, extend agreements with current terms.
Expected outcome: Eight accounts reset to standard pricing (recovering ~$320,000). Fifteen accounts continue with adjusted terms.
Action 4: Restructure rebate programs.
Eliminate growth rebate overlap. Customers receiving volume rebate cannot also receive growth rebate in the same year. Growth rebate reserved for accounts under $50,000 annual volume that demonstrate 20%+ growth.
Expected outcome: 34 accounts no longer qualify for double rebates (recovering ~$250,000).
Long-Term (12 Months)
Action 5: Implement annual pricing review.
Every customer-specific price agreement expires after 12 months. Renewal requires volume verification. No grandfather clauses.
Action 6: Add pocket margin to sales dashboards.
Sales reps see invoice margin daily. They don't see freight, rebate, or payment term impacts. Adding pocket margin visibility changes behavior.
Results After Implementation
MIS implemented all six recommendations over the following 14 months. Results:
Financial Impact
| Metric | Before Analysis | After 14 Months | Change |
|---|---|---|---|
| Invoice revenue | $59.6M | $58.2M | -2.4% |
| Pocket revenue | $56.0M | $56.8M | +1.4% |
| Pocket margin % | 21.8% | 24.1% | +2.3 pts |
| Pocket margin $ | $12.2M | $13.7M | +$1.5M |
Revenue declined slightly as some price-sensitive accounts reduced purchases. Pocket margin dollars increased $1.5M - exceeding the $1.24M projection.
Specific Outcomes
Freight policy: $750 threshold saved $187,000 in year one. Three accounts moved more orders above threshold to avoid charges.
Customer pricing review: Six accounts left over pricing changes (combined revenue: $1.4M, combined pocket margin: 9.2%). Those accounts contributed less than $130,000 in annual margin. Remaining accounts adjusted, recovering $410,000.
Rebate restructure: Growth rebate spend dropped from $312,000 to $89,000. The remaining spend went to genuinely growing accounts.
Payment terms: Late payment fees generated $43,000. More importantly, average DSO dropped from 34 days to 28 days, improving cash flow.
Ongoing Monitoring
MIS now runs waterfall analysis quarterly. The controller tracks:
- Total erosion percentage (target: under 32%)
- Pocket margin by customer tier
- Freight absorption ratio
- Rebate spend as percentage of revenue
Any metric moving 1+ points triggers review.
Key Lessons From This Analysis
Data access determines timeline
The 11 days spent gathering data was longer than the 8 days spent analyzing it. Companies with integrated systems complete analysis faster. Those relying on spreadsheets from multiple departments should budget extra time.
Off-invoice costs hide in plain sight
MIS's controller knew rebates, freight, and payment terms cost money. But the costs sat in different budgets, managed by different people. Waterfall analysis made the combined $3.6M visible in one view.
Average numbers hide problems
Company-wide pocket margin was 21.8% - decent for distribution. But 44 customers fell below 15%. Without segmentation, those accounts hide in the average.
Not all leakage should be eliminated
Some freight absorption maintains customer relationships. Some discounts exist for competitive reasons. The goal isn't zero leakage - it's informed leakage. Know what you're giving away and why.
Recovery takes time
Changing freight policy took two weeks. Renegotiating customer pricing took six months. Restructuring rebates took a full fiscal year. Build realistic timelines into any margin recovery plan.
Price waterfall analysis isn't complicated, but it requires discipline. Gather the data, build the waterfall, segment by customer, identify leakage sources, and take action. Companies that do this work find margin hiding in deductions they weren't measuring.
For the complete methodology, see our price waterfall analysis guide. For additional waterfall scenarios, see price waterfall examples.
Last updated: January 28, 2026
Frequently Asked Questions

Want to analyze your entire product catalog?
Pryse automatically identifies margin leakage across thousands of SKUs. Upload your data and find hidden profit in 24 hours.
One-time $1,499 diagnostic. No subscription required.