Price Waterfall Examples: 3 Real Scenarios Analyzed
See how margin erodes from list price to pocket price with three detailed price waterfall examples from manufacturing and distribution companies.
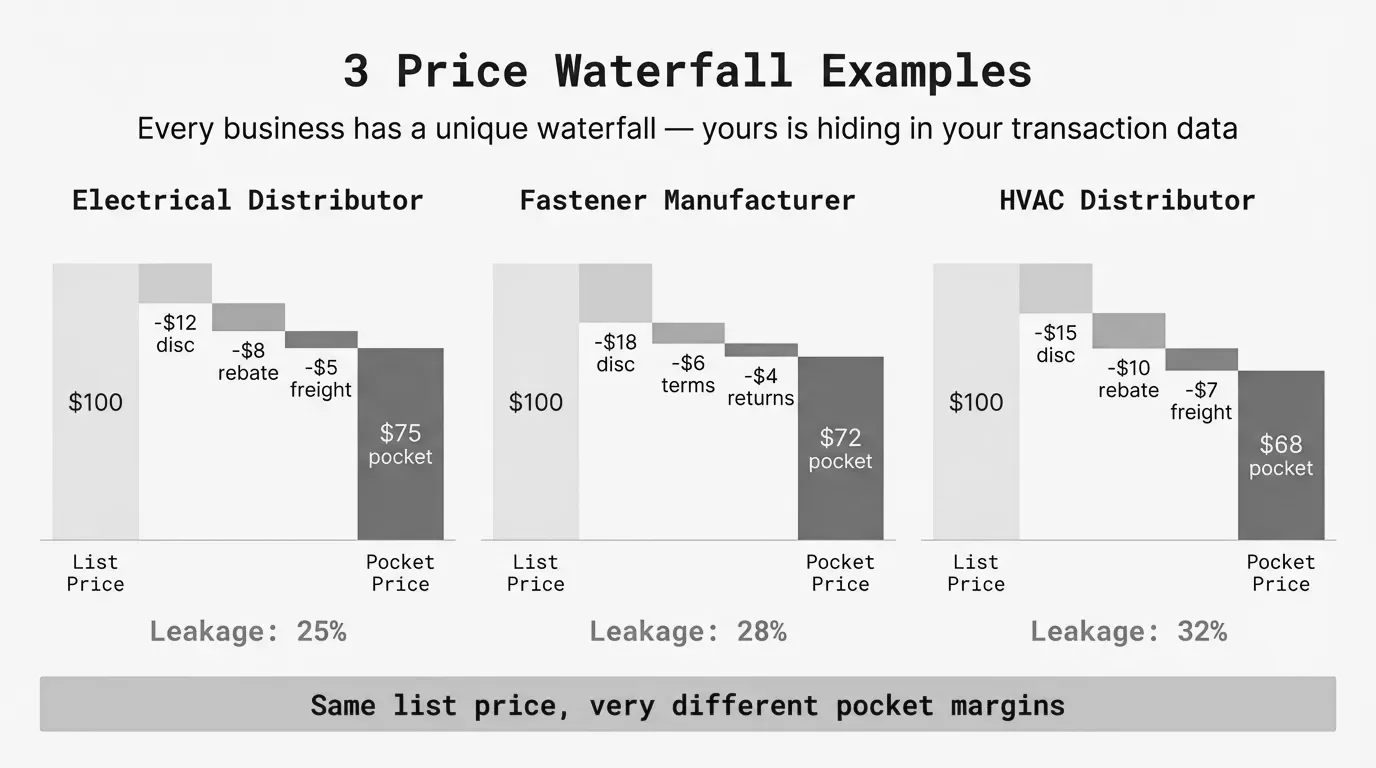
A price waterfall example is a step-by-step breakdown showing how a company's list price decreases through discounts, rebates, and costs until reaching the actual amount collected, known as pocket price. Each step in the waterfall represents money leaving the transaction.
McKinsey research found that companies analyzing their price waterfall discover pocket prices averaging 32-50% below list price. A global lighting supplier case study showed invoice prices 32.8% below list, with additional off-invoice costs dropping the pocket price to just 50% of the original list price.
The numbers matter because small leaks compound. According to McKinsey, off-invoice leakages alone average 16.3% of list price across companies they studied. Most businesses don't track these costs because they hit accounts payable, logistics, or finance rather than the sales organization.
Below are three detailed price waterfall examples from real company scenarios. Each shows the exact erosion at every step, the patterns that caused margin leakage, and what the analysis revealed.
For the complete methodology behind building and analyzing price waterfalls, see our price waterfall analysis guide.
Example 1: Manufacturing Company ($65M Revenue, Industrial Products)
Company profile: Industrial components manufacturer, $65M annual revenue, sells to distributors and OEMs, 2,800 SKUs
This manufacturer tracked margins at the invoice level and reported a healthy 28% gross margin. When they built their first complete price waterfall, they found pocket margin was actually 19.4%—a gap of 8.6 percentage points they hadn't measured.
The Complete Waterfall
Here is the waterfall for their average transaction over a 12-month period:
| Waterfall Step | Dollar Amount | % of List | Cumulative Erosion |
|---|---|---|---|
| List Price | $1,000.00 | 100.0% | — |
| Standard Distributor Discount | -$180.00 | -18.0% | 18.0% |
| Volume Tier Discount | -$49.20 | -4.9% | 22.9% |
| Invoice Price | $770.80 | 77.1% | 22.9% |
| Annual Volume Rebate | -$30.83 | -3.1% | 26.0% |
| Cash Discount (2% / Net 10) | -$14.80 | -1.5% | 27.5% |
| Cooperative Advertising | -$23.12 | -2.3% | 29.8% |
| Freight Allowance | -$38.54 | -3.9% | 33.7% |
| Warranty/Returns Reserve | -$19.27 | -1.9% | 35.6% |
| Pocket Price | $644.24 | 64.4% | 35.6% |
The Calculation
The manufacturer calculated pocket margin using:
Pocket Margin = (Pocket Price - Product Cost) / List PriceWith an average product cost of $450 per $1,000 list price:
Pocket Margin = ($644.24 - $450) / $1,000 = 19.4%Compare this to their reported invoice-based gross margin:
Invoice Gross Margin = ($770.80 - $450) / $770.80 = 41.6%The 41.6% invoice margin looked strong. The 19.4% pocket margin told the real story.
What the Analysis Revealed
Hidden freight costs. The company offered "free freight" on orders over $2,500. Sales counted this as a customer benefit, not a discount. Finance recorded it as a logistics expense. Neither team tracked it as margin erosion. At 3.9% of list price, freight was their third-largest waterfall component.
Stacked rebates. The annual volume rebate (3.1%) applied on top of all invoice discounts. A distributor receiving 23% off invoice also received 3.1% back at year end, calculated on total purchases. The rebate percentage had been set years earlier and never reviewed against current discount levels.
Cash discount uptake. The 2% / Net 10 payment term was designed to improve cash flow. In practice, 74% of customers took the discount. What was positioned as an option had become a standard 1.5% price reduction.
The Dollar Impact
On $65M in revenue:
| Measure | Amount |
|---|---|
| Revenue at Invoice Price | $65,000,000 |
| Expected Gross Profit (28% margin) | $18,200,000 |
| Actual Pocket Gross Profit (19.4% margin) | $12,610,000 |
| Untracked Margin Leakage | $5,590,000 |
The manufacturer was losing $5.59M annually to costs they didn't measure against pricing.
Example 2: Wholesale Distributor ($40M Revenue, Electrical Supplies)
Company profile: Regional electrical supply distributor, $40M annual revenue, 180 contractor accounts, 12,000 SKUs
This distributor had a different waterfall structure than the manufacturer. Fewer rebate programs, but aggressive customer-specific pricing and significant off-invoice costs tied to job site delivery.
The Complete Waterfall
| Waterfall Step | Dollar Amount | % of List | Cumulative Erosion |
|---|---|---|---|
| List Price | $1,000.00 | 100.0% | — |
| Standard Contractor Discount | -$220.00 | -22.0% | 22.0% |
| Customer-Specific Discount | -$62.40 | -6.2% | 28.2% |
| Promotional Discount | -$21.54 | -2.2% | 30.4% |
| Invoice Price | $696.06 | 69.6% | 30.4% |
| Early Payment Discount | -$10.44 | -1.0% | 31.4% |
| Job Site Delivery | -$48.72 | -4.9% | 36.3% |
| Rush Order Handling | -$13.92 | -1.4% | 37.7% |
| Returns Processing | -$20.88 | -2.1% | 39.8% |
| AR Carrying Cost | -$17.40 | -1.7% | 41.5% |
| Pocket Price | $584.70 | 58.5% | 41.5% |
The Calculation
The distributor's average COGS was $520 per $1,000 list price. Their pocket margin:
Pocket Margin = ($584.70 - $520) / $1,000 = 6.5%At the invoice level:
Invoice Gross Margin = ($696.06 - $520) / $696.06 = 25.3%The 25.3% invoice margin was within industry benchmarks. The 6.5% pocket margin was barely covering operating expenses.
What the Analysis Revealed
Customer-specific discounts without criteria. The 6.2% average customer-specific discount had no documentation. Sales reps had authority to offer up to 10% additional discount. Discounts were rarely removed even when account volume declined. One contractor receiving an 8% special discount was the company's 47th largest account by volume.
Job site delivery as a hidden subsidy. Contractor customers expected job site delivery. The distributor absorbed this cost, averaging $48.72 per $1,000 in product. Delivery was provided regardless of order size. A $400 order with $19.50 in delivery cost had an effective 4.9% additional discount before any other factors.
AR carrying cost from slow payers. Average days sales outstanding (DSO) was 52 days against 30-day terms. The company charged no late fees. The 1.7% AR carrying cost represented the cost of capital tied up in receivables beyond terms.
The Contrast With Example 1
| Metric | Manufacturer | Distributor |
|---|---|---|
| List to Invoice Erosion | 22.9% | 30.4% |
| Invoice to Pocket Erosion | 12.7% | 11.1% |
| Total Erosion | 35.6% | 41.5% |
| Pocket Margin | 19.4% | 6.5% |
The distributor's on-invoice discounting was significantly higher (30.4% vs 22.9%), while off-invoice costs were similar. The thinner starting margin in distribution (25.3% invoice vs 41.6% for manufacturing) meant less room to absorb leakage. The same percentage erosion had a more devastating effect on pocket profitability.
Example 3: Distribution Company With Problematic Waterfall ($55M Revenue)
Company profile: HVAC parts distributor, $55M annual revenue, facing margin pressure after private equity acquisition
This company represents what happens when discounting compounds over years without systematic review. New ownership discovered the waterfall during due diligence. The findings prompted a complete pricing restructure.
The Complete Waterfall
| Waterfall Step | Dollar Amount | % of List | Cumulative Erosion |
|---|---|---|---|
| List Price | $1,000.00 | 100.0% | — |
| Standard Distributor Discount | -$250.00 | -25.0% | 25.0% |
| Strategic Account Discount | -$75.00 | -7.5% | 32.5% |
| Project Bid Discount | -$60.75 | -6.1% | 38.6% |
| Promotional/Seasonal Discount | -$36.85 | -3.7% | 42.3% |
| Invoice Price | $577.40 | 57.7% | 42.3% |
| Annual Rebate Program | -$34.64 | -3.5% | 45.8% |
| Quarterly Bonus Rebate | -$17.32 | -1.7% | 47.5% |
| Cash Discount (2% / Net 15) | -$10.52 | -1.1% | 48.6% |
| Freight Prepaid | -$28.87 | -2.9% | 51.5% |
| Technical Support Allocation | -$11.55 | -1.2% | 52.7% |
| Returns/Defectives | -$17.32 | -1.7% | 54.4% |
| Co-op Advertising | -$23.10 | -2.3% | 56.7% |
| Pocket Price | $433.26 | 43.3% | 56.7% |
The Calculation
With COGS of $480 per $1,000 list:
Pocket Margin = ($433.26 - $480) / $1,000 = -4.7%This company had a negative pocket margin on average transactions. They were losing $46.74 on every $1,000 in list-price product sold.
How did they stay in business? Two factors:
-
Product mix variation. Some product categories had lower COGS percentages. The average masked significant category-level differences.
-
Supplier rebates. The company received volume rebates from suppliers that partially offset customer-facing discounts. These weren't captured in the customer waterfall.
The Root Causes
Discount archaeology. The strategic account discount (7.5%) dated to 2018. The project bid discount (6.1%) was added in 2020. The promotional discount (3.7%) became permanent in 2021. Each discount was added without removing predecessors. A customer could qualify for all four on-invoice discounts simultaneously.
Rebate program overlap. The annual rebate (3.5%) and quarterly bonus rebate (1.7%) targeted similar behaviors. The quarterly program was added to match a competitor's offer without adjusting the annual program. Combined, rebates equaled 5.2% of list—higher than the industry average of 3%.
Cost allocation gaps. Technical support costs ($11.55 per $1,000) were carried as overhead, not allocated to transactions. When a contractor called with installation questions, that cost never appeared against the sale. Moving this to the waterfall revealed its impact on profitability.
The Recovery Plan
The new ownership implemented a phased recovery over 18 months:
Phase 1 (Months 1-6): Eliminated discount stacking. Customers could qualify for one on-invoice discount tier, not multiple. Average on-invoice erosion dropped from 42.3% to 31%.
Phase 2 (Months 7-12): Restructured rebate programs. Replaced the dual annual/quarterly structure with a single volume-based rebate capped at 3%. Savings: 2.2 percentage points.
Phase 3 (Months 13-18): Introduced minimum order quantities for prepaid freight. Orders under $1,500 carried a $75 delivery fee. Freight cost dropped from 2.9% to 1.8% of list.
Result after 18 months:
| Metric | Before | After | Change |
|---|---|---|---|
| Total Waterfall Erosion | 56.7% | 39.2% | -17.5 pts |
| Pocket Price | $433.26 | $608.00 | +$174.74 |
| Pocket Margin | -4.7% | 12.8% | +17.5 pts |
Revenue declined 12% as some price-sensitive accounts left. Gross profit dollars increased 34% despite lower volume.
Key Patterns Across All Three Examples
On-Invoice vs Off-Invoice Balance
| Company | On-Invoice Erosion | Off-Invoice Erosion | Total |
|---|---|---|---|
| Manufacturer | 22.9% | 12.7% | 35.6% |
| Electrical Distributor | 30.4% | 11.1% | 41.5% |
| HVAC Distributor | 42.3% | 14.4% | 56.7% |
Off-invoice costs clustered in a tight range (11-14%) across all three companies. On-invoice discounting varied dramatically (23-42%). The companies with margin problems had on-invoice discount issues, not unusual off-invoice costs.
Common Waterfall Components
Every waterfall included:
- Standard trade discount (largest single component)
- At least one volume-based element (tier discount or rebate)
- Payment-related discount (cash discount or early payment)
- Logistics cost (freight, delivery)
- Returns/warranty reserve
The difference between healthy and unhealthy waterfalls wasn't the presence of these components. It was whether each component had a business justification and was actively managed.
The Measurement Gap
None of these companies tracked pocket margin before conducting waterfall analysis. All three measured gross margin at the invoice level. The gap between invoice margin and pocket margin ranged from 8.6 to over 18 percentage points.
According to Bain & Company's pricing research, companies that regularly analyze pricing waterfalls identify 3-8% more margin opportunity than those who don't. The examples above found 8.6%, 18.8%, and 17.5% margin recovery opportunities respectively.
How to Interpret Your Own Waterfall
Start by building a complete waterfall for your average transaction over the past 12 months. Include every discount, rebate, allowance, and cost that reduces what you actually collect.
Benchmark your total erosion:
- Under 30%: Well-managed pricing
- 30-40%: Normal for B2B distribution
- 40-50%: Review needed
- Over 50%: Urgent restructuring required
Look for these warning signs:
- More than three on-invoice discount tiers
- Rebate programs that overlap in purpose
- Any single component exceeding 10% of list
- Off-invoice costs exceeding 15% of list
- Freight or delivery costs you can't assign to specific orders
Calculate your pocket margin:
Pocket Margin = (Pocket Price - COGS) / Pocket PriceIf pocket margin falls below 10% for distribution or 15% for manufacturing, you have structural pricing issues that require attention beyond marginal adjustments.
The examples above show that waterfall problems don't fix themselves. Each year of inattention adds another discount layer or allows another off-invoice cost to grow. Companies that build and maintain waterfall visibility recover margin. Companies that don't watch it erode.
Last updated: January 28, 2026
Frequently Asked Questions

Want to analyze your entire product catalog?
Pryse automatically identifies margin leakage across thousands of SKUs. Upload your data and find hidden profit in 24 hours.
One-time $1,499 diagnostic. No subscription required.