Price Waterfall Template: Structure Your Margin Analysis
Build a price waterfall template that tracks every deduction from list price to pocket price. Includes field structure, industry variations, and common mistakes.
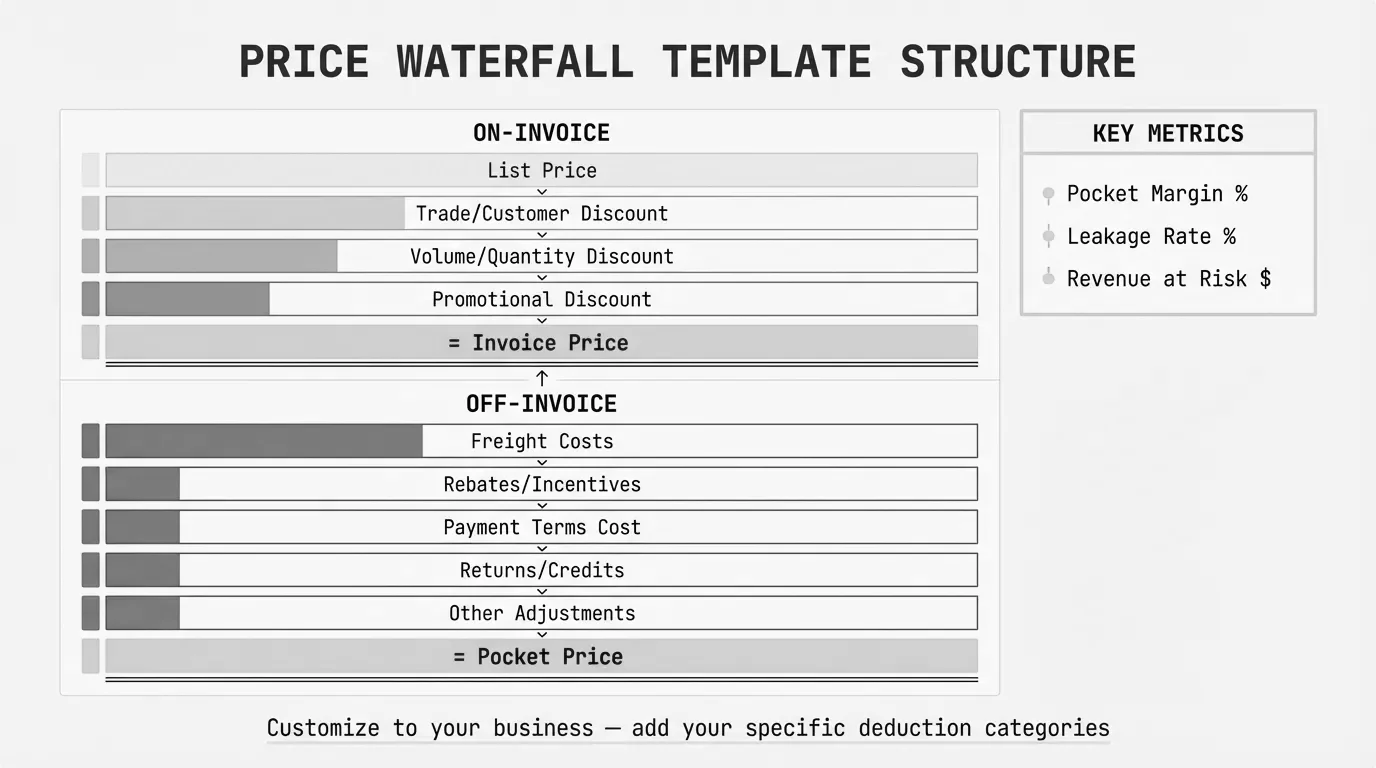
A price waterfall template tracks every deduction between your list price and what you actually keep. List price sits at the top. On-invoice discounts pull it down. Off-invoice costs like rebates, freight, and payment terms pull it down further. The final number is your pocket price.
Without this structure, you see the invoice. With it, you see reality.
A McKinsey study of a lighting supplier found that invoice price averaged 32.8% below list price. Then off-invoice deductions (cash discounts, freight, rebates) dropped the pocket price to half of list. The company thought they were discounting 33%. They were actually giving away 50%.
This post covers what a price waterfall template needs, the standard components from list to pocket, how to adapt it for distribution vs. manufacturing, and the mistakes that undermine the analysis.
What a Price Waterfall Template Needs
A price waterfall template has three sections: on-invoice deductions, off-invoice deductions, and calculated fields. Each section answers a different question about where your margin goes.
Template Structure Overview
| Section | Purpose | Example Components |
|---|---|---|
| Starting Point | Base price before deductions | List Price |
| On-Invoice Deductions | Discounts visible on the invoice | Volume, competitive, promotional discounts |
| Off-Invoice Deductions | Costs not shown on invoice | Rebates, freight, payment terms, co-op advertising |
| Calculated Fields | True profitability metrics | Pocket Price, Pocket Margin %, Leakage % |
The template should work at the transaction level. Aggregate waterfalls hide variance. A customer might look profitable in total while losing money on half their orders.
Standard Waterfall Components: List Price to Pocket Price
Here are the components most distribution and manufacturing companies need, in the order they flow through the waterfall.
Starting Point
| Field | Description | Calculation |
|---|---|---|
| List Price | Published price before any deductions | Base reference point |
List price is your starting point. Some companies call it base price, sticker price, or MSRP. Whatever you call it, this number should be consistent across your analysis. If you have multiple price lists, pick one as the reference.
On-Invoice Deductions
| Field | Description | Typical Range |
|---|---|---|
| Volume Discount | Discount based on quantity purchased | 3-15% |
| Competitive Discount | Adjustment to match market pricing | 5-20% |
| Promotional Discount | Time-limited promotional pricing | 5-25% |
| Contract Discount | Negotiated customer-specific pricing | 10-30% |
| = Invoice Price | List Price minus on-invoice deductions | Calculated |
On-invoice deductions appear on the customer invoice. They are visible, tracked, and usually approved through a defined process. Most companies manage these reasonably well.
Off-Invoice Deductions
| Field | Description | Typical Range |
|---|---|---|
| Volume Rebates | Annual rebates based on total purchases | 1-5% |
| Performance Rebates | Rebates tied to growth or targets | 1-3% |
| Freight/Shipping | Cost of delivery absorbed by seller | 2-8% |
| Co-op Advertising | Marketing allowances to customers | 1-4% |
| Early Payment Discount | Discount for paying before terms | 1-2% |
| Carrying Cost | Cost of financing receivables | 0.5-2% |
| Returns/Allowances | Credits for defects or damaged goods | 0.5-3% |
| = Pocket Price | Invoice Price minus off-invoice deductions | Calculated |
Off-invoice deductions are where margin leaks. They do not appear on the invoice. They live in different systems: rebates in AP, freight in logistics, payment terms in AR. Without a waterfall template pulling them together, no one sees the full picture.
Calculated Fields
| Field | Formula | What It Shows |
|---|---|---|
| Total Discount % | (List Price - Invoice Price) / List Price x 100 | On-invoice leakage |
| Total Leakage % | (List Price - Pocket Price) / List Price x 100 | All-in leakage |
| Pocket Margin % | (Pocket Price - COGS) / Pocket Price x 100 | True transaction profit |
| Pocket Margin $ | Pocket Price - COGS | Dollar profit per unit/transaction |
The pocket margin percentage is the number that matters. Invoice margin overstates profitability by ignoring off-invoice costs. Pocket margin shows what you actually earn.
Template Structure by Industry
Distribution and manufacturing companies have different cost structures. Your template should reflect your actual deductions, not a generic list.
Distribution Waterfall Template
Distributors typically have more customer-facing deductions and fewer production-related costs.
| Component | Distribution-Specific Notes |
|---|---|
| List Price | Often MSRP or manufacturer suggested price |
| Volume Discount | Tiered by annual purchase volume |
| Competitive Discount | Market-driven, varies by product category |
| Invoice Price | |
| Distributor Rebate | Paid by manufacturer to distributor |
| Customer Rebate | Paid by distributor to customer |
| Freight Absorption | Common for large accounts or distant locations |
| Payment Terms | 2/10 net 30 costs ~36% annualized |
| Returns | Higher in categories with obsolescence |
| Pocket Price |
Distribution waterfalls often reveal that freight absorption is the largest off-invoice cost. A "free shipping over $500" policy might cost 5-8% of revenue on qualifying orders.
Manufacturing Waterfall Template
Manufacturers often have more complex rebate structures and production-related costs to track.
| Component | Manufacturing-Specific Notes |
|---|---|
| List Price | Internally set based on cost-plus or market |
| OEM Discount | Pricing for original equipment manufacturers |
| Channel Discount | Different pricing by distribution channel |
| Invoice Price | |
| Volume Rebate | Often tied to annual purchase commitments |
| Marketing Development Funds | Support for channel marketing |
| Warranty Allowance | Reserve for warranty claims |
| Tooling/Setup Recovery | Amortized customer-specific tooling |
| Freight | Inbound and outbound logistics |
| Pocket Price |
For manufacturers selling through distribution, the waterfall gets more complex. You might track both Distributor Net Price (DNP) and Customer Net Price (CNP) to understand margin at each level.
Common Mistakes in Waterfall Templates
Stopping at Invoice Price
The most common mistake. Invoice price looks good. Pocket price tells the truth. If your template stops at invoice price, you are missing the deductions that matter most.
A McKinsey study showed pocket price can be half of list price once off-invoice deductions are included. Your invoice might show 25% discount. Your actual position might be 40% or more.
Missing Off-Invoice Components
Off-invoice costs hide in different systems. Freight sits in logistics. Rebates sit in accounts payable. Payment terms sit in AR. If you do not actively pull these into your template, they stay invisible.
Common items that get missed:
- Cost of carrying receivables (financing cost of A/R)
- Customer-specific handling or packaging
- Consignment inventory costs
- Sample and demo unit costs
- Sales compensation directly tied to the account
Using Averages Instead of Transaction Data
A customer averaging 28% pocket margin might have orders ranging from 35% to 15%. The average hides the variance. Your template should work at the transaction level so you can see which orders make money and which ones do not.
No Customer or Product Segmentation
Company-wide waterfall analysis shows trends but not causes. Segment by customer to find who gets the deepest discounts. Segment by product to find where margin concentrates or leaks. The template structure should support both views.
Static Annual Analysis
Running the waterfall once per year shows what happened, not what is happening. Monthly or quarterly updates catch drift before it compounds. That 1% increase in freight costs in Q1 becomes 4% annualized if you do not catch it until year-end.
Customizing for Your Business
Start with the standard components, then add what matters for your situation.
Questions to Guide Customization
-
What deductions do we offer customers? List every discount, rebate, and allowance program.
-
What costs do we absorb? Freight, handling, returns, financing, samples?
-
Where does this data live? ERP, CRM, separate rebate systems, spreadsheets?
-
At what level do we need analysis? Transaction, customer, product, channel, region?
-
What decisions will this inform? Pricing changes, customer negotiations, program restructuring?
Your template should include every deduction that exceeds 0.5% of revenue. Smaller items can be grouped into an "other deductions" bucket.
Data Sources by Component
| Component | Typical Data Source |
|---|---|
| List Price | Price master / ERP |
| Invoice Discounts | Invoice detail / ERP |
| Rebates | AP system or rebate management software |
| Freight | TMS or logistics system |
| Payment Terms | AR aging / ERP |
| Returns | Returns module / ERP |
Pulling data from multiple systems into one template takes work. But that work reveals margin leakage that stays hidden when each system lives in isolation.
From Template to Action
A price waterfall template does three things:
- Shows true profitability by transaction, customer, and product
- Identifies leakage sources by quantifying each deduction
- Prioritizes improvement opportunities by showing where the dollars are
The template is a diagnostic tool. It shows you where margin goes. What you do with that information, adjusting discount policies, renegotiating freight terms, restructuring rebate programs, turns diagnosis into dollars.
For companies managing thousands of transactions, building and maintaining a waterfall template in Excel takes significant time. Pryse automates this analysis, connecting to your transaction data and surfacing margin leakage without the manual spreadsheet work.
For more on waterfall analysis methodology, see our price waterfall analysis guide.
Last updated: January 28, 2026
Frequently Asked Questions

Want to analyze your entire product catalog?
Pryse automatically identifies margin leakage across thousands of SKUs. Upload your data and find hidden profit in 24 hours.
One-time $1,499 diagnostic. No subscription required.