Price Waterfall Formula: Calculate Your True Pocket Price
The complete price waterfall formula explained. Calculate pocket price, margin erosion, and cost-to-serve with step-by-step examples.
The price waterfall formula calculates the revenue you actually keep after every discount, rebate, and cost-to-serve eats into your list price.
Pocket Price = List Price - Invoice Discounts - Off-Invoice Deductions - Cost-to-ServeMcKinsey coined "pocket price" in their pricing research and found that for the average S&P 1500 company, a 1% price increase generates an 8% increase in operating profits. That impact is nearly 50% greater than a 1% reduction in variable costs. Yet most companies never calculate what price they actually receive.
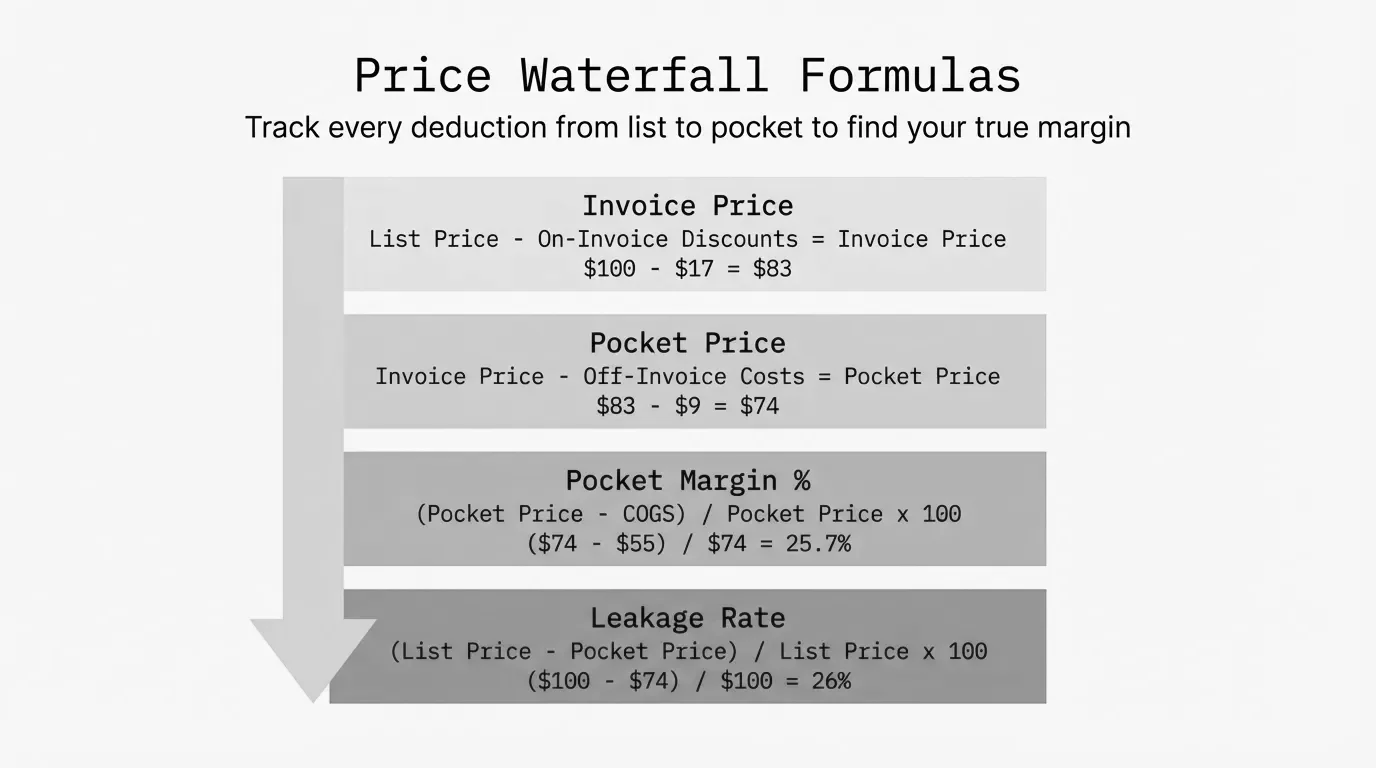
The Complete Price Waterfall Formula
The waterfall starts at list price and moves through three categories of deductions to reach pocket price, then subtracts COGS to get pocket margin.
List Price → Invoice Price → Pocket Price → Pocket MarginEach step has its own calculation:
| Stage | Formula |
|---|---|
| Invoice Price | List Price - On-Invoice Discounts |
| Pocket Price | Invoice Price - Off-Invoice Deductions - Cost-to-Serve |
| Pocket Margin | (Pocket Price - COGS) / Pocket Price x 100 |
The invoice price is what appears on the customer's bill. The pocket price is what actually lands in your pocket. The gap between them is where margin disappears.
Invoice Discount Formulas
On-invoice discounts are the visible deductions customers see. They include volume discounts, promotional pricing, contract pricing, and competitive price matching.
Volume Discount Calculation
Invoice Discount Amount = List Price x Discount PercentageIf you offer a 12% volume discount on a $500 list price item:
$500 x 0.12 = $60 discountInvoice Price = $500 - $60 = $440Stacked Discount Formula
Multiple discounts don't add—they compound. A 10% volume discount plus a 5% promotional discount doesn't equal 15%.
Final Price = List Price x (1 - Discount 1) x (1 - Discount 2)Applied to our $500 item:
$500 x 0.90 x 0.95 = $427.50That's a 14.5% total discount, not 15%. The difference compounds across thousands of transactions.
Invoice Discount Rate Formula
To measure overall invoice discount performance:
Invoice Discount Rate = (Total Invoice Discounts / Total List Revenue) x 100This tells you what percentage of potential revenue you're giving away before the invoice even goes out.
Off-Invoice Deduction Formulas
Off-invoice deductions happen after the sale. They're scattered across finance, logistics, and customer service—which is why they're easy to ignore and hard to manage. McKinsey found these deductions average 16.3% of list price.
Rebate Impact Formula
Rebates are the biggest off-invoice cost for most distributors. Annual rebates paid to customers based on volume targets:
Rebate Cost per Unit = Annual Rebate Amount / Units SoldIf you pay a customer $45,000 in annual rebates and they bought 15,000 units:
$45,000 / 15,000 = $3.00 rebate cost per unitTo see the impact on a specific transaction:
Post-Rebate Price = Invoice Price - (Invoice Price x Rebate %) A 3% rebate on a $440 invoice price:
$440 - ($440 x 0.03) = $426.80Cash Discount Cost Formula (Payment Terms)
Payment terms like "2/10 net 30" offer a 2% discount for payment within 10 days instead of the standard 30. The true annual cost of this discount:
Effective Annual Rate = (Discount % / (1 - Discount %)) x (360 / (Full Days - Discount Days))For 2/10 net 30:
(0.02 / 0.98) x (360 / 20) = 36.7% effective annual rateThat 2% sounds small. Annualized, you're giving customers the equivalent of a 36.7% return for paying 20 days early. If your cost of capital is 12%, you're losing money on every early payment.
Per-transaction cost:
Payment Terms Cost = Invoice Price x Cash Discount TakenOn a $440 invoice with 2% taken:
$440 x 0.02 = $8.80Freight Absorption Formula
Freight absorption happens when you eat shipping costs the customer should pay. Calculate your freight absorption rate:
Freight Absorption = Actual Freight Cost - Freight Billed to CustomerFreight Absorption Rate = (Freight Absorption / Total Freight Cost) x 100If shipping costs $2,400 on an order but you only bill $1,800:
$2,400 - $1,800 = $600 absorbed$600 / $2,400 x 100 = 25% absorption rateTo allocate per unit:
Freight Cost per Unit = Total Freight Absorbed / Units ShippedCost-to-Serve Formulas
Cost-to-serve captures expenses tied to specific customers that don't appear on any invoice. These vary wildly by customer and often explain why your largest accounts aren't your most profitable.
Customer-Level Cost-to-Serve
Customer Cost-to-Serve = Order Processing + Special Handling + Technical Support + Returns ProcessingBreak down each component:
| Cost Element | Formula |
|---|---|
| Order Processing | Number of Orders x Cost per Order |
| Special Handling | Handling Hours x Hourly Rate |
| Technical Support | Support Hours x Support Cost Rate |
| Returns Processing | Return Volume x Processing Cost |
A customer placing 200 small orders costs more to serve than one placing 10 large orders—even at the same revenue.
Cost-to-Serve as Percentage of Revenue
Cost-to-Serve % = (Total Cost-to-Serve / Customer Revenue) x 100If customer cost-to-serve is $12,000 on $150,000 revenue:
$12,000 / $150,000 x 100 = 8%That 8% comes directly off your margin.
The Pocket Margin Formula
Pocket margin is your actual profitability after everything. This is the number that matters.
Pocket Margin % = (Pocket Price - COGS) / Pocket Price x 100Or in dollar terms:
Pocket Margin $ = Pocket Price - COGSList Margin vs. Pocket Margin
Compare these two calculations to see margin erosion:
List Margin = (List Price - COGS) / List Price x 100Pocket Margin = (Pocket Price - COGS) / Pocket Price x 100Margin Erosion = List Margin - Pocket MarginIf your list margin is 40% and pocket margin is 22%, you have 18 percentage points of margin erosion. That's 18 points of profit leaking out through discounts and costs you may not be tracking.
Worked Example: Full Price Waterfall Calculation
A fastener distributor sells industrial bolts to a manufacturing customer. Here's the complete waterfall:
Starting Point:
- List Price: $100.00 per case
- COGS: $55.00 per case
- List Margin: 45%
On-Invoice Discounts:
| Discount Type | Rate | Amount |
|---|---|---|
| Volume Discount | 15% | -$15.00 |
| Contract Pricing | 8% | -$6.80 |
| Invoice Price | $78.20 |
Calculation: $100 x 0.85 x 0.92 = $78.20
Off-Invoice Deductions:
| Deduction | Rate/Amount | Per Case |
|---|---|---|
| Annual Rebate | 3% | -$2.35 |
| Cash Discount (2/10) | 2% of invoice | -$1.56 |
| Co-op Advertising | 1% | -$0.78 |
| After Off-Invoice | $73.51 |
Cost-to-Serve:
| Cost Element | Per Case |
|---|---|
| Freight Absorption | -$3.20 |
| Special Packaging | -$1.50 |
| Returns Processing | -$0.85 |
| Pocket Price | $67.96 |
Final Pocket Margin:
($67.96 - $55.00) / $67.96 x 100 = 19.1%Margin Erosion Summary:
| Metric | Value |
|---|---|
| List Price | $100.00 |
| List Margin | 45.0% |
| Invoice Price | $78.20 |
| Invoice Margin | 29.7% |
| Pocket Price | $67.96 |
| Pocket Margin | 19.1% |
| Total Margin Erosion | 25.9 points |
The list margin looked healthy at 45%. The actual pocket margin is 19.1%. More than half the margin disappeared through the waterfall.
Why These Formulas Matter
Every element in the price waterfall is a decision someone made. Volume discounts, rebate structures, payment terms, freight policies—these aren't fixed costs. They're pricing choices hiding in plain sight.
When you can calculate each component:
You see where margin goes. That 25.9 points of erosion in our example breaks down into specific causes: 15.3 points from invoice discounts, 6.9 points from off-invoice deductions, and 3.7 points from cost-to-serve. Now you know where to focus.
You can price to pocket. Instead of setting list prices and hoping for the best, work backward from your target pocket margin. If you need 25% pocket margin, what adjustments are required?
You find the hidden customers. Two accounts buying the same volume at the same price can have completely different pocket margins based on their payment behavior, service demands, and rebate structures.
McKinsey's research found that companies actively managing all elements of the pocket price waterfall often capture an additional 1% or more in realized prices. On a $50M revenue base, that's $500,000 in profit from better measurement—not from working harder.
For a deeper look at implementing price waterfall analysis in your business, see the complete guide to price waterfall analysis.
Start Calculating
The formulas here work in any spreadsheet. The challenge is applying them across thousands of SKUs, hundreds of customers, and millions of transactions to find the specific margin leaks in your data.
If you're running pricing analysis in Excel and suspect there's margin hiding in your waterfall, Pryse automates these calculations—upload your transaction data and see your pocket margins broken down by customer, product, and waterfall element in 24 hours.
Last updated: January 28, 2026
Frequently Asked Questions

Want to analyze your entire product catalog?
Pryse automatically identifies margin leakage across thousands of SKUs. Upload your data and find hidden profit in 24 hours.
One-time $1,499 diagnostic. No subscription required.