Cost-Based Pricing Example: 5 Methods With Full Calculations
Five detailed cost-based pricing examples with real calculations for distributors and manufacturers. Covers cost-plus, target-return, break-even, and absorption costing.
Cost-based pricing is a pricing strategy where the selling price of a product is determined by calculating total costs and adding a markup or target profit. It's the most widely used pricing approach in distribution and manufacturing because it's simple, defensible, and keeps you from selling below cost.
But "cost-based pricing" isn't a single method. It's a family of approaches that all start from the same place (your costs) and diverge in how they calculate the final number. A flat 25% markup on COGS is cost-based pricing. So is a price engineered to hit a 15% return on invested capital. Same starting point, very different results.
This article walks through five cost-based pricing methods with full calculations using realistic numbers for distributors and manufacturers. If you want the broader strategic context, see our cost-plus pricing guide.
What counts as cost-based pricing?
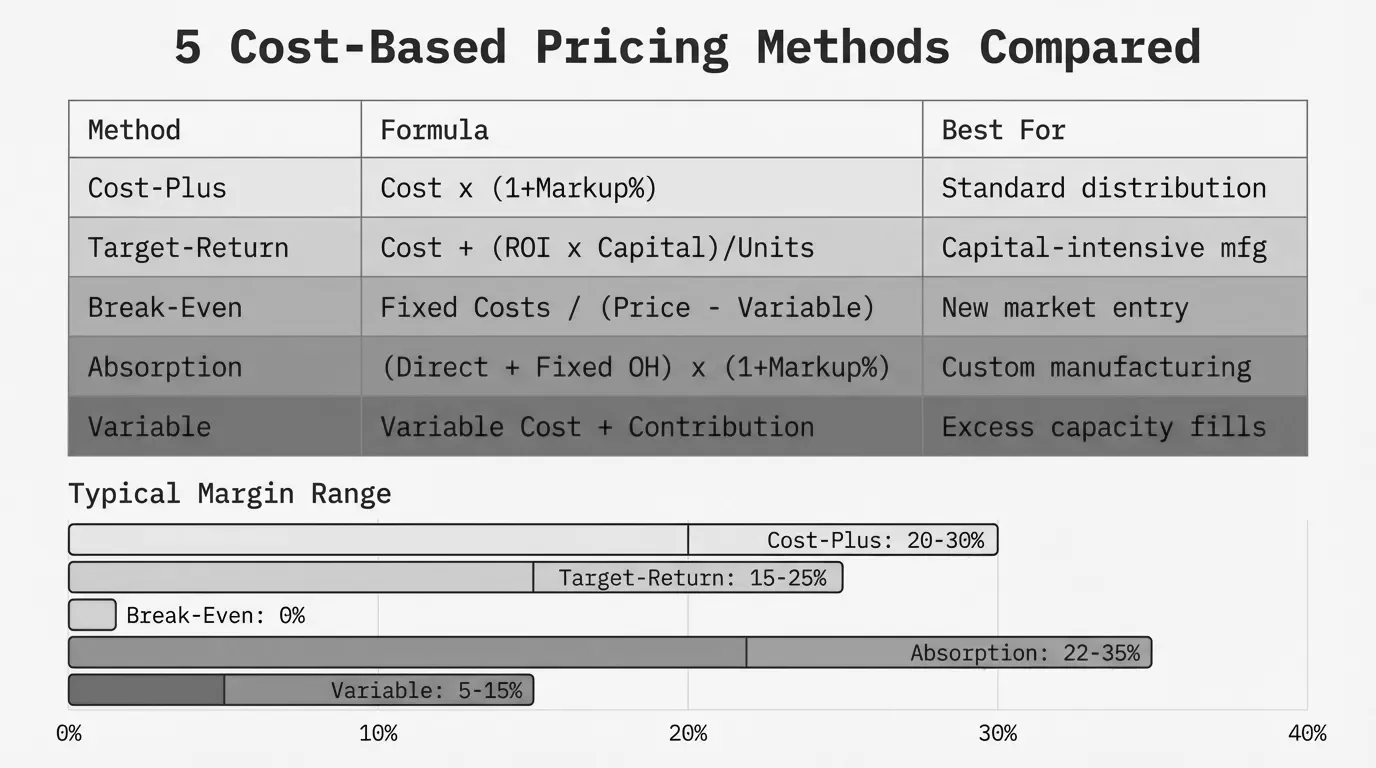
Any pricing method where the primary input is the seller's cost falls under the cost-based umbrella. The main variants:
| Method | How it works | Best for |
|---|---|---|
| Cost-plus (markup) | Adds a fixed % to unit cost | Day-to-day catalog pricing |
| Cost-plus with overhead allocation | Adds overhead before markup | Manufacturers with high fixed costs |
| Target-return pricing | Sets price to hit a specific ROI | Capital-intensive operations |
| Break-even pricing | Sets price at total cost, zero profit | Market entry, clearing inventory |
| Absorption costing | Loads all fixed + variable costs into unit cost | GAAP-compliant product costing |
Each has a place. None works for every situation. Let's walk through them.
Example 1: Basic cost-plus pricing for a distributor
This is the most common method in distribution. You take your cost from the supplier, add a markup percentage, and that's your selling price.
Scenario: A $65M electrical distributor buys industrial circuit breakers at $42.00 per unit from their manufacturer. Their standard markup for this product category is 28%.
Selling Price = Unit Cost x (1 + Markup %)
Selling Price = $42.00 x (1 + 0.28)
Selling Price = $42.00 x 1.28
Selling Price = $53.76
The gross margin on this sale:
Gross Margin = (Selling Price - Unit Cost) / Selling Price
Gross Margin = ($53.76 - $42.00) / $53.76
Gross Margin = 21.9%
Note that a 28% markup produces a 21.9% margin. These are not the same number, and confusing them is one of the most common pricing errors in distribution. Markup is calculated on cost. Margin is calculated on selling price.
Where this works: Commodity and standard products where you're managing thousands of SKUs and need a repeatable formula. A distributor carrying 30,000 SKUs can't build a custom pricing model for each one.
Where this breaks down: That same 28% markup on a $3 wire nut produces $0.84 in gross profit. After you factor in picking, packing, invoicing, and shipping, you might lose money on the transaction. Meanwhile, a specialty surge protector with the same 28% markup at a $180 cost could easily support a 35-40% margin because customers aren't price-shopping it.
For the full cost-plus pricing formula and its variations, see our detailed breakdown.
Example 2: Cost-plus with overhead allocation for a manufacturer
Manufacturers face a wrinkle that distributors don't: they need to account for production overhead in their cost base before applying a markup. Raw materials and direct labor are only part of the picture.
Scenario: A $45M industrial valve manufacturer produces a standard gate valve. Here are their costs per unit:
| Cost component | Per unit |
|---|---|
| Direct materials (castings, seals, stems) | $28.50 |
| Direct labor (2.5 hours at $26/hr) | $65.00 |
| Variable manufacturing overhead | $12.00 |
| Allocated fixed overhead | $18.75 |
| Total manufacturing cost | $124.25 |
The fixed overhead allocation of $18.75 comes from dividing total annual fixed manufacturing costs ($1.5M in facility costs, depreciation, supervisory salaries) across projected annual production volume of 80,000 units.
Fixed Overhead Per Unit = Total Annual Fixed Overhead / Projected Annual Units
Fixed Overhead Per Unit = $1,500,000 / 80,000
Fixed Overhead Per Unit = $18.75
Now they apply a 20% markup on total manufacturing cost:
Selling Price = Total Manufacturing Cost x (1 + Markup %)
Selling Price = $124.25 x (1 + 0.20)
Selling Price = $124.25 x 1.20
Selling Price = $149.10
Gross profit per unit: $24.85. Gross margin: 16.7%.
The volume trap: Notice what happens if actual production drops to 60,000 units instead of the projected 80,000. Fixed overhead per unit jumps from $18.75 to $25.00. Total manufacturing cost rises to $130.50. At the same $149.10 selling price, gross margin shrinks to 12.5%. If you don't adjust the price, you absorb the hit.
This is a real problem for manufacturers. Revenue Management Labs' 2024 pricing survey of 150 manufacturing executives found that net price increases are barely keeping pace with inflation, leading to margin compression. When your cost base shifts with production volume but your prices stay fixed, margins erode quietly.
For more on the cost-based pricing formula and how to handle overhead allocation, see our formula guide.
Example 3: Target-return pricing
Target-return pricing works backward from a profit goal. Instead of asking "what markup should I charge?" you ask "what price do I need to hit my return on investment?"
This approach is common in capital-intensive manufacturing where ownership or investors expect a specific return on the capital tied up in production equipment, facilities, and working capital.
Scenario: A $90M fastener manufacturer invested $4M in a new automated production line for specialty anchoring systems. They want a 15% annual return on that investment. Projected annual sales volume: 200,000 units. Unit production cost (fully loaded): $8.50.
Target Return Price = Unit Cost + (Desired Return x Invested Capital) / Unit Sales
Target Return Price = $8.50 + (0.15 x $4,000,000) / 200,000
Target Return Price = $8.50 + $600,000 / 200,000
Target Return Price = $8.50 + $3.00
Target Return Price = $11.50
At $11.50 per unit across 200,000 units, the company collects $2.3M in revenue. After $1.7M in production costs (200,000 x $8.50), they net $600,000, which is exactly 15% of the $4M investment.
The volume sensitivity problem: If sales come in at 150,000 units instead of 200,000, the math changes:
Revised Target Price = $8.50 + $600,000 / 150,000
Revised Target Price = $8.50 + $4.00
Revised Target Price = $12.50
Now you need $12.50 per unit to hit the same return. But can the market bear $12.50? That's the core weakness of target-return pricing: it assumes you control volume, and you usually don't.
When it works: Products with predictable demand and limited competition. Government contracts. Sole-source manufactured components where you're the only qualified supplier.
Example 4: Break-even pricing
Break-even pricing sets the price at the point where total revenue equals total costs. There's no profit at the break-even price. It's a floor, not a strategy.
Scenario: A $35M plumbing supply distributor wants to enter a new geographic market. They're launching with a line of PVC fittings and want to know the minimum price needed to cover all costs on projected volume of 500,000 units in year one.
| Cost type | Annual amount |
|---|---|
| Product cost (variable, per unit) | $1.85 |
| Warehouse lease, staff, trucks (fixed) | $320,000 |
| Sales and marketing (fixed) | $95,000 |
| Admin and overhead (fixed) | $85,000 |
| Total fixed costs | $500,000 |
Break-Even Price = Variable Cost Per Unit + (Total Fixed Costs / Projected Units)
Break-Even Price = $1.85 + ($500,000 / 500,000)
Break-Even Price = $1.85 + $1.00
Break-Even Price = $2.85
At $2.85 per unit, every dollar of revenue goes to covering costs. No profit. But the distributor now knows their floor. If competitors in this market sell the same fittings at $3.75, there's $0.90 of room between break-even and market price.
Alternate use: What volume do I need at a given price?
If the distributor wants to price at $3.50 (to undercut the $3.75 market slightly), what volume makes that work?
Break-Even Units = Total Fixed Costs / (Selling Price - Variable Cost Per Unit)
Break-Even Units = $500,000 / ($3.50 - $1.85)
Break-Even Units = $500,000 / $1.65
Break-Even Units = 303,030 units
They need about 303,000 units to break even at $3.50. Anything above that is profit. This is useful for evaluating whether a market entry makes financial sense before committing.
When to use break-even pricing: Temporarily. To win a first contract with a new account. To clear slow-moving inventory before it becomes obsolete. To establish presence in a new market where you'll raise prices once you've proven your service. It's never a long-term pricing strategy.
Example 5: Absorption costing for product pricing
Absorption costing (also called full costing) loads every manufacturing cost into the per-unit price: direct materials, direct labor, variable overhead, and fixed overhead. It's required under GAAP for financial reporting, and many manufacturers use it as their pricing cost base too.
Scenario: A $55M industrial pump manufacturer wants to price a new centrifugal pump model. Annual production plan: 5,000 units.
| Cost component | Total annual | Per unit |
|---|---|---|
| Direct materials | $1,750,000 | $350.00 |
| Direct labor (4 hrs at $32/hr) | $640,000 | $128.00 |
| Variable manufacturing overhead | $400,000 | $80.00 |
| Fixed manufacturing overhead | $750,000 | $150.00 |
| Total absorption cost | $3,540,000 | $708.00 |
Absorption Cost Per Unit = Direct Materials + Direct Labor + Variable Overhead + Fixed Overhead
Absorption Cost Per Unit = $350.00 + $128.00 + $80.00 + $150.00
Absorption Cost Per Unit = $708.00
To price the product, the manufacturer applies a 22% markup on the full absorption cost:
Selling Price = Absorption Cost Per Unit x (1 + Markup %)
Selling Price = $708.00 x 1.22
Selling Price = $863.76
Gross profit per unit: $155.76. Gross margin: 18.0%.
Absorption vs. variable costing difference: If they used variable costing instead (excluding the $150 fixed overhead), the cost base would be $558.00. A 22% markup would produce a selling price of $680.76. That looks cheaper, but it doesn't recover fixed overhead in the price. You'd need to make up the $750,000 in fixed costs from total contribution margin across all sales. Miss your volume target and those fixed costs don't get covered.
Why absorption costing matters for pricing: It builds fixed cost recovery directly into every unit. For a manufacturer running at 70-80% capacity utilization, this is safer than hoping volume covers the gap. The downside is that it punishes low-volume products. A pump that sells 500 units per year absorbs 10x more fixed overhead per unit than one selling 5,000, making the low-volume product look artificially expensive.
Comparing cost-based pricing methods
Here's how these five approaches stack up across the factors that matter most:
| Factor | Cost-plus | Cost-plus + overhead | Target-return | Break-even | Absorption |
|---|---|---|---|---|---|
| Complexity | Low | Medium | Medium | Low | High |
| Accounts for fixed costs | No | Yes | Partially | Yes | Yes |
| Guarantees profit | Yes | Yes | Yes (if volume holds) | No | Yes |
| Sensitive to volume changes | No | Yes | Very | Yes | Yes |
| Common in distribution | Very | Rare | Rare | Occasional | Rare |
| Common in manufacturing | Common | Very | Common | Occasional | Very |
| GAAP compliant | N/A | N/A | N/A | N/A | Yes |
The shared weakness of all cost-based methods
Every cost-based pricing method has the same blind spot: none of them consider what the customer is willing to pay.
McKinsey's 2003 article "The Power of Pricing" in The McKinsey Quarterly (authored by Marn, Roegner, and Zawada) found that a 1% price improvement generates an 8% increase in operating profits for the average company. For a $50M distributor running 4% operating margins, that 1% is $400K in profit without selling a single additional unit.
Cost-based pricing can't capture that upside. It tells you the floor. It doesn't tell you the ceiling. A 25% markup on a $40 specialty fitting produces a $50 selling price. But if customers routinely pay $60-65 for comparable items, you're giving away $10-15 per unit. Across 50,000 units per year, that's $500K-$750K left on the table.
Simon-Kucher's 2025 Global Pricing Study found that only 12% of companies believe they can boost profits by adjusting prices, while the rest focus on volume or cost-cutting. That's a missed opportunity. The companies that combine cost-based floors with market and value-based ceilings consistently outperform those that rely on cost-based pricing alone.
The practical approach for mid-market distributors and manufacturers: use cost-based pricing as your starting point, then layer in competitive benchmarks and customer willingness-to-pay data where you can. Cost-plus for your commodity tail. Value-informed pricing for your specialty products. That's how you stop leaving money on the table without building a pricing department.
How to spot when cost-based pricing is costing you money
If you're running cost-plus across your catalog, look for these warning signs:
Margins that are suspiciously consistent. If every product category returns roughly the same gross margin percentage, you're almost certainly underpricing specialty items and overpricing commodities. Real-world margins should vary.
Sales reps who never get price pushback. If your team closes deals at list price regularly, your list prices are probably too low. Some pushback is healthy. Zero pushback means you're leaving margin on the table.
High win rates on quotes. A win rate above 70-80% on competitive bids suggests your prices are below market. You'd make more money winning fewer bids at higher prices.
Cost increases that compress margins. If supplier cost increases shrink your margins because you can't pass them through, your prices were already at the customer's limit. A 2024 survey of 150 manufacturing executives by Revenue Management Labs found that net price increases are barely keeping pace with inflation. Cost-based pricing makes this worse because it anchors customers to your cost structure.
The fastest way to find these gaps is to build a price waterfall for your top 100 customer-product combinations. You'll see where realized margins diverge from your targets and where cost-based pricing is working against you.
Start with your actual margins
Cost-based pricing is a starting point. It's not wrong. It's incomplete. The five methods above give you different ways to set a floor price, and choosing the right one depends on whether you're a distributor or manufacturer, how capital-intensive your operations are, and whether you need GAAP-compliant costing.
The real question is what happens above that floor. If you're running cost-plus across 10,000+ SKUs and don't know where your realized margins actually land, that's the gap to close first. Export your transaction data, calculate pocket margin by product and customer, and find the cost-plus pricing examples where a flat markup is leaving the most money on the table.
Pryse builds that visibility from a CSV upload in 24 hours. No six-month implementation. No $100K platform. Just your data, your margins, and the dollar amounts hiding in between.
Last updated: February 1, 2026
Frequently Asked Questions

Want to analyze your entire product catalog?
Pryse automatically identifies margin leakage across thousands of SKUs. Upload your data and find hidden profit in 24 hours.
One-time $1,499 diagnostic. No subscription required.