Cost-Plus Pricing Examples: Real Math for Distributors and Manufacturers
5 cost-plus pricing examples with actual formulas and dollar amounts. See how distributors and manufacturers calculate markups, where the model works, and where it leaks margin.
Cost-plus pricing is a pricing method where you calculate the total cost of a product and add a fixed percentage markup to set the selling price. It's the most widely used pricing method in distribution and manufacturing, with roughly 75% of companies using some form of cost-based pricing, according to research cited by Omnicalculator and multiple pricing industry sources.
The formula is straightforward:
Selling Price = Total Cost per Unit x (1 + Markup Percentage)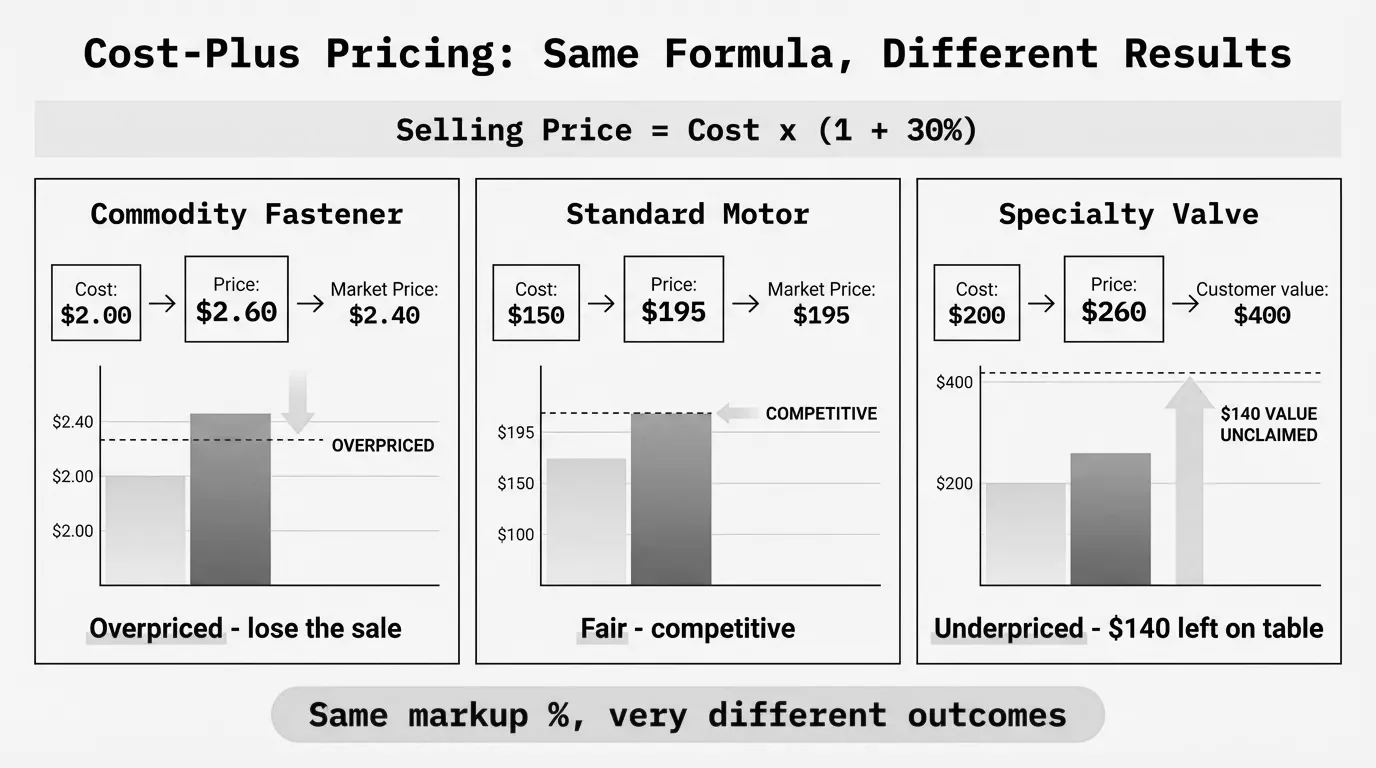
But "straightforward" doesn't mean "optimal." After six years of pricing work with distributors and manufacturers, I've seen the same pattern: companies default to cost-plus because it's simple, then wonder why margins erode year after year. The problem isn't the formula. It's applying it uniformly across 10,000+ SKUs without thinking about what each product is actually worth to the customer.
This post walks through five concrete cost-plus pricing examples with real math, shows you where the model works, and explains where it quietly bleeds margin. For the full framework, see our cost-plus pricing guide.
The cost-plus pricing formula
Before the examples, let's nail the formula. There are two versions, and mixing them up is one of the most expensive mistakes in B2B pricing.
Markup-based (standard cost-plus):
Selling Price = Cost x (1 + Markup %)Margin-based:
Selling Price = Cost / (1 - Margin %)These produce different numbers. A 25% markup is not a 25% margin. Here's the math:
$100 cost x (1 + 0.25) = $125 selling price → 20% gross margin
$100 cost / (1 - 0.25) = $133.33 selling price → 25% gross margin
That $8.33 difference per unit adds up fast across thousands of transactions. According to AccountingTools, confusing markup and margin is one of the most common pricing errors in business, and the consulting firm Kaizen CPAs estimates it can cost companies 7-10% in lost profits annually. For the complete breakdown, see our cost-plus pricing formula guide. And if you want to double-check your margin math, here's our gross margin formula reference.
Example 1: Industrial fastener distributor
A $45M fastener distributor buys hex bolts from a domestic manufacturer. Here's their cost-plus calculation on a standard 3/8"-16 hex bolt:
Product cost (from supplier): $0.42 per unit
Inbound freight allocation: $0.03
Warehouse handling: $0.02
Total landed cost: $0.47
Markup: 35%
Selling price = $0.47 x 1.35 = $0.63
Gross profit per unit: $0.16
Gross margin: 25.9%
This works fine for commodity fasteners. The customer buys thousands at a time, shops around, and knows roughly what bolts cost. A 35% markup lands in the 25-26% margin range that's standard for A-items in distribution.
But here's where it breaks. That same distributor sells specialty stainless socket head cap screws. Same 35% markup:
Product cost: $1.85
Landed cost: $1.94
Selling price = $1.94 x 1.35 = $2.62
Gross profit: $0.68
The problem? That specialty screw is hard to find, requires a minimum order from the manufacturer, and the customer needs it to avoid a $5,000/hour production line shutdown. The customer would pay $4.50 without hesitating. The flat markup leaves $1.88 per unit on the table. On 5,000 screws a year, that's $9,400 in margin the distributor walked away from.
Example 2: Contract electronics manufacturer
A mid-size contract manufacturer builds circuit board assemblies for industrial equipment OEMs. They use cost-plus to quote jobs:
Bill of materials (components): $142.00
Direct labor (1.5 hours x $28/hr): $42.00
Machine time (0.5 hours x $65/hr): $32.50
Testing and QC: $8.50
Total direct cost: $225.00
Overhead allocation (40% of direct cost): $90.00
Total cost: $315.00
Markup: 25%
Selling price = $315.00 x 1.25 = $393.75
Gross profit: $78.75
Gross margin: 20%
A 25% markup on total cost (including overhead) is standard for mid-volume contract electronics manufacturing, according to industry benchmarks from The DigiSource. It covers the manufacturer's costs and delivers a 20% gross margin.
Where this example gets interesting: the OEM customer previously bought these assemblies from a competitor at $425 each, but switched because of quality problems. The contract manufacturer priced at $393.75 based on their costs. They left $31.25 per unit on the table because they didn't ask what the customer was already paying. On a 2,000-unit annual contract, that's $62,500 in margin they gave away for free.
Example 3: Electrical distribution branch
A $90M electrical distributor uses a tiered cost-plus model across product categories:
| Category | Example Products | Avg. Cost | Markup | Selling Price | Gross Margin |
|---|---|---|---|---|---|
| Wire & cable | 12/2 Romex, THHN | $85.40/roll | 18% | $100.77 | 15.3% |
| Switchgear | Panels, breakers | $342.00 | 24% | $424.08 | 19.3% |
| Lighting | LED fixtures, controls | $67.50 | 32% | $89.10 | 24.2% |
| Fittings & connectors | Conduit fittings | $4.20 | 40% | $5.88 | 28.6% |
| Safety & tools | PPE, testers | $28.00 | 38% | $38.64 | 27.6% |
This is better than a flat markup. Wire and cable are commodities, so 18% keeps the distributor competitive against other supply houses. Fittings carry a 40% markup because nobody price-shops a $4 conduit connector.
But the tiered model still treats every customer the same. A national electrical contractor buying $2M/year gets the same 18% markup on wire as a small shop buying $15K/year. That's backwards. The large customer deserves tighter pricing (and they'll demand it). The small customer doesn't compare prices and would accept a higher markup.
Electrical distributors typically run 19-25% gross margins, according to NAED PAR survey benchmarks. Graybar reported 19.5% gross margin in Q2 2024, while Rexel's North American operations achieved 24.1% in the same period, per their public earnings reports. The spread between those two numbers tells you how much pricing strategy matters.
Example 4: Industrial chemical manufacturer
A specialty chemical manufacturer produces cleaning solvents for manufacturing facilities. Their cost-plus calculation for a 55-gallon drum:
Raw materials: $186.00
Direct labor: $24.00
Energy costs: $18.00
Packaging (drum + labels): $32.00
Quality testing: $12.00
Total manufacturing cost: $272.00
Overhead (35%): $95.20
Total cost: $367.20
Markup: 45%
Selling price = $367.20 x 1.45 = $532.44
Gross profit: $165.24
Gross margin: 31.0%
A 45% markup is reasonable for specialty chemicals. But here's the cost-plus trap that catches manufacturers specifically: raw material costs fluctuate. When toluene prices spiked 28% in 2022, this manufacturer's cost jumped from $367.20 to $419.41. If they held the same $532.44 price for existing customers (common during multi-month contracts), their margin dropped from 31% to 21.3%.
The fix is straightforward. Build raw material escalation clauses into contracts so your price adjusts when input costs cross a threshold. Simon-Kucher's Global Pricing Study 2019 found that companies realize only about 28% of announced price increases on average. For cost-plus manufacturers, that means a 10% cost increase that should trigger a 10% price increase actually lands as a 2.8% realized increase. The rest is margin you'll never recover.
Example 5: Plumbing and HVAC distributor
A $32M plumbing distributor uses cost-plus with customer-tier adjustments:
Product: 3/4" copper fitting
Landed cost: $3.85
Tier 1 (contractors, $500K+/year): 22% markup → $4.70
Tier 2 (contractors, $100-500K/year): 30% markup → $5.01
Tier 3 (small shops, under $100K/year): 42% markup → $5.47
Walk-in / counter sales: 55% markup → $5.97
This is cost-plus done right. The markup reflects the cost-to-serve difference between a Tier 1 contractor (large orders, predictable demand, low service cost) and a walk-in customer (small orders, needs help at the counter, picks up one fitting at a time).
The margin spread tells the story:
| Customer Tier | Markup | Gross Margin | Annual Revenue | Margin Dollars |
|---|---|---|---|---|
| Tier 1 | 22% | 18.0% | $12.4M | $2.23M |
| Tier 2 | 30% | 23.1% | $9.8M | $2.26M |
| Tier 3 | 42% | 29.6% | $6.2M | $1.84M |
| Walk-in | 55% | 35.5% | $3.6M | $1.28M |
Notice that Tier 2 generates more margin dollars than Tier 1 despite lower revenue. And Tier 3 contributes nearly as much margin as the biggest accounts. Flat-markup distributors miss this entirely because they give away margin on smaller accounts to stay "competitive" against phantom competition.
When cost-plus pricing works
Cost-plus isn't a bad method. It's a limited one. Here's where it earns its keep:
Commodity products with low differentiation. When every distributor sells the same product from the same manufacturer, cost-plus gives you a consistent, defensible price. The customer is buying availability and service, not unique product value.
Government and defense contracts. The Federal Acquisition Regulation (FAR Part 16) defines specific cost-plus contract types, including cost-plus-fixed-fee (CPFF) and cost-plus-incentive-fee (CPIF). Government buyers often require cost transparency and set allowable markup ranges. Cost-plus is the expected pricing model here.
New product categories. When you're adding a product line you haven't sold before and have no competitive data, cost-plus gives you a starting price that at least covers your costs. Refine from there once you have market feedback.
Inflationary pass-throughs. When supplier costs rise, cost-plus provides a clean mechanism to adjust prices. "Our cost went up 8%, so your price goes up 8%" is easy for customers to understand. During the 2022-2024 inflation period, this transparency helped distributors maintain relationships while protecting margin.
When cost-plus pricing fails
Specialty and technical products. If you sell something the customer can't easily get elsewhere, cost-plus almost certainly underprices it. The customer's alternative isn't your cost plus a markup. Their alternative is downtime, a project delay, or an expensive workaround.
Tail SKUs (bottom 50% of your catalog). According to Waypoint Analytics research cited by SPARXiQ, the typical distributor loses money on 40% of their invoice line items. Most of those losses happen on low-volume items priced with the same markup as high-volume commodities. Nobody price-shops a $6 specialty fitting. Mark it up 60% instead of 25%.
Large accounts with negotiating power. Cost-plus becomes a ceiling, not a floor, when large customers demand cost transparency. If they know your cost and your markup, they'll negotiate the markup down. You end up defending a number instead of defending the value you deliver.
Products with variable cost-to-serve. Delivering a $200 order to a remote job site costs you more than shipping a $5,000 pallet to a warehouse dock. A flat markup doesn't account for that difference. Your small, expensive-to-serve orders subsidize your large, efficient ones.
Cost-plus vs. other pricing methods
| Factor | Cost-plus | Competition-based | Value-based |
|---|---|---|---|
| Based on | Your costs | Competitor prices | Customer's willingness to pay |
| Complexity | Low | Medium | High |
| Data needed | Cost data only | Market/competitor data | Customer research + cost data |
| Best for | Commodities, government | Transparent markets | Differentiated products |
| Risk | Underpricing value | Price wars | Overpricing without data |
| Margin outcome | Predictable but often suboptimal | Reactive and volatile | Highest potential |
| Typical use in distribution | Price floor | Reference point | Specialty adjustments |
Most successful distributors don't pick one model. They use cost-plus as the floor, competitive data as a reference, and value-based adjustments where they have differentiation. McKinsey's 2003 article "The Power of Pricing" in The McKinsey Quarterly by Marn, Roegner, and Zawada found that a 1% improvement in realized pricing generates an 8% increase in operating profits for the average company. That improvement doesn't come from better cost-plus math. It comes from identifying the transactions where cost-plus is leaving money on the table and pricing those differently.
How to improve your cost-plus pricing
If you're running cost-plus today (and most distributors are), you don't need to throw it out. You need to layer intelligence on top of it.
Step 1: Know your actual margins. Not the markup you intend. The margin you actually realize after discounts, freight, returns, and rebates. Export 12 months of transaction data and calculate pocket margin by product and customer. Most companies find a 5-15 percentage point gap between intended and realized margin.
Step 2: Segment your catalog. Split products into at least three tiers based on price sensitivity. Commodities get tight markups. Standard products get moderate markups. Specialty items get higher markups. This alone typically recovers 1-3% in gross margin.
Step 3: Segment your customers. A Tier 1 account buying $1M/year at 18% margin is worth more than a Tier 3 account buying $50K at 30% margin. But that Tier 3 account shouldn't get Tier 1 pricing just because a sales rep wants to "grow the relationship."
Step 4: Set floors, not ceilings. Use cost-plus as your minimum acceptable price on any transaction. Then let market data, customer value, and competitive position determine where the actual price lands above that floor.
Step 5: Measure and adjust. Track margin realization quarterly. SPARXiQ's research shows that pricing overrides account for 50% or more of transactions at many distributors, and those overrides sacrifice roughly 10 margin points versus matrix values. If your sales team is overriding prices on half their deals, your cost-plus model is a suggestion, not a strategy.
Pryse runs this diagnostic automatically. Upload your transaction CSV and you'll see where your cost-plus model works, where it leaks, and the dollar opportunity sitting in each gap. In 24 hours, not six months.
For the complete cost-plus framework including formulas, calculators, and implementation steps, see our cost-plus pricing guide.
Last updated: February 1, 2026
Frequently Asked Questions

Want to analyze your entire product catalog?
Pryse automatically identifies margin leakage across thousands of SKUs. Upload your data and find hidden profit in 24 hours.
One-time $1,499 diagnostic. No subscription required.