Cost-Plus Pricing Calculator: How to Calculate Your Selling Price Step by Step
Learn how to calculate cost-plus pricing with formulas, worked examples, and an Excel walkthrough. Includes markup-to-margin table and common calculation mistakes.
Cost-plus pricing is the most common pricing method in distribution and manufacturing. The formula itself is simple. The mistakes happen in what you include as "cost" and how you translate your markup into actual margin.
This walkthrough covers the core formula, worked examples at different complexity levels, how to build a cost-plus calculator in Excel, and the calculation errors that quietly eat margin across thousands of SKUs.
For the broader strategy behind when cost-plus works and when it doesn't, see our cost-plus pricing guide.
The core cost-plus pricing formula
Cost-plus pricing starts with one equation:
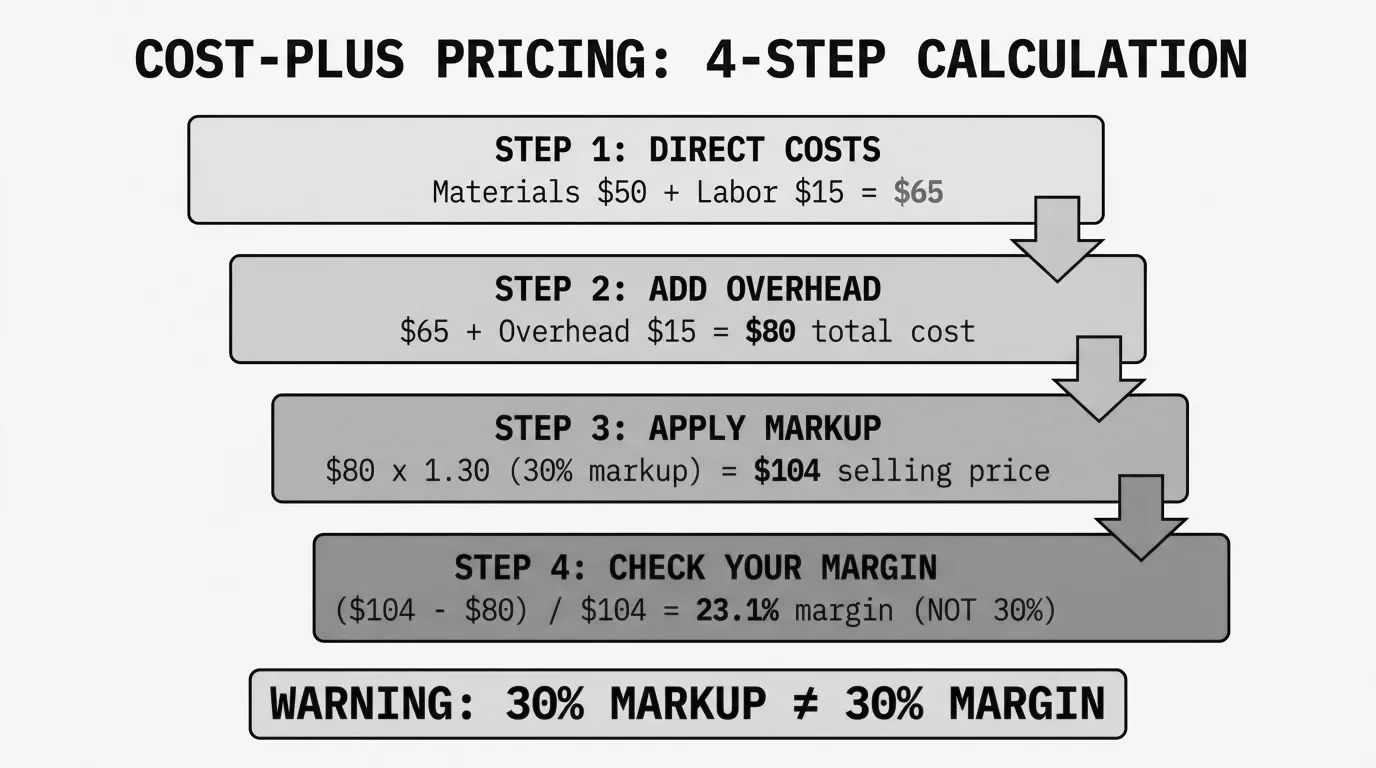
Selling Price = Total Cost per Unit x (1 + Markup %)That's it. If your total cost per unit is $80 and you want a 30% markup:
$80 x (1 + 0.30) = $80 x 1.30 = $104The selling price is $104, and your gross profit is $24 per unit.
Where this gets interesting is in two places: what counts as "total cost" and whether your markup percentage actually delivers the margin you think it does.
Step-by-step cost-plus calculation
Step 1: Calculate direct costs per unit
Direct costs are what you can tie directly to a specific product:
- Materials or COGS - For a distributor, this is your purchase cost from the supplier. For a manufacturer, it's raw materials, components, and packaging.
- Direct labor - Production labor, assembly time, or any hands-on work attributable to the unit.
If you're a distributor buying a widget for $42.50 from your supplier, that's your direct cost. Straightforward.
For a manufacturer producing the same widget with $28 in materials and $9.50 in direct labor, the direct cost is $37.50.
Step 2: Allocate overhead per unit
This is where most cost-plus calculations go wrong. Overhead includes everything that keeps the business running but doesn't attach neatly to a single unit:
- Warehouse rent and utilities
- Equipment depreciation
- Insurance and compliance
- Warehouse staff not doing direct production
- IT systems and ERP licenses
- Management salaries
To allocate overhead, you need a cost driver. The simplest approach:
Overhead per Unit = Total Annual Overhead / Total Annual Units ShippedSay you're a $50M distributor with $4.2M in annual overhead and you ship 280,000 order lines per year:
$4,200,000 / 280,000 = $15.00 overhead per order lineThat $15 gets added to every unit's cost before you apply markup. Miss this step and you're pricing off incomplete costs.
Step 3: Calculate total cost per unit
Total Cost per Unit = Direct Cost + Overhead AllocationFor our distributor buying at $42.50 with $15 in overhead:
$42.50 + $15.00 = $57.50 total cost per unitStep 4: Apply your markup
Pick your markup percentage and multiply:
Selling Price = $57.50 x (1 + 0.28) = $57.50 x 1.28 = $73.60Your gross profit per unit is $16.10. Your gross margin is 21.9%.
Notice that a 28% markup produced a 21.9% margin, not 28%. More on why below.
Worked examples
Example 1: Single product (distributor)
A plumbing distributor buys a valve for $67 from the manufacturer. They've calculated their overhead per order line at $12.
| Component | Amount |
|---|---|
| Purchase cost (COGS) | $67.00 |
| Overhead allocation | $12.00 |
| Total cost | $79.00 |
| Markup (35%) | $27.65 |
| Selling price | $106.65 |
| Gross profit | $27.65 |
| Gross margin | 25.9% |
For a deeper look at the cost-plus pricing formula, including variations for different scenarios, see our dedicated post.
Example 2: Bulk order with volume discount
Same valve, but the customer orders 500 units and your supplier gives you a 6% volume discount on orders over 200.
| Component | Per Unit | 500-Unit Total |
|---|---|---|
| Purchase cost | $67.00 | $33,500.00 |
| Volume discount (6%) | -$4.02 | -$2,010.00 |
| Net purchase cost | $62.98 | $31,490.00 |
| Overhead allocation | $12.00 | $6,000.00 |
| Total cost | $74.98 | $37,490.00 |
| Markup (30%) | $22.49 | $11,247.00 |
| Selling price | $97.47 | $48,737.00 |
| Gross margin | 23.1% | - |
The lower markup on the bulk order (30% vs 35%) still works because your input cost dropped with the supplier discount. Your margin is 23.1% versus 25.9% on a single unit, but you moved 500 units.
Example 3: Manufacturer with full overhead allocation
An industrial manufacturer produces a custom bracket. Here's the full cost buildup:
| Cost Component | Amount |
|---|---|
| Raw steel | $8.40 |
| Machining supplies | $1.20 |
| Fasteners and hardware | $0.85 |
| Total materials | $10.45 |
| Direct labor (0.4 hrs x $28/hr) | $11.20 |
| Total direct cost | $21.65 |
| Factory overhead (0.4 hrs x $35/hr rate) | $14.00 |
| SGA allocation (12% of direct cost) | $2.60 |
| Total cost | $38.25 |
| Markup (40%) | $15.30 |
| Selling price | $53.55 |
| Gross margin | 28.6% |
The manufacturer used activity-based overhead allocation. Factory overhead is allocated per labor hour ($35/hr), which accounts for machine time, facility costs, and supervision. SGA (selling, general, and administrative) is allocated as a percentage of direct cost.
This level of detail matters when you have thousands of SKUs with different production profiles. A bracket that takes 0.4 hours to machine absorbs very different overhead than one that takes 2.5 hours.
Markup vs. margin: the table every pricing person needs
This is the single most common calculation error in cost-plus pricing. A 30% markup does not give you a 30% margin. Not even close.
Here's the conversion table:
| Markup % | Gross Margin % | Multiplier |
|---|---|---|
| 10% | 9.1% | 1.10 |
| 15% | 13.0% | 1.15 |
| 20% | 16.7% | 1.20 |
| 25% | 20.0% | 1.25 |
| 30% | 23.1% | 1.30 |
| 33.3% | 25.0% | 1.33 |
| 35% | 25.9% | 1.35 |
| 40% | 28.6% | 1.40 |
| 50% | 33.3% | 1.50 |
| 75% | 42.9% | 1.75 |
| 100% | 50.0% | 2.00 |
The conversion formulas:
Margin % = Markup % / (1 + Markup %)
Markup % = Margin % / (1 - Margin %)
If your finance team targets a 30% gross margin, you need a 42.9% markup, not 30%. If you're applying a 30% markup thinking you're getting 30% margin, you're short by almost 7 percentage points on every transaction. Across 50,000 SKUs, that adds up fast.
For a dedicated conversion tool, see our markup to margin calculator.
How to build a cost-plus pricing calculator in Excel
You don't need pricing software to run cost-plus calculations at scale. A well-structured spreadsheet handles it for most mid-market distributors and manufacturers. Here's how to build one.
Column structure
Set up your spreadsheet with these columns:
| Column | Header | Purpose |
|---|---|---|
| A | SKU | Product identifier |
| B | Description | Product name |
| C | Direct Cost | Purchase price or manufacturing cost |
| D | Overhead Rate | Per-unit overhead allocation |
| E | Total Cost | C + D |
| F | Markup % | Your target markup |
| G | Selling Price | E * (1 + F) |
| H | Gross Profit | G - E |
| I | Gross Margin % | H / G |
Key formulas
In cell E2 (Total Cost):
=C2+D2
In cell G2 (Selling Price):
=E2*(1+F2)
In cell H2 (Gross Profit):
=G2-E2
In cell I2 (Gross Margin %):
=(G2-E2)/G2
Format column I as a percentage. This is your reality check. If column F says 30% but column I says 23.1%, you now understand the markup-margin gap.
Adding a margin-based target
If your finance team gives you margin targets instead of markup targets, add a column that back-calculates the required markup:
In cell J2 (Required Markup for Target Margin):
=TargetMargin/(1-TargetMargin)
Where TargetMargin is a cell reference to your desired margin (e.g., 0.30 for 30%). This tells you the exact markup to plug into column F to hit your margin target.
Tiered markup by product category
Most distributors shouldn't use a flat markup across all products. Add a VLOOKUP or INDEX/MATCH that pulls the markup percentage based on product category:
=VLOOKUP(ProductCategory,MarkupTable,2,FALSE)
Create a reference table on a separate sheet:
| Category | Markup % |
|---|---|
| Commodity | 20% |
| Standard | 30% |
| Specialty | 42% |
| Services | 55% |
This avoids what SPARXiQ CEO David Bauders calls "peanut butter pricing," where you spread the same markup across everything. According to SPARXiQ's analysis of hundreds of distributors' invoice data, salespeople who override pricing matrices commonly sacrifice about 10 margin points versus matrix values. The calculator gives your team a structured starting point.
For more on building margin calculations in spreadsheets, see our guide to calculating margin in Excel.
Common cost-plus calculation mistakes
After six years of pricing work with distributors and manufacturers, these are the errors I see on repeat.
Mistake 1: Confusing markup with margin
This is the most expensive math error in pricing. A distributor sets a "30% margin" policy, applies 30% markup, and actually earns 23.1% margin. On $50M in revenue, that 6.9-point gap represents roughly $3.45M in margin they thought they had but don't.
The fix: always verify your markup against the margin it produces. Use the conversion table above or the formula
Mistake 2: Forgetting overhead allocation
Pricing off direct cost alone is tempting because it's the easiest number to find. Your ERP shows the purchase price or bill of materials. But if your business runs $4M in overhead on $50M in revenue, that's 8% of sales that needs to be covered somewhere.
When you skip overhead in the cost base, your "30% markup" is really covering overhead first and profit second. Your actual product-level margin is much thinner than it looks.
Mistake 3: Ignoring off-invoice costs
Even with overhead included, cost-plus pricing typically calculates margin at the invoice level. The real margin, your pocket margin, accounts for everything between invoice and cash collected:
- Early payment discounts (2/10 net 30 = 36% annualized)
- Freight absorption
- Rebates and chargebacks
- Returns and restocking
- Customer-specific accommodations
McKinsey's 2003 article "The Power of Pricing" in The McKinsey Quarterly (by Marn, Roegner, and Zawada) found that by making selective changes across these "waterfall elements," one company improved its average pocket margin by 4 percentage points and operating profits by 60% within a year.
Your cost-plus calculator shows the starting price. What you actually pocket is often 7-15% less. Build a pocket price waterfall to see where that gap lives.
Mistake 4: Using stale costs
Supplier costs change. In 2022-2024, some manufacturers adjusted prices nine or more times per year. If your cost-plus calculator runs off last quarter's purchase price, your markup is applied to the wrong base.
Set up your spreadsheet to pull from your most recent purchase orders or ERP cost records. At minimum, review costs monthly for your top 20% of SKUs by volume.
Mistake 5: The overhead volume trap
Your overhead allocation depends on the volume denominator. If you calculated $15 per unit based on 280,000 annual order lines, but volume drops to 220,000, your actual overhead per unit jumps to $19.09. Your prices haven't changed, but your cost base has.
This is what CFO Perspective calls the "chicken vs. egg" problem of cost-plus pricing: price depends on volume, but volume depends on price. Review your overhead allocation rate at least quarterly.
When cost-plus isn't enough
Cost-plus pricing covers your costs and generates a predictable margin. That's its strength and its limitation.
According to INSIGHT2PROFIT, a 1% improvement in price increases operating profits by 11% on average. Their client data shows that shifting from pure cost-plus to more sophisticated methods generates an average 4% gain in realized price. For a $75M distributor running 4% operating margins, that's the difference between $3M and $6M in operating profit.
The gap happens because cost-plus treats every product the same. A $4 commodity fitting and a $400 specialty valve both get the same percentage. But nobody price-shops the specialty valve. SPARXiQ's distribution research shows that companies with mature pricing strategies outperform industry average profitability by 50-200%.
Cost-plus is a legitimate starting point. Most $20M-$200M distributors use it because it's practical when you're managing 5,000-100,000 SKUs. The next step is layering in segmented markups by product category, customer type, and competitive exposure. The calculator you built in Excel above can handle that with a few extra columns and a lookup table.
Pryse identifies where your cost-plus pricing leaves margin on the table. Upload a CSV, and you'll see exactly which product-customer combinations are underpriced, overpriced, or losing money within 24 hours.
Last updated: February 1, 2026
Frequently Asked Questions

Want to analyze your entire product catalog?
Pryse automatically identifies margin leakage across thousands of SKUs. Upload your data and find hidden profit in 24 hours.
One-time $1,499 diagnostic. No subscription required.