Cost-Plus Pricing Strategy: When It Works, When It Doesn't, and How to Do It Right
Cost-plus pricing adds a fixed markup to your costs. Here's when that works, when it leaves money on the table, and how distributors and manufacturers can use it as part of a smarter pricing strategy.
A cost-plus pricing strategy sets selling prices by adding a fixed percentage markup to the total cost of producing or acquiring a product. It's the most common pricing method in distribution and manufacturing because it's simple, it scales across large catalogs, and it prevents you from selling below cost.
It's also the reason many mid-market companies leave 2-5% of margin on the table every year.
That's not a contradiction. Cost-plus is a useful tool. It just shouldn't be your only tool. This article covers when cost-plus works, where it breaks down, how to calculate it correctly, and how to blend it with other approaches so you're not handing margin to customers who'd happily pay more.
For the complete overview of cost-plus pricing, see our cost-plus pricing guide.
What cost-plus pricing actually is
Cost-plus pricing starts with your cost and adds a predetermined markup to reach the selling price. The formula is straightforward:
Selling Price = Total Unit Cost x (1 + Markup %)
If your total cost per unit is $50 and you want a 30% markup:
$50 x (1 + 0.30) = $65 selling price
The "total unit cost" part is where it gets more involved than most people think. For a distributor, total cost means the landed cost of the product: purchase price plus inbound freight, duties, and handling. For a manufacturer, it means direct materials, direct labor, and allocated manufacturing overhead (rent, utilities, equipment depreciation, supervision).
The overhead allocation matters more than most companies realize. Two manufacturers with identical direct costs can calculate different unit costs depending on how they allocate overhead. If you spread $500,000 in factory overhead across 50,000 units, that's $10 per unit. Drop volume to 40,000 units and it jumps to $12.50. Your cost-plus price just moved 5% without any change in materials, labor, or market conditions.
For the full calculation walkthrough, see our cost-plus pricing formula breakdown.
Why cost-plus dominates distribution and manufacturing
Walk into almost any distributor or manufacturer between $20M and $200M in revenue and you'll find cost-plus pricing running the show. There are real reasons for that.
Scale. When you're managing 10,000 to 100,000 SKUs, you need a pricing method that works across the whole catalog without individual analysis on each item. Cost-plus does that. Set your markup tiers, apply them to cost categories, and you've got prices for everything.
Simplicity. The pricing manager, the sales rep, and the customer can all understand how the price was set. Try explaining a value-based price to a purchasing agent who wants to see your cost breakdown. Cost-plus makes negotiations transparent.
ERP compatibility. Every major ERP system (NetSuite, SAP B1, Epicor, Acumatica) supports cost-plus pricing natively. You load your costs, set your markup rules, and the system generates prices. No additional software required.
Downside protection. Cost-plus guarantees you won't sell below cost on any individual transaction. That sounds obvious, but when you've got 15 sales reps quoting thousands of items, the floor matters.
SPARXiQ's research on distribution pricing found that pricing in most distributors is "often built in home-grown Excel spreadsheets" and "heavily based on cost-plus approaches." That's not ignorance. It's pragmatism. These companies don't have dedicated pricing teams or six-figure software budgets. They need something that works today with the tools they have.
Where cost-plus pricing fails
The problems with cost-plus aren't subtle. They compound over time and across product lines in ways that are hard to spot without transaction-level analysis.
It ignores what customers will actually pay
This is the fundamental limitation. Your costs have nothing to do with your customer's willingness to pay. A 25% markup on a $40 commodity fitting and a 25% markup on a $40 specialty connector produce the same $10 of gross profit. But the customer buying the commodity can get it from three other distributors. The customer buying the specialty connector has nowhere else to go and would pay $60 without hesitation.
Cost-plus treats these identically. Value-based pricing wouldn't.
It creates peanut butter pricing
SPARXiQ CEO David Bauders uses the term "peanut butter pricing" to describe what happens when companies spread the same markup across every product and every customer. It's the distribution industry's most common margin destroyer.
Here's how it plays out. You set a 28% markup across your catalog. Your sales team quotes commodity items at that markup and gets pushback because competitors are at 22%. The reps learn to offer discounts on those items. Now your realized margin on commodities is 20%. But your specialty and technical items still sit at 28% because nobody's pushing back. Your average margin looks fine. Your actual pricing is backwards: tight margins on the products customers care about, and "leaving money on the table" margins on the products they don't comparison-shop.
It doesn't account for cost-to-serve
A $500 order delivered to a job site 60 miles away costs you far more to fulfill than a $5,000 order picked up at your counter. Cost-plus pricing based on product cost ignores this entirely. The result: your most expensive-to-serve customers are often your least profitable, and you can't see it because the margin looks the same on paper.
It lags behind cost changes
During the 2022-2024 inflation cycle, manufacturers with pure cost-plus pricing got squeezed. Their input costs moved monthly. Their price adjustments happened quarterly, or worse, annually. That lag is pure margin erosion.
McKinsey's 2019 article "Pricing: Distributors' most powerful value-creation lever" found that distributors using undifferentiated, cost-based pricing leave 200 to 500 basis points of margin on the table. On a $75M book of business, that's $1.5M to $3.75M annually.
How to calculate cost-plus pricing correctly
If you're going to use cost-plus, at least do it right. Most companies get the "cost" part wrong, which makes the "plus" part meaningless.
Step 1: Calculate your true total cost
For distributors:
Total Unit Cost = Purchase Price + Inbound Freight + Duties + Warehousing Allocation + Handling Cost
For manufacturers:
Total Unit Cost = Direct Materials + Direct Labor + Variable Overhead + Fixed Overhead Allocation
The overhead allocation method matters. If you're using absorption costing (GAAP-compliant), all manufacturing overhead gets allocated to units produced. If volume drops, your per-unit cost rises and your cost-plus price follows. That can push you out of the market on price-sensitive items exactly when demand is softest.
Step 2: Choose your markup percentage
Markups vary by industry, product type, and competitive position. Here are typical ranges:
| Segment | Typical Markup | Resulting Gross Margin |
|---|---|---|
| Commodity distribution (fasteners, wire) | 18-28% | 15-22% |
| Standard industrial products | 28-40% | 22-29% |
| Specialty / technical products | 40-65% | 29-39% |
| Value-added services (kitting, assembly) | 55-100%+ | 35-50%+ |
| Manufacturing (standard) | 15-25% | 13-20% |
| Manufacturing (specialty/engineered) | 40-80% | 29-44% |
A common mistake: confusing markup with margin. A 25% markup does not produce a 25% gross margin. It produces a 20% gross margin.
Gross Margin % = Markup % / (1 + Markup %)
Example: 25% / 1.25 = 20% gross margin
Confusing the two means your actual margins are lower than you think. I've seen this at multiple mid-market companies where the finance team reports "25% margins" that are actually 25% markups producing 20% margins. That 5-point gap across $50M in revenue is $2.5M.
Step 3: Validate against market reality
After calculating your cost-plus price, check it against what the market will bear. If your cost-plus price on a commodity item is 15% above the competition, your sales team will discount it anyway and your "strategy" becomes fiction. If your cost-plus price on a specialty item is 20% below what customers would pay, you're handing away margin.
For a worked example with real numbers, see our cost-plus pricing example.
When cost-plus is the right strategy
Cost-plus isn't always wrong. It's the right primary approach in several situations:
Commodity products with transparent pricing. If customers can check five competitor prices in 30 seconds, your cost-plus markup needs to reflect that reality. Here, cost-plus anchored to competitive data works fine.
Government and defense contracts. Many government procurement processes require cost transparency and standardized markups. Cost-plus is built for this. The U.S. Federal Acquisition Regulation (FAR) explicitly defines cost-plus contract structures for government contracting.
New product launches. When you don't have competitive data or customer willingness-to-pay data, cost-plus gives you a starting point. Launch at cost-plus, then adjust as you learn.
Custom and engineered-to-order products. When every job has unique costs (materials, labor hours, tooling), cost-plus is the natural framework. The markup covers your overhead and profit on a per-job basis.
High-volume, low-differentiation manufacturing. If you're producing 500,000 identical widgets, your cost structure IS your competitive advantage. Cost-plus pricing aligned with manufacturing efficiency is a legitimate strategy.
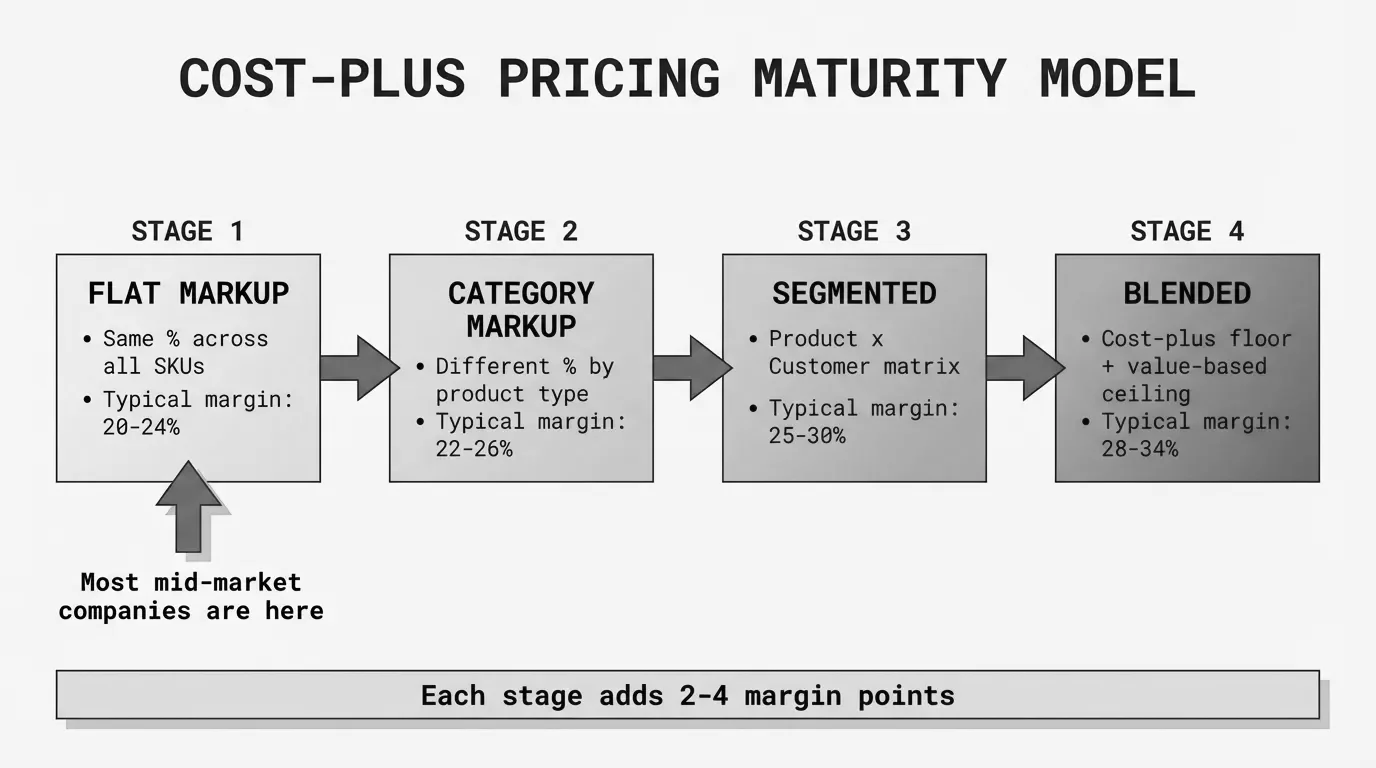
Moving from pure cost-plus to a blended strategy
Here's the practical path. You don't need to abandon cost-plus overnight. You need to layer intelligence on top of it.
Phase 1: Segment your catalog
Split your products into three tiers based on competitive visibility and differentiation:
- A items (top 20% of revenue): Competitively shopped, price-sensitive. Keep cost-plus tight here, validated against market pricing.
- B items (middle 30%): Moderate visibility. Opportunity for 3-5 points of margin improvement over flat cost-plus.
- C items (bottom 50%): Long-tail items that nobody comparison-shops. This is where you're losing the most margin with flat cost-plus. Increase markups 10-20 points.
This single change, different markups for different product tiers, is worth 100-200 basis points of margin improvement for most distributors. On $50M in revenue, that's $500K to $1M.
Phase 2: Add customer segmentation
Not every customer deserves the same markup. A strategic account buying $2M annually with growth potential gets tighter pricing than a one-time buyer ordering $500 worth of commodity items.
| A Products (high visibility) | B Products (moderate) | C Products (long tail) | |
|---|---|---|---|
| Strategic customers | Cost-plus (tight) | Cost-plus + 3-5% | Cost-plus + 8-12% |
| Core customers | Cost-plus + 2-3% | Cost-plus + 5-8% | Cost-plus + 10-15% |
| Transactional customers | Cost-plus + 4-6% | Cost-plus + 8-12% | Cost-plus + 15-25% |
This is still cost-plus at its core. You're just applying different markups to different segments instead of one number across the board.
Phase 3: Layer in value-based adjustments
For products where you provide differentiated value (technical expertise, same-day availability, kitting, custom packaging), add a value premium on top of the segmented cost-plus price. This is where you move from cost-plus to a true B2B pricing strategy.
Bain & Company's 2018 survey of over 1,700 B2B companies, published in Harvard Business Review, found that 85% of respondents believed their pricing decisions could improve. The biggest gaps weren't in having the wrong base prices. They were in price and discount structure, sales incentives, and lack of tools for tracking realized prices.
McKinsey's 2019 research found that distributors that invest in pricing capabilities see margin uplifts of 200 to 500 basis points. Most of those gains come from moving beyond flat cost-plus, not from abandoning it entirely.
Cost-plus pricing and the price waterfall
Here's what most cost-plus companies miss: your markup percentage is a starting point, not your actual margin. Between the list price you set and the cash you actually collect, there's a long list of deductions.
Take a $100 list price set at a 30% markup over your $77 cost:
| Stage | Deduction | Price |
|---|---|---|
| List price (cost-plus) | - | $100.00 |
| Volume discount (5%) | -$5.00 | $95.00 |
| Contract adjustment (3%) | -$2.85 | $92.15 |
| Invoice price | $92.15 | |
| Early payment discount (2%) | -$1.84 | $90.31 |
| Freight absorption | -$3.50 | $86.81 |
| Returns/credits (1%) | -$0.87 | $85.94 |
| Pocket price | $85.94 |
Your cost-plus markup was 30%. Your actual pocket margin is 10.4%. That's a 14-point gap between what you think you're earning and what you actually pocket.
This is why Marn, Roegner, and Zawada wrote in McKinsey's 2003 article "The Power of Pricing" (McKinsey Quarterly) that companies "can find an additional 1% or more in prices by carefully looking at what part of the list price is actually pocketed from each transaction." They described one company that improved pocket margin by 4 percentage points and operating profits by 60% within a year by addressing waterfall leakage.
Your cost-plus strategy isn't failing at the markup stage. It's failing at the pocket price stage. And you can't fix what you can't see.
Common cost-plus mistakes to avoid
Using purchase price instead of landed cost. If your $50 widget costs $4 in freight, $1 in handling, and $0.50 in warehousing, your true cost is $55.50. A 25% markup on $50 gives you $62.50. A 25% markup on $55.50 gives you $69.38. That $6.88 difference is pure margin recovery.
Applying the same markup across all product categories. We covered this above, but it bears repeating: flat markups across categories are the single biggest source of pricing-driven margin leakage in distribution.
Not updating costs frequently enough. If your cost file is updated quarterly but supplier prices change monthly, you're running on stale data. During inflationary periods, Simon-Kucher's Global Pricing Study 2025 found that 80% of companies passed cost increases to customers, but the speed of pass-through made the difference between margin protection and margin erosion.
Ignoring the markup vs. margin distinction. Finance reports margin. Sales talks markup. If they're not converting between the two correctly, your pricing targets are off. Build a conversion table and distribute it.
Setting markup targets without checking pocket realization. A 30% markup means nothing if discounts, freight absorption, and payment terms erode it to 15%. Set targets for pocket margin, not list markup.
Cost-plus pricing in the real world
Cost-plus isn't going away in distribution and manufacturing. And it shouldn't. The companies that perform best don't eliminate it. They use it as a foundation and build intelligence on top.
The path from "we use cost-plus" to "we have a pricing strategy" doesn't require enterprise software or a year-long consulting engagement. It starts with understanding what's actually happening between your markup and your pocket price.
Pryse builds that visibility in 24 hours from a CSV upload. Upload your transaction data, see your price waterfall, and find out where your cost-plus margins are really going.
For the full picture on cost-plus pricing, see our cost-plus pricing guide.
Last updated: February 1, 2026
Frequently Asked Questions

Want to analyze your entire product catalog?
Pryse automatically identifies margin leakage across thousands of SKUs. Upload your data and find hidden profit in 24 hours.
One-time $1,499 diagnostic. No subscription required.