Cost-Based Pricing Formulas: 6 Methods for Distributors and Manufacturers
Every cost-based pricing formula explained with worked examples. Covers cost-plus, markup, target-return, break-even, absorption, and marginal cost pricing.
A cost-based pricing formula calculates selling price by starting with your costs and adding a profit component. It's the most widely used pricing method in distribution and manufacturing because it guarantees a minimum margin on every transaction and scales across large product catalogs.
There are six distinct cost-based formulas. Each starts from cost, but they differ in which costs they include, how they calculate the profit component, and what business question they answer. The most common is cost-plus pricing, but it's not the only option, and using the wrong formula for the situation leaves money on the table.
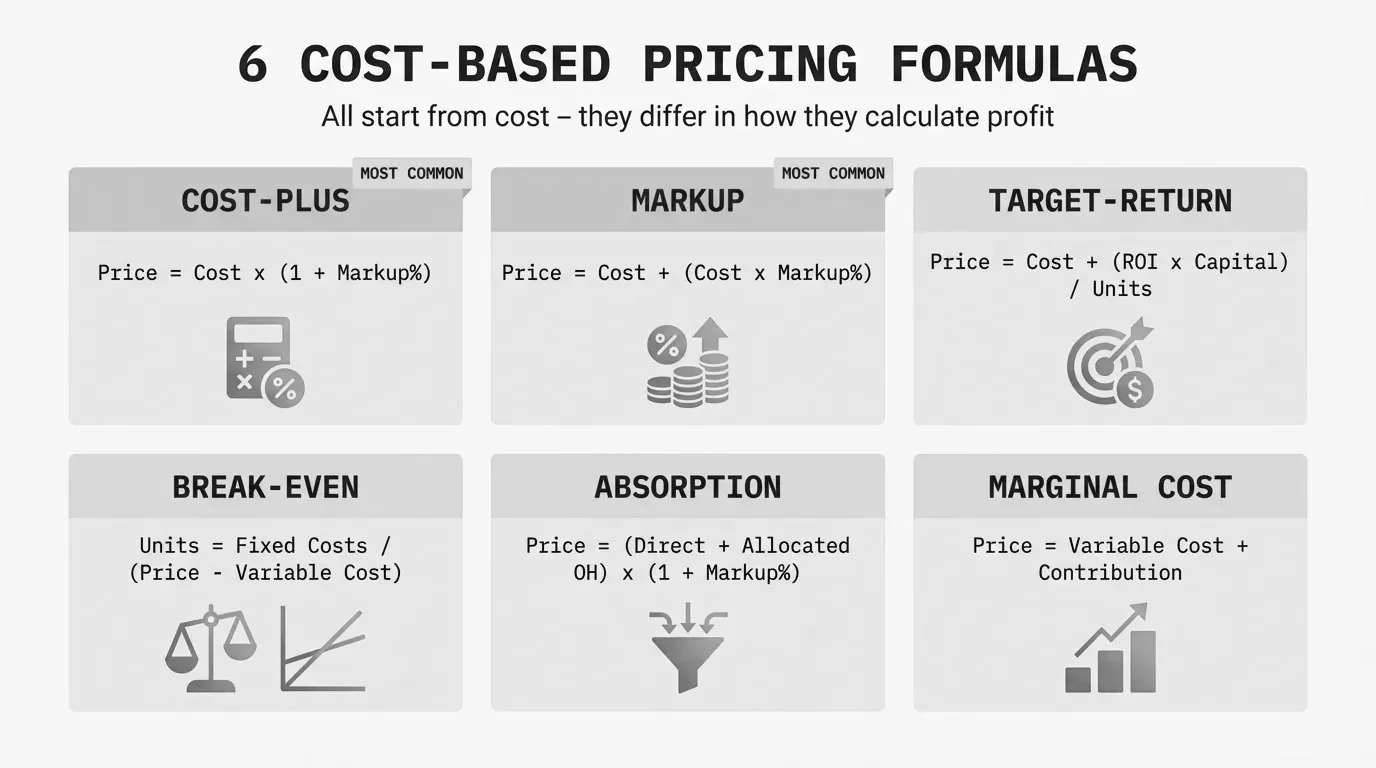
Here are all six, with the math, worked examples, and when each one fits.
1. Cost-plus pricing formula
Cost-plus pricing is the default in distribution. You take your unit cost and add a fixed percentage markup.
Selling Price = Unit Cost x (1 + Markup %)Worked example: An electrical distributor buys a circuit breaker for $48. Their standard markup for that product category is 30%.
Selling Price = $48 x (1 + 0.30)
Selling Price = $48 x 1.30
Selling Price = $62.40
Gross profit per unit: $14.40. Gross margin: 23.1%.
When to use it: Commodity products with stable costs. Large catalogs where you need a systematic approach across 10,000+ SKUs. As a pricing floor that you layer competitive and value-based adjustments on top of.
The limitation: A flat 30% markup treats a $2 fastener and a $200 specialty valve identically. Your customers aren't price-shopping both the same way. For a deeper look at this formula specifically, see our cost-plus pricing formula breakdown.
2. Markup pricing formula
Markup pricing looks identical to cost-plus at first glance, but the distinction matters when you're working backward from a target margin. Markup is calculated on cost. Margin is calculated on selling price. Confusing the two is one of the most common pricing errors in distribution.
Markup % = (Selling Price - Cost) / Cost x 100
Margin % = (Selling Price - Cost) / Selling Price x 100
Worked example: A plumbing supply distributor sells a valve for $75. Their cost is $50.
Markup = ($75 - $50) / $50 x 100 = 50%
Margin = ($75 - $50) / $75 x 100 = 33.3%
Same dollar profit ($25), but 50% markup vs. 33.3% margin. If your ERP is set to target "30% margin" and someone enters it as "30% markup," you'll be pricing too low on every line item. On a $50 product, that's selling at $65 (30% markup) instead of $71.43 (30% margin). Across 50,000 SKUs, that mistake compounds fast.
Markup-to-margin conversion table
This table belongs on the wall of every pricing manager's office. For the underlying math, see our gross margin formula guide.
| Markup % | Margin % | Multiplier |
|---|---|---|
| 10% | 9.1% | 1.10x |
| 15% | 13.0% | 1.15x |
| 20% | 16.7% | 1.20x |
| 25% | 20.0% | 1.25x |
| 30% | 23.1% | 1.30x |
| 35% | 25.9% | 1.35x |
| 40% | 28.6% | 1.40x |
| 50% | 33.3% | 1.50x |
| 60% | 37.5% | 1.60x |
| 75% | 42.9% | 1.75x |
| 100% | 50.0% | 2.00x |
The conversion formulas:
Margin % = Markup % / (1 + Markup %)
Markup % = Margin % / (1 - Margin %)
When to use it: Whenever you're communicating pricing internally. Standardize on one metric (most finance teams prefer margin, most purchasing teams think in markup) and make sure everyone knows which one the system uses.
3. Target-return pricing formula
Target-return pricing works backward from a desired return on investment. Instead of asking "what markup should I apply?", it asks "what price do I need to hit my ROI target?"
Price = Unit Cost + (Desired Return x Invested Capital) / Expected Unit SalesWorked example: A fastener manufacturer invests $2M in a new production line. Unit cost is $1.80. They want a 15% annual return on that investment and project 500,000 units per year.
Price = $1.80 + (0.15 x $2,000,000) / 500,000
Price = $1.80 + $300,000 / 500,000
Price = $1.80 + $0.60
Price = $2.40
At $2.40 per unit and 500,000 units sold, the line generates $300,000 in profit above cost, which is the 15% return on the $2M investment.
When to use it: Capital-intensive manufacturing where specific equipment or lines need to generate defined returns. New product launches where you've made a significant upfront investment. Private-label programs where you're investing in tooling or molds for a distributor's exclusive product.
The limitation: The formula assumes you'll actually sell 500,000 units. If volume comes in at 350,000, your return drops to 10.5% at the same price, or you need to raise prices to $2.66 to hit 15%. Target-return pricing requires realistic volume projections, which many companies are bad at.
4. Break-even pricing formula
Break-even pricing determines the minimum price needed to cover all costs at a given sales volume. It doesn't include profit. It tells you the floor below which you're losing money.
Break-Even Price = Variable Cost per Unit + (Total Fixed Costs / Projected Unit Sales)Worked example: A building materials distributor is evaluating a new product line. Fixed costs for the line (warehousing, dedicated sales rep, marketing) are $120,000/year. Variable cost per unit (landed cost + handling) is $22. They project 8,000 units in year one.
Break-Even Price = $22 + ($120,000 / 8,000)
Break-Even Price = $22 + $15
Break-Even Price = $37
Any price above $37 generates profit. At $45 (a common price point for this category), the margin per unit is $8, generating $64,000 in annual profit on the line.
The break-even volume at that $45 price:
Break-Even Units = Fixed Costs / (Price - Variable Cost)
Break-Even Units = $120,000 / ($45 - $22)
Break-Even Units = $120,000 / $23
Break-Even Units = 5,218 units
When to use it: New product line evaluations. Minimum order quantity decisions. Deciding whether to accept a large contract at a reduced price. Setting freight thresholds (should we offer free shipping on orders above $X?).
The limitation: Break-even analysis doesn't tell you what the market will pay. Knowing you need to sell 5,218 units at $37 says nothing about whether 5,218 customers exist at that price. Always pair break-even pricing with market reality.
5. Absorption cost pricing formula
Absorption cost pricing (also called full-cost pricing) allocates all manufacturing costs to each unit, including fixed overhead. It's the most comprehensive cost-based method and the one required under GAAP and IFRS for financial reporting.
Full Cost per Unit = Direct Materials + Direct Labor + Variable Overhead + (Fixed Overhead / Units Produced)
Selling Price = Full Cost per Unit x (1 + Markup %)
Worked example: A mid-size manufacturer produces industrial fittings. Per-unit costs:
- Direct materials: $12.00
- Direct labor: $8.50
- Variable overhead (utilities, supplies): $3.50
- Fixed overhead (rent, depreciation, insurance): $450,000/year
- Annual production: 100,000 units
Full Cost per Unit = $12.00 + $8.50 + $3.50 + ($450,000 / 100,000)
Full Cost per Unit = $24.00 + $4.50
Full Cost per Unit = $28.50
Selling Price at 25% markup = $28.50 x 1.25 = $35.63
When to use it: Manufacturers setting long-term pricing. Private-label production for distribution partners. Any situation where you need to recover full overhead to maintain profitability.
The limitation: Absorption pricing is sensitive to production volume. If that manufacturer runs at 70,000 units instead of 100,000, the fixed overhead allocation jumps from $4.50 to $6.43 per unit. Full cost becomes $30.43, and at the same $35.63 selling price, margin compresses from 20% to 14.6%. This is why manufacturers with volatile demand often struggle with pure absorption pricing.
For practical examples of each formula in action, see our cost-based pricing examples article.
6. Marginal cost pricing formula
Marginal cost pricing sets the price based on the variable cost of producing one additional unit, ignoring fixed costs entirely. It's the opposite of absorption pricing.
Marginal Cost = Change in Total Cost / Change in Quantity
Minimum Price = Variable Cost per Unit
Contribution Margin = Selling Price - Variable Cost per Unit
Worked example: An HVAC components manufacturer has capacity for 100,000 units but is running at 75,000. A distributor offers to buy 10,000 units at $18 each. The variable cost per unit is $14. Normal selling price is $32 (based on full absorption cost of $24 plus 33% markup).
Should they accept?
Contribution per unit = $18 - $14 = $4
Total contribution = $4 x 10,000 = $40,000
The $18 price is well below the normal $32, but it covers variable costs and contributes $40,000 toward fixed costs that are already being paid whether the capacity is used or not.
When to use it: Fill-in orders when you have excess capacity. Export markets where you want to cover incremental costs. Short-term deals to prevent capacity from sitting idle.
When to avoid it: As a long-term pricing strategy. If marginal-cost-priced orders cannibalize full-price business. When fixed costs aren't already covered by your core volume. Simon-Kucher, in their analysis "Accounting for Costs: What Is Marginal Cost Pricing?", warns that marginal cost pricing is far from the most profitable strategy and should only be applied in specific circumstances, not as a default approach.
Summary: all six cost-based pricing formulas
| Formula | Equation | Best For | Risk |
|---|---|---|---|
| Cost-plus | Unit Cost x (1 + Markup %) | Day-to-day catalog pricing | Ignores willingness to pay |
| Markup/Margin | (Price - Cost) / Cost or Price | Internal alignment, ERP setup | Markup/margin confusion |
| Target-return | Unit Cost + (Return x Capital) / Units | Capital investment decisions | Volume dependency |
| Break-even | Variable Cost + (Fixed Costs / Units) | New line evaluation, go/no-go | Ignores demand |
| Absorption | Full Cost per Unit x (1 + Markup %) | Manufactured products, GAAP | Volume sensitivity |
| Marginal cost | Variable Cost + Contribution | Excess capacity, fill-in orders | Unsustainable long-term |
Which formula to use when
If you're a distributor managing a catalog of thousands of SKUs, cost-plus is your starting point. It's the only formula that scales across a large portfolio without requiring per-item analysis. Layer target-return calculations on top for strategic product lines, and use break-even analysis when evaluating whether to take on new suppliers or product categories.
If you're a manufacturer, absorption cost pricing is your foundation for any product you make. It's what your accountants use for financial reporting and what ensures you're recovering overhead. Use marginal cost pricing selectively for incremental volume that doesn't compete with full-price channels.
Either way, cost-based formulas give you the floor, not the ceiling. According to McKinsey's 2003 article "The Power of Pricing" in The McKinsey Quarterly, a 1% price improvement generates an 8% increase in operating profits for the average S&P 1500 company. That gap between cost-based floor and market ceiling is where the real margin lives.
The companies that capture it use cost-based pricing as a starting point, then add competitive and value-based adjustments based on customer segment, product category, and competitive dynamics. For a $75M distributor, closing even a fraction of that gap can mean $500K+ in annual profit improvement without changing a single customer or product.
Pryse identifies where your realized prices deviate from your cost-based targets across every product-customer combination, in 24 hours from a CSV upload. No six-month implementation. No $100K platform. Just visibility into where your margins actually go.
Last updated: February 1, 2026
Frequently Asked Questions

Want to analyze your entire product catalog?
Pryse automatically identifies margin leakage across thousands of SKUs. Upload your data and find hidden profit in 24 hours.
One-time $1,499 diagnostic. No subscription required.