Markup to Margin Calculator: Convert Between Markup and Margin
Convert markup percentage to margin percentage with formulas and a conversion table. Learn why 50% markup equals only 33.3% margin.
Markup and margin are not the same thing. A 50% markup produces only a 33.3% margin. Confusing these two numbers leads to pricing mistakes that cost real money.
Markup is profit as a percentage of cost. Margin is profit as a percentage of selling price.
Here's how to convert between them.
Markup to Margin Formula
To convert markup percentage to margin percentage:
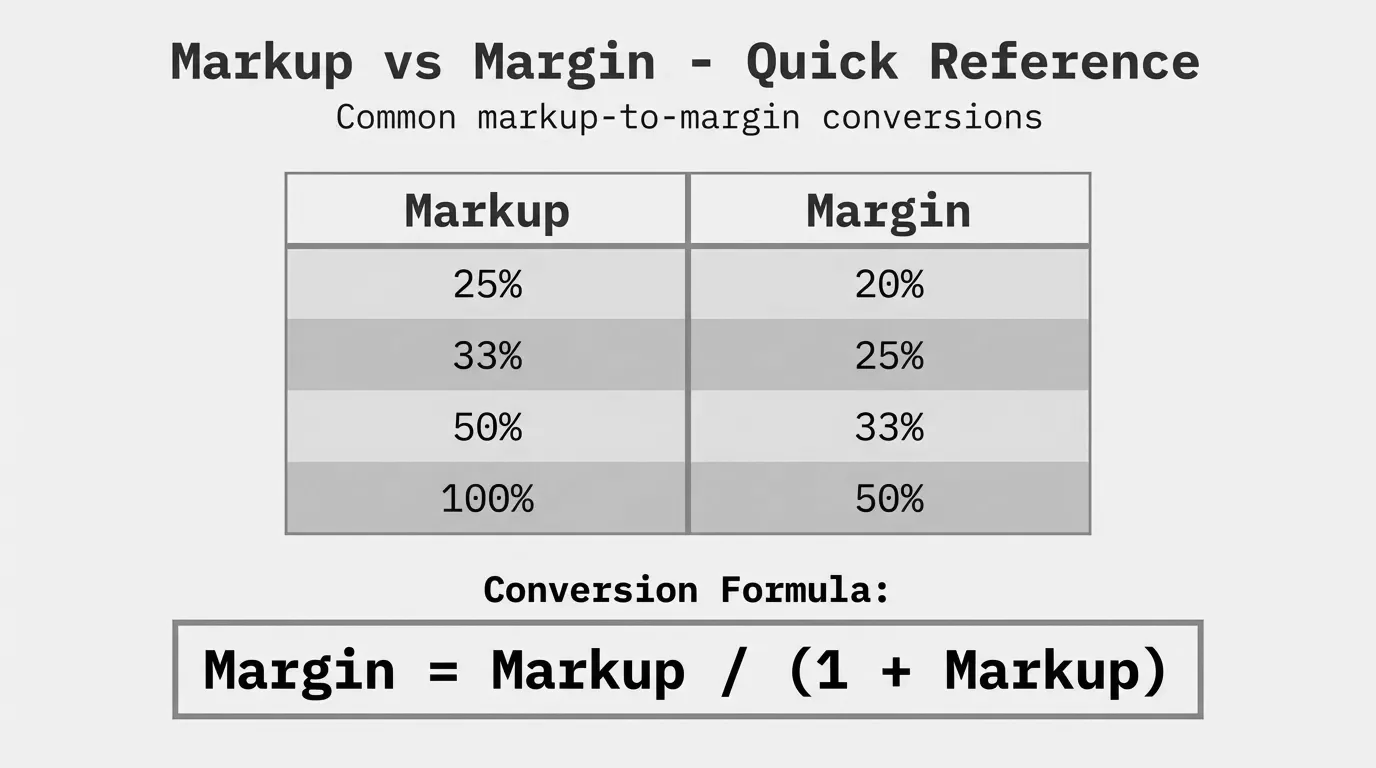
Margin % = Markup % / (100% + Markup %)Or expressed as decimals:
Margin = Markup / (1 + Markup)Example: Convert 40% markup to margin.
40 / (100 + 40) = 40 / 140 = 0.286 = 28.6%A 40% markup gives you a 28.6% margin—not 40%.
Margin to Markup Formula
To convert margin percentage to markup percentage:
Markup % = Margin % / (100% - Margin %)Or in decimals:
Markup = Margin / (1 - Margin)Example: What markup do you need for a 35% margin?
35 / (100 - 35) = 35 / 65 = 0.538 = 53.8%To achieve a 35% margin, you need a 53.8% markup on cost.
Markup to Margin Conversion Table
This table shows common markup percentages and their margin equivalents:
| Markup % | Margin % | Multiplier |
|---|---|---|
| 10% | 9.1% | 1.10 |
| 15% | 13.0% | 1.15 |
| 20% | 16.7% | 1.20 |
| 25% | 20.0% | 1.25 |
| 30% | 23.1% | 1.30 |
| 33.3% | 25.0% | 1.33 |
| 40% | 28.6% | 1.40 |
| 50% | 33.3% | 1.50 |
| 60% | 37.5% | 1.60 |
| 75% | 42.9% | 1.75 |
| 100% | 50.0% | 2.00 |
The multiplier is what you multiply your cost by to get the selling price. A 1.50 multiplier means you mark up by 50%.
Notice the pattern: markup percentages are always higher than their equivalent margins. This trips up a lot of pricing teams.
Why the Numbers Don't Match
Markup and margin use different denominators for the same profit dollars.
Markup divides profit by cost (the smaller number). Margin divides profit by selling price (the larger number).
Take a product that costs $80 and sells for $100:
- Profit = $20
- Markup = $20 / $80 = 25%
- Margin = $20 / $100 = 20%
Same $20 profit. Different percentages because of different bases.
This is why a 50% markup sounds impressive but only delivers a 33.3% margin. The markup percentage is inflated because it's calculated from the smaller cost base.
Step-by-Step Calculation Examples
Example 1: Converting Markup to Margin
A distributor marks up products by 35%. What's the actual margin?
Step 1: Identify the markup percentage = 35%
Step 2: Apply the formula
Margin = 35 / (100 + 35) = 35 / 135 = 0.259Step 3: Convert to percentage = 25.9%
The 35% markup produces a 25.9% margin.
Example 2: Finding Required Markup for Target Margin
A manufacturer needs a 40% margin to cover costs and profit goals. What markup should they use?
Step 1: Identify the target margin = 40%
Step 2: Apply the formula
Markup = 40 / (100 - 40) = 40 / 60 = 0.667Step 3: Convert to percentage = 66.7%
They need to mark up products by 66.7% to achieve a 40% margin.
Example 3: Verifying the Math
Let's confirm Example 2 with actual numbers.
- Cost: $60
- Markup: 66.7% of $60 = $40
- Selling Price: $60 + $40 = $100
- Margin: $40 / $100 = 40%
The 66.7% markup on $60 cost produces exactly 40% margin on the $100 selling price.
Common Markup-Margin Mistakes
Mistake 1: Assuming They're Interchangeable
When someone says "we work on 30% margins," verify whether they mean markup or margin. A business that thinks it operates at 30% margin but actually uses 30% markup is making 23.1% margin—a 7-point gap.
Mistake 2: Using the Wrong One in Formulas
If your pricing formula expects margin but you input markup (or vice versa), every price comes out wrong. This compounds across thousands of SKUs.
Mistake 3: Inconsistent Use Across Teams
Sales talks in markup. Finance talks in margin. Neither realizes they're speaking different languages. A "25% deal" means something different to each group.
The fix: Pick one standard (margin is more common in finance) and convert the other when communicating.
When to Use Markup vs. Margin
Use markup when:
- Setting prices from cost
- Communicating with purchasing or supply chain
- Calculating quick price estimates in the field
Use margin when:
- Reporting to finance or leadership
- Comparing against industry benchmarks
- Analyzing profitability across products
- Evaluating deals and discounts
Most financial analysis uses margin because it shows what percentage of revenue turns into profit. Markup is more common in day-to-day pricing operations because it's a direct multiplier on cost.
Margin Stacking: Another Hidden Gap
When you apply multiple markups, the effect isn't additive.
Say you buy at $100, add 20% for overhead ($120), then add 20% for profit ($144).
Total markup on cost: ($144 - $100) / $100 = 44%
But your margin: ($144 - $100) / $144 = 30.6%
You applied "40% in markups" but ended up with only 30.6% margin. Markup percentages compound; margin doesn't work the same way.
This trips up distribution companies that layer markups at different stages—purchasing markup, warehouse markup, sales markup—then wonder why overall margins don't match expectations.
The Real-World Impact
For a $50M distributor, confusing markup and margin by just 5 points represents $2.5M in annual profit difference. At scale, this isn't a rounding error.
We've seen companies discover their "30% margin" business was actually running at 23% when they finally did the math correctly. That's the kind of gap that shows up in cash flow, loan covenants, and exit multiples.
Getting markup and margin right is pricing fundamentals. It's worth spending 10 minutes with a calculator to verify which one your team actually uses—and whether everyone agrees.
Next Steps
Understanding the conversion between markup and margin is one piece of margin analysis. For a complete view of how margin flows through your business—from list price to pocket price to actual profit—see our complete guide to margin analysis.
If you're managing pricing in Excel and want to see your actual margins across thousands of SKUs and customers, Pryse automates the analysis that would take weeks to do manually.
Last updated: January 20, 2026
Frequently Asked Questions

Want to analyze your entire product catalog?
Pryse automatically identifies margin leakage across thousands of SKUs. Upload your data and find hidden profit in 24 hours.
One-time $1,499 diagnostic. No subscription required.