Manufacturer Profit Margin: Benchmarks, Formulas, and Improvement Strategies
Learn typical profit margins for manufacturing companies by sub-industry. Includes benchmarks for gross, operating, and net margins plus strategies to improve them.
Manufacturer profit margin is the percentage of revenue remaining as profit after subtracting production and operating costs. For manufacturing companies, this metric reflects pricing power, operational efficiency, and competitive positioning.
Manufacturer Profit Margin = (Revenue - Total Costs) / Revenue x 100Manufacturing margins differ from distribution or services because the cost structure is fundamentally different. A manufacturer buying raw steel at $800 per ton, converting it to finished parts, and selling at $2,400 faces cost dynamics that a distributor reselling the same parts at $2,800 does not.
This guide covers typical margins by manufacturing sub-industry, the factors that drive those margins, and practical strategies for improvement.
The Three Margin Types for Manufacturers
Manufacturing companies track three margin levels, each measuring profitability at a different stage.
Gross Margin
Gross margin measures what remains after subtracting direct production costs from revenue.
Gross Margin = (Revenue - Cost of Goods Sold) / Revenue x 100For a manufacturer, COGS includes:
- Raw materials and components
- Direct labor (wages for production workers)
- Manufacturing overhead (factory rent, equipment depreciation, utilities for production)
A $10 million revenue manufacturer with $6.5 million in COGS has a 35% gross margin. That $3.5 million covers everything else: sales, admin, R&D, interest, and profit.
Operating Margin
Operating margin goes further by subtracting operating expenses from gross profit.
Operating Margin = (Gross Profit - Operating Expenses) / Revenue x 100Operating expenses include sales staff, marketing, administrative functions, R&D, and general overhead not directly tied to production.
The same $10 million manufacturer with 35% gross margin and $2 million in operating expenses has:
Operating Margin = ($3.5M - $2M) / $10M = 15%Operating margin reflects management effectiveness. Two manufacturers with identical gross margins can have very different operating margins based on how they run non-production functions.
Net Profit Margin
Net margin is the bottom line after all costs including interest and taxes.
Net Margin = Net Profit / Revenue x 100A manufacturer running 15% operating margin might net 9% after $300K in interest on equipment financing and $300K in corporate taxes. Net margin is what owners can reinvest, distribute, or use for debt service.
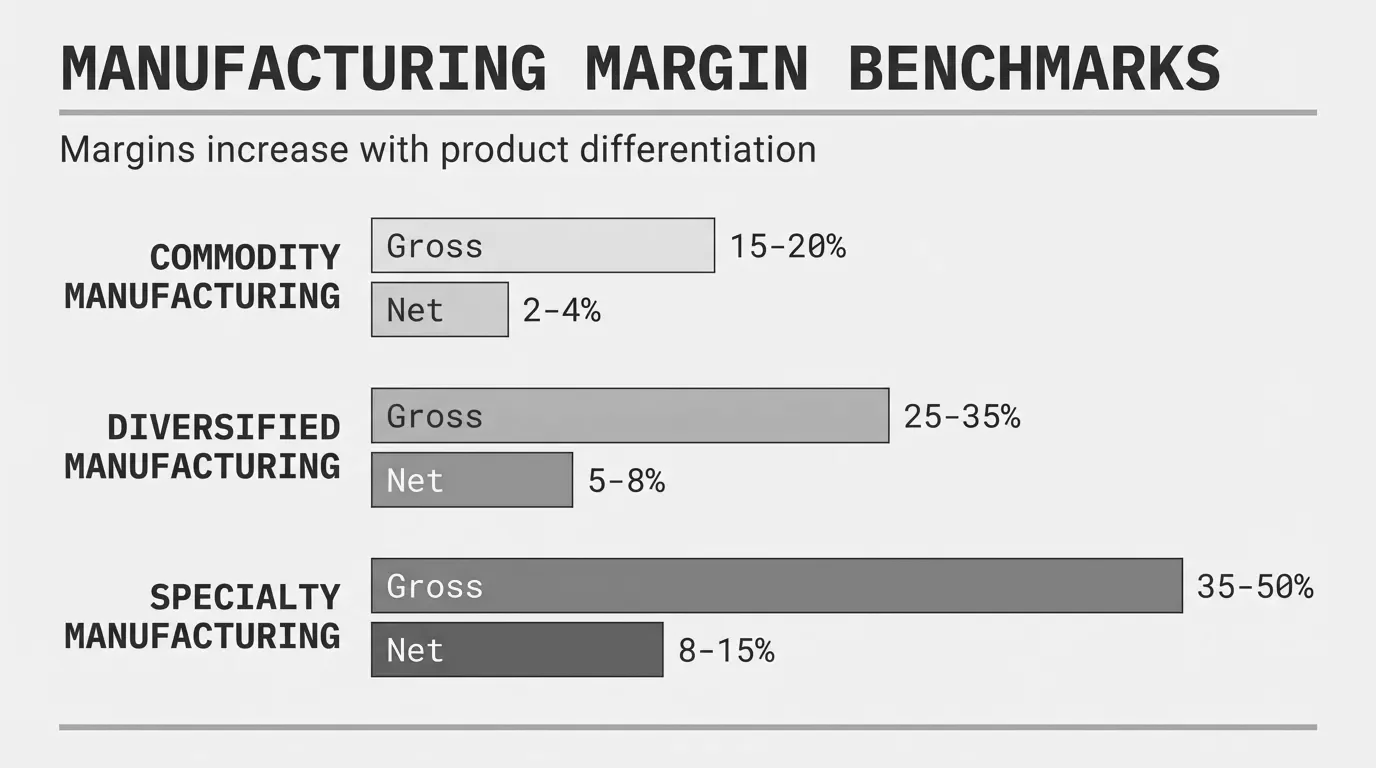
Manufacturing Margin Benchmarks by Industry Type
Manufacturing is not one industry. A semiconductor fabricator operates differently than a metal stamping shop, which operates differently than a food processor. Benchmarks must account for these differences.
| Manufacturing Type | Gross Margin | Operating Margin | Net Margin |
|---|---|---|---|
| Commodity | 18-25% | 5-8% | 3-5% |
| Diversified | 28-35% | 10-15% | 6-10% |
| Specialty | 38-50% | 15-22% | 10-15% |
Commodity Manufacturing
Commodity manufacturers produce standardized products where buyers can easily switch suppliers. Examples include basic chemicals, standard fasteners, commodity steel products, and undifferentiated components.
Margin profile: Gross margins of 18-25%, operating margins of 5-8%, net margins of 3-5%.
Why margins are thin: Little pricing power. Customers choose based on price, delivery, and basic quality specs. Cost leadership matters more than differentiation. Volume is the path to profitability.
A $45M fastener manufacturer producing standard bolts and screws might run 22% gross margin and 6% operating margin. At those levels, a 2% cost increase not passed through drops operating margin by a third.
Diversified Manufacturing
Diversified manufacturers produce a range of products across multiple categories, often serving several end markets. Examples include industrial equipment makers, multi-line component manufacturers, and mid-market OEM suppliers.
Margin profile: Gross margins of 28-35%, operating margins of 10-15%, net margins of 6-10%.
Why margins are moderate: Product variety creates some differentiation. Customer relationships and application knowledge matter. Competition exists but is not purely price-based.
A $75M industrial equipment manufacturer serving food processing, pharmaceutical, and chemical industries might achieve 32% gross margin and 12% operating margin. The product range spreads risk but also requires investment in multiple engineering and sales capabilities.
Specialty Manufacturing
Specialty manufacturers produce differentiated products where technical capability, intellectual property, or specialized expertise creates barriers to competition. Examples include aerospace components, medical devices, precision instruments, and custom engineered products.
Margin profile: Gross margins of 38-50%, operating margins of 15-22%, net margins of 10-15%.
Why margins are strong: Customers pay for capability they cannot easily replicate. Switching costs are high. Technical barriers protect pricing. Volume is typically lower but margins are higher.
A $30M medical device manufacturer might run 45% gross margin and 18% operating margin. The tradeoff: regulatory requirements, qualification costs, and longer sales cycles.
Sub-Industry Margin Benchmarks
Within these broad categories, specific sub-industries have their own ranges. NYU Stern maintains updated data on public company margins. Here are typical figures:
| Sub-Industry | Gross Margin | Operating Margin | Net Margin |
|---|---|---|---|
| Auto components | 18-24% | 5-9% | 3-6% |
| Chemicals (basic) | 22-28% | 8-12% | 5-8% |
| Chemicals (specialty) | 35-45% | 14-20% | 9-14% |
| Electrical equipment | 28-35% | 10-15% | 6-10% |
| Food processing | 20-28% | 6-10% | 4-7% |
| Industrial machinery | 30-38% | 10-16% | 7-11% |
| Metal fabrication | 22-30% | 6-12% | 4-8% |
| Pharmaceuticals | 65-75% | 20-30% | 15-25% |
| Plastics and rubber | 22-30% | 7-12% | 4-8% |
| Semiconductors | 45-55% | 20-30% | 15-25% |
These figures represent ranges for established companies. Smaller manufacturers, early-stage companies, or those in turnaround situations may fall outside these ranges.
What Drives Manufacturing Margins
Six factors explain most margin variation across manufacturing companies.
Capacity Utilization
Manufacturing has high fixed costs. Running at 90% capacity versus 60% capacity dramatically changes unit economics.
Consider a manufacturer with $3 million in annual fixed costs (facility, equipment depreciation, salaried staff). At 60% utilization producing 600,000 units, fixed cost per unit is $5.00. At 90% utilization producing 900,000 units, fixed cost per unit drops to $3.33.
Fixed cost per unit at 60% utilization: $3,000,000 / 600,000 = $5.00
Fixed cost per unit at 90% utilization: $3,000,000 / 900,000 = $3.33
Margin impact: $1.67 per unit
On a product selling at $25, that $1.67 difference represents nearly 7 points of margin.
Volume matters in manufacturing. Facilities designed for growth that never comes destroy margins. Conversely, running near capacity creates leverage that drops straight to profit.
Bill of Materials Complexity
The number of components and their cost volatility affects margin stability.
A simple product with three components from domestic suppliers has predictable costs. A complex assembly with 150 components, some from international suppliers with lead times of 16 weeks, faces cost surprises.
BOM complexity creates margin risk through:
- Material cost changes at different rates for different components
- Obsolescence and engineering change orders
- Quality issues in the supply chain
- Minimum order quantities forcing excess inventory
A $50M precision equipment manufacturer found that 40% of their margin variance came from just 15% of their components. Those components had volatile pricing and long lead times. Locking in pricing through contracts or forward purchases stabilized margins.
Labor Efficiency
Direct labor as a percentage of COGS varies by manufacturing type:
| Manufacturing Type | Direct Labor as % of COGS |
|---|---|
| Highly automated | 5-10% |
| Semi-automated | 15-25% |
| Labor-intensive | 30-50% |
For labor-intensive manufacturers, productivity directly impacts margins. A production line running 85 units per hour versus 100 units per hour has 15% higher labor cost per unit.
Labor efficiency levers include:
- Training and skill development
- Process standardization
- Equipment maintenance (downtime kills productivity)
- Scheduling optimization
- Incentive alignment
A $35M contract manufacturer running three shifts tracked productivity by shift. The day shift averaged 94 units per hour, swing shift 87, and night shift 78. Addressing night shift issues (supervision, equipment maintenance, break scheduling) brought productivity to 89, worth $180K annually in labor cost reduction.
Product Mix
Not all products carry the same margin. A shift in what customers buy affects overall profitability even if individual product margins stay constant.
A manufacturer with this product portfolio:
| Product Line | Revenue Share | Gross Margin |
|---|---|---|
| Standard products | 50% | 28% |
| Custom products | 30% | 38% |
| Engineered solutions | 20% | 48% |
Blended gross margin: (0.50 x 28%) + (0.30 x 38%) + (0.20 x 48%) = 34%
If mix shifts to 60% standard, 25% custom, and 15% engineered:
New blended margin: (0.60 x 28%) + (0.25 x 38%) + (0.15 x 48%) = 33.5%
A half-point drop from mix alone. Over a year on $40M in revenue, that is $200K in margin.
Product mix shifts happen because:
- Customers trade down in tight economies
- Sales incentives favor volume over margin
- High-margin products face new competition
- Standard products are easier to sell
Pricing Discipline
Manufacturers often underprice. The causes are familiar: pressure from large customers, competitive fears, cost-plus habits that ignore value, and lack of transaction-level margin visibility.
McKinsey research indicates that a 1% improvement in price drops directly to the bottom line. For a manufacturer running 10% net margin, a 1% price improvement increases profit by 10%.
Common pricing failures in manufacturing:
- Legacy pricing for customers whose volume declined
- Quoting standard prices for custom work
- Not passing through material cost increases
- Uniform pricing that ignores customer value or cost-to-serve
- Discounting to win orders without margin guardrails
A $28M metal fabrication company analyzed 2,400 quotes from the previous year. Win rates were nearly identical at full price (31%) versus discounted 10%+ (34%). They had been giving away margin without winning more business.
Operational Efficiency
Beyond labor, operational efficiency encompasses scrap, rework, yield, energy usage, and process waste.
Scrap and rework directly consume margin. A process running 4% scrap rate means 4% of material cost is wasted. If materials are 45% of COGS and you eliminate half that scrap, you recover 0.9% of COGS.
Yield losses accumulate through multi-step processes. A five-step process running 97% yield at each step has overall yield of 0.97^5 = 85.9%. Improving each step to 98.5% raises overall yield to 92.7%, nearly 7 points of improvement.
Strategies for Improving Manufacturing Margins
Margin improvement falls into two categories: getting more for what you sell (pricing) and spending less to make it (costs).
Pricing Strategies
Pass through input cost increases systematically. Material costs change. Manufacturers who track these changes and adjust prices accordingly maintain margins. Those who do not erode them.
Create a formal process: track key input costs monthly, set thresholds that trigger price reviews (5% change, for example), communicate increases to customers with data supporting the change.
Implement value-based pricing for differentiated products. Cost-plus pricing leaves money on the table when customers value your product beyond its production cost. An engineered solution that saves a customer $100K annually is worth more than standard cost-plus 25%.
This requires understanding customer applications and willingness to pay. It is harder than cost-plus but more profitable.
Price for services that add value. Engineering support, technical service, rapid prototyping, inventory management, and quality documentation all have value. Pricing them separately or building them into premium pricing tiers captures margin that bundled pricing gives away.
Establish pricing guardrails. Define minimum acceptable margins by product category. Require approval for exceptions. Track exceptions and patterns. A manufacturer allowing 50 "exception" deals per quarter at below-target margins has a pricing process problem, not 50 special situations.
Cost Strategies
Optimize capacity utilization. Fill unused capacity with profitable volume. This might mean entering new markets, adding customers in adjacent industries, or offering contract manufacturing services. The marginal cost of additional volume is well below average cost.
Reduce BOM costs through sourcing. Review supplier contracts, consolidate purchases for volume leverage, evaluate alternative materials, and consider geographic sourcing options. A 3% reduction in material costs at 50% material content means 1.5% margin improvement.
Attack scrap and rework root causes. Track defects by type, source, and cost. Apply the 80/20 rule: a few causes usually drive most of the waste. A $22M plastics manufacturer found that 65% of scrap came from three mold issues. Fixing those issues reduced overall scrap from 5.2% to 2.8%.
Automate where the math works. Calculate payback on automation investments using fully-loaded labor costs, including benefits, turnover, training, and supervision. A $180K automation investment that replaces $75K in annual labor cost (including overhead) pays back in under three years.
Manage product portfolio actively. SKU rationalization identifies products that lose money, consume capacity, and distract from profitable items. A typical SKU analysis reveals 20-30% of products generating minimal or negative contribution. Pruning the portfolio improves margin and simplifies operations.
See our complete guide to margin analysis for detailed methods on product and customer profitability analysis.
Operating Expense Strategies
Right-size overhead to revenue. Manufacturing companies sometimes carry administrative costs built for larger operations or different competitive environments. Review SG&A periodically. Benchmark against industry peers.
Invest in systems that improve visibility. Manufacturers making decisions without accurate margin data make expensive mistakes. Better costing systems, ERP utilization, and analytics tools often pay for themselves through improved decisions.
Align incentives with margin, not just revenue. Sales teams compensated on revenue alone will sell low-margin products to easy customers. Including margin in compensation changes behavior.
Margin Analysis for Manufacturing: What to Track
Manufacturers should track margins at multiple levels:
Company-wide: Monthly gross, operating, and net margins. Trend over time. Variance from budget.
By product family: Which categories exceed targets? Which fall short? Where is mix shifting?
By customer: Are large accounts actually profitable? Which customers generate margin versus consume it?
By order type: Standard orders versus custom orders versus rush orders. Each has different cost profiles.
Against standard cost: Variance analysis showing where actual costs differ from standards. Identifies process issues and costing errors.
For manufacturers in the $20M-$200M range, this analysis often reveals 2-5 points of recoverable margin through pricing adjustments, cost reduction, and portfolio optimization.
The Bottom Line
Manufacturing margins depend on industry type, operational execution, and pricing discipline. Commodity manufacturers compete on cost and run thin. Specialty manufacturers with differentiated products command premiums.
The levers are consistent: maximize capacity utilization, control input costs, maintain pricing discipline, manage product mix, and operate efficiently. Manufacturers who track margins at a granular level and act on the data outperform those who look only at monthly P&L totals.
A 1% margin improvement on $50 million in revenue is $500K straight to profit. For most manufacturers, that is achievable through better visibility into where margins actually come from and where they leak away.
For the complete picture of margin analysis methods, including customer profitability and price waterfall analysis, see our complete guide to margin analysis.
Last updated: Invalid Date
Frequently Asked Questions

Want to analyze your entire product catalog?
Pryse automatically identifies margin leakage across thousands of SKUs. Upload your data and find hidden profit in 24 hours.
One-time $1,499 diagnostic. No subscription required.