Wholesale Profit Margins by Industry: Benchmarks and What Drives Them
Compare wholesale profit margins across food, apparel, electronics, industrial, and building materials. Gross and net margin benchmarks with the factors that move them.
Wholesale profit margin is the percentage of revenue remaining after subtracting the cost of goods sold. For distributors, this margin funds operations, covers overhead, and generates profit.
Wholesale Gross Margin = (Revenue - Cost of Goods Sold) / Revenue x 100Wholesale margins vary significantly by industry. A food distributor and an apparel wholesaler operate in different worlds. The food distributor might run at 18% gross margin with 8 inventory turns per year. The apparel wholesaler hits 40% gross margin but turns inventory twice. Both can be profitable, but for different reasons.
This guide breaks down wholesale profit margins by industry vertical, explains the difference between gross and net margins in distribution, and covers the factors that separate high-margin wholesalers from those barely breaking even.
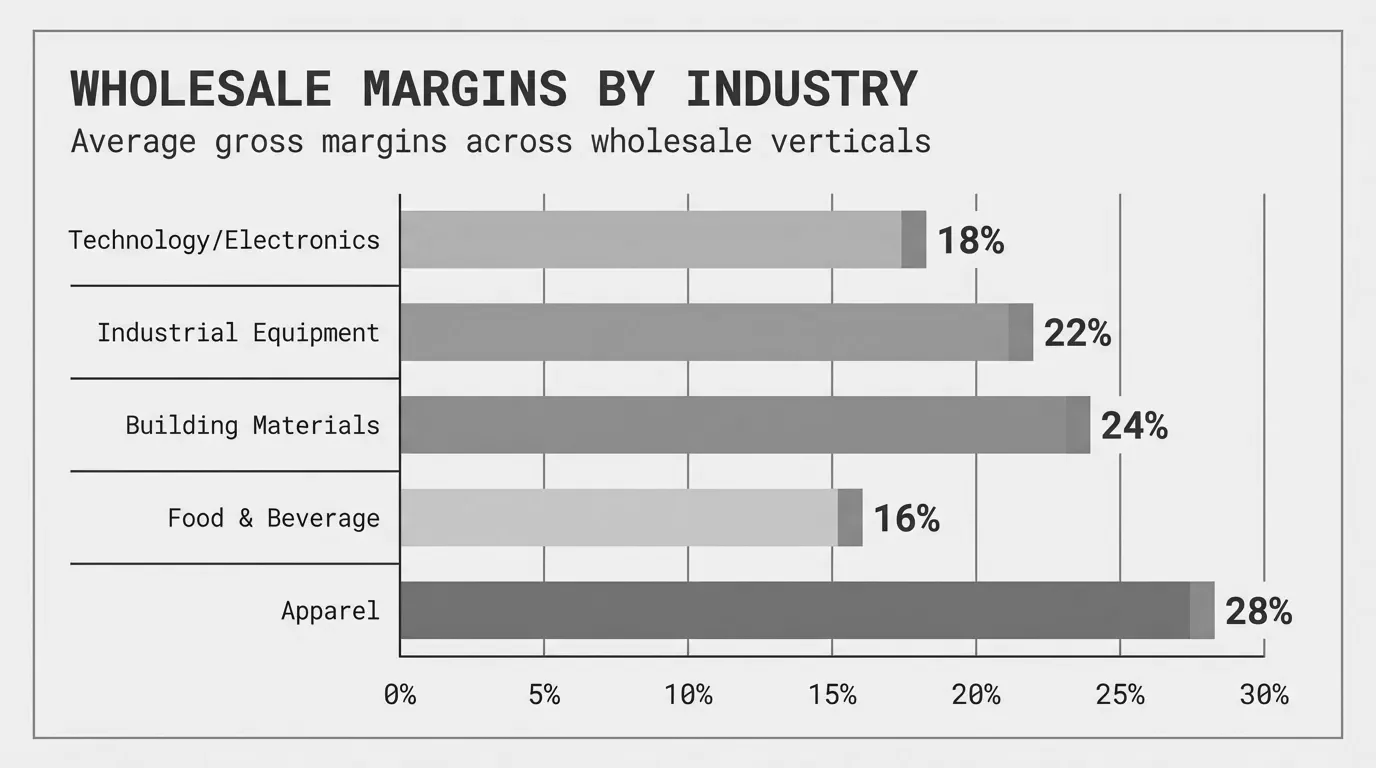
Wholesale Margins by Industry: The Benchmarks
Average margins tell you what's normal. They don't tell you what's possible. These benchmarks come from public company data, industry associations, and margin analysis across mid-market distributors.
| Industry | Gross Margin | Operating Margin | Net Margin | Typical Turns |
|---|---|---|---|---|
| Food/Grocery | 15-22% | 2-4% | 1-3% | 10-15x |
| Apparel/Textiles | 35-45% | 8-14% | 5-10% | 2-4x |
| Electronics | 18-28% | 4-8% | 2-5% | 5-8x |
| Industrial/MRO | 22-32% | 5-10% | 3-7% | 4-6x |
| Building Materials | 20-28% | 5-9% | 3-6% | 5-8x |
| Medical/Pharma | 25-35% | 6-12% | 4-8% | 4-6x |
| Specialty/Technical | 30-45% | 8-15% | 5-12% | 3-5x |
The pattern: commodity products with high competition run thin margins. Specialty products with technical requirements or regulatory complexity command premiums.
Food and Grocery Wholesale Margins
Food distribution operates on the thinnest margins of any wholesale vertical. Gross margins typically fall between 15% and 22%, with net margins of 1-3%.
Why so thin? Three reasons.
Perishability demands speed. You can't sit on inventory. Produce, dairy, and meat must move. This limits pricing flexibility and negotiating time.
Intense competition. Food distribution is mature with established players. Sysco, US Foods, and regional distributors compete aggressively. Price pressure is constant.
High volume, low margin math. The business model works through turns. A food distributor turning inventory 12-15 times per year at 18% gross margin generates decent returns on capital. The margin looks small, but the velocity matters.
| Food Subcategory | Typical Gross Margin |
|---|---|
| Produce | 12-18% |
| Dairy | 15-20% |
| Frozen | 18-24% |
| Dry Grocery | 16-22% |
| Specialty/Gourmet | 25-35% |
Food distributors make money through operational efficiency, not pricing power. The winners run tight logistics, minimize waste, and extract every rebate from suppliers.
Apparel and Textile Wholesale Margins
Apparel wholesalers sit at the opposite end of the spectrum. Gross margins of 35-45% are standard, with some specialty segments reaching 50% or higher.
The trade-off: lower inventory velocity. Fashion products turn 2-4 times per year. A sweater that doesn't sell in fall gets marked down or becomes dead inventory.
Brand matters. Wholesale margins increase with brand recognition. Licensed apparel or established brands command higher markups than commodity basics.
Seasonality creates risk. Fashion has windows. Buy wrong, and you're stuck with inventory that loses value daily. This risk justifies higher margins on what sells.
Private label changes the math. Distributors selling their own branded apparel can hit 50-65% gross margins by cutting out manufacturer markup. The risk shifts to the distributor, but so does the reward.
| Apparel Subcategory | Typical Gross Margin |
|---|---|
| Basic/Commodity | 25-35% |
| Fashion/Seasonal | 38-48% |
| Licensed/Branded | 40-52% |
| Private Label | 45-65% |
| Activewear/Athletic | 35-45% |
Successful apparel wholesalers excel at demand forecasting. Getting the buy right matters more than squeezing extra margin on individual items.
Electronics Wholesale Margins
Electronics distribution runs 18-28% gross margins, with significant variation by product type and brand relationship.
Authorized vs. unauthorized distribution. Authorized distributors get manufacturer support, co-op funds, and price protection. Margins are more stable. Unauthorized distributors buy opportunistically and face more risk.
Product lifecycle pressure. Electronics depreciate. A computer component loses value weekly as newer versions launch. This forces faster turns and limits margin flexibility.
Volume concentration. A few large electronics distributors (Arrow, Avnet, Ingram Micro) control significant market share. Smaller players compete in niches or on service.
| Electronics Subcategory | Typical Gross Margin |
|---|---|
| Components | 15-22% |
| Consumer Electronics | 12-20% |
| Enterprise/IT | 18-28% |
| Specialty/Industrial | 25-35% |
| Refurbished/Secondary | 30-50% |
Electronics margins have compressed over decades as information became transparent. Product specs are searchable. Prices are comparable. The distributors who maintain margin sell service and expertise, not just boxes.
Industrial and MRO Wholesale Margins
Industrial distribution and MRO (maintenance, repair, operations) supply runs 22-32% gross margins with 3-7% net.
This middle-of-the-pack margin comes from a balance of factors:
Product breadth requires expertise. An industrial distributor might stock 50,000 SKUs. Customers pay for the convenience of one-stop shopping and knowledgeable salespeople who can solve problems.
Long-tail SKUs carry margin. The top 20% of SKUs face price competition. The long tail (specialty fasteners, odd-size bearings, obscure gaskets) carries 40-60% margins because nobody else stocks them.
Relationships matter. Industrial buyers value reliability over price on mission-critical items. If the production line goes down waiting for parts, the cost dwarfs any price savings.
| Industrial Subcategory | Typical Gross Margin |
|---|---|
| Commodity/Fasteners | 18-25% |
| Bearings/Power Trans | 25-35% |
| Safety/PPE | 28-38% |
| Cutting Tools | 30-40% |
| Specialty/Technical | 35-50% |
Industrial distributors expand margins through value-added services: inventory management, technical support, custom kitting, and vendor-managed inventory programs. These services build switching costs and justify premium pricing.
Building Materials Wholesale Margins
Building materials distribution runs 20-28% gross margins, landing in the middle of the wholesale spectrum.
Commodity pressure on basics. Lumber, drywall, and standard hardware face transparent pricing. Builders compare quotes. The products are identical across distributors.
Specialty products carry premium. Architectural hardware, custom millwork, and specialty finishes support higher margins. Fewer competitors, more expertise required.
Logistics matter. Building materials are bulky. Delivery capability and jobsite service differentiate distributors more than price. A builder pays extra for reliable delivery that keeps crews productive.
| Building Materials Subcategory | Typical Gross Margin |
|---|---|
| Lumber/Commodity | 15-22% |
| Drywall/Insulation | 18-25% |
| Roofing | 22-30% |
| Plumbing/Electrical | 25-35% |
| Specialty/Architectural | 30-42% |
Building materials margins correlate with construction cycles. Tight supply during building booms allows better pricing. Overcapacity during slowdowns compresses margins industry-wide.
Gross Margin vs. Net Margin in Wholesale
The gap between gross and net margin reveals operating efficiency. Wholesale distribution typically shows 15-25 percentage points of erosion from gross to net.
Gross Margin = (Revenue - COGS) / Revenue
Operating Margin = (Revenue - COGS - Operating Expenses) / Revenue
Net Margin = (Revenue - All Costs) / Revenue
For a $50M distributor with 25% gross margin:
| Line Item | Amount | % of Revenue |
|---|---|---|
| Revenue | $50,000,000 | 100% |
| COGS | $37,500,000 | 75% |
| Gross Profit | $12,500,000 | 25% |
| Warehouse/Logistics | $3,000,000 | 6% |
| Sales/Marketing | $2,500,000 | 5% |
| G&A | $2,000,000 | 4% |
| Operating Profit | $5,000,000 | 10% |
| Interest/Taxes | $2,000,000 | 4% |
| Net Profit | $3,000,000 | 6% |
The squeeze from 25% gross to 6% net is normal. But the difference between 5% net and 8% net on $50M is $1.5M annually. That's where margin management pays off.
What Drives Wholesale Margin Differences
Within any industry, individual distributors vary by 10-15 margin points. Here's what separates the high-margin operators from those fighting for scraps.
Scale and Volume
Small wholesalers handling sporadic orders typically achieve gross margins of 15-25%. They lack purchasing power and spread fixed costs across limited volume.
Distributors with consistent daily orders expand margins to 25-35%. First-tier supplier pricing kicks in. Fixed costs spread across more transactions.
Large operations can achieve 30-50% gross margins through maximum supplier leverage and operational efficiency.
Inventory Turns
A product with 18% margin that turns 12 times per year generates better returns than a 35% margin product turning 3 times. GMROI (Gross Margin Return on Inventory Investment) captures this relationship.
GMROI = Gross Margin % x Inventory Turns| Product | Gross Margin | Turns | GMROI |
|---|---|---|---|
| A | 18% | 12x | 2.16 |
| B | 35% | 3x | 1.05 |
| C | 25% | 6x | 1.50 |
Product A generates twice the return on inventory investment despite having half the margin of Product B. This is why food distribution (thin margin, fast turns) can be as profitable as specialty distribution (fat margin, slow turns).
Higher inventory turnover also reduces carrying costs. The cost of holding inventory (warehousing, insurance, obsolescence, capital tied up) runs 15-30% of inventory value annually. Fast-turning inventory minimizes this drag.
Value-Added Services
Distributors who simply move boxes compete on price. Those who add services command premiums:
- Technical support: Helping customers select the right product, troubleshooting applications
- Inventory management: VMI programs, consignment inventory, automatic replenishment
- Custom services: Kitting, assembly, private labeling, custom packaging
- Logistics services: Same-day delivery, jobsite delivery, scheduled replenishment
Each service creates switching costs and justifies margin. A customer paying 5% more for inventory management and technical support often has lower total cost than buying cheap from a box-mover.
Product Mix Management
The easiest margin lever: sell more of what makes money.
Most distributors have products ranging from 5% margin (competitive commodities) to 60% margin (specialty items nobody else stocks). Shifting mix toward higher-margin products directly impacts blended margin.
| Scenario | Commodity Mix | Specialty Mix | Blended Margin |
|---|---|---|---|
| Current | 70% at 18% | 30% at 38% | 24% |
| Improved | 55% at 18% | 45% at 38% | 27% |
| Optimized | 40% at 18% | 60% at 38% | 30% |
Three points of margin on a $50M business is $1.5M. No additional revenue required.
The challenge: salespeople naturally gravitate toward what sells easily, which is often the low-margin commodity. Sales incentives that include margin contribution, not just revenue, shift behavior.
Cost-to-Serve Awareness
Two customers buying $200,000 at 25% gross margin can have wildly different profitability. One orders monthly in full truckloads, pays in 15 days, and handles their own receiving. The other orders weekly in small quantities, demands next-day delivery, takes 60 days to pay, and calls constantly.
Customer A might generate 15% net margin. Customer B might be underwater after cost-to-serve (order processing, freight, payment terms carrying cost, returns, support time).
Tracking cost-to-serve by customer reveals where margin actually lands. For a detailed methodology, see our guide on customer profitability analysis.
The Margin Leakage Problem
Wholesale distributors leak 2-5% of revenue through pricing inconsistencies. The sources:
- Unmonitored customer-specific pricing: Deals negotiated years ago at prices that no longer make sense
- Cost increases not passed through: Supplier costs rise; customer prices don't follow
- Discount stacking: Multiple discounts combine in ways nobody intended
- Off-invoice deductions: Rebates, chargebacks, freight claims erode realized price
For a $50M distributor, 3% margin leakage represents $1.5M annually. That's pure profit recovery, no additional sales required.
The fix requires tracking pocket margin, not just invoice margin. Pocket price shows what you collected after all deductions.
Pocket Price = Invoice Price - Rebates - Freight Claims - Returns - Payment Term Costs
Pocket Margin = (Pocket Price - COGS) / Pocket Price
Benchmarking Your Wholesale Margins
If you haven't done detailed margin analysis recently, start here:
- Calculate blended gross margin by product category. Know which categories carry the business and which drag it down.
- Calculate margin by customer segment. Your CRM tracks revenue by customer. Do you track margin?
- Track margin variance on similar transactions. Wide variance signals pricing problems.
- Calculate GMROI by product category. Factor in turns to see true capital efficiency.
- Benchmark against industry. Know whether you're above or below average.
What Top-Quartile Looks Like
Top-quartile wholesale distributors share characteristics regardless of industry:
- Gross margins 3-5 points above industry average through mix management and value-added services
- Operating expense ratio below 18%
- Net margins 2-3 points above industry average
- Inventory turns at or above industry benchmark
- Minimal margin variance across similar customers
For a mid-market industrial distributor, that means targeting 28-32% gross margin, 16-18% operating expense ratio, 6-8% net margin, and 5-6x inventory turns.
These aren't aspirational numbers. They're what disciplined operators achieve while competitors scrape by at half the profitability.
Where to Go Deeper
This overview covers the benchmarks. For detailed analysis methodology, see our complete guide to margin analysis. It covers gross margin, contribution margin, pocket margin, and how to find the 2-4 points of hidden margin most distributors leave on the table.
For industry-specific margin benchmarks in distribution verticals like electrical, HVAC, plumbing, and fasteners, see our post on distributor margins by industry.
Last updated: Invalid Date
Frequently Asked Questions

Want to analyze your entire product catalog?
Pryse automatically identifies margin leakage across thousands of SKUs. Upload your data and find hidden profit in 24 hours.
One-time $1,499 diagnostic. No subscription required.