What Is a Good Profit Margin for a Product? Benchmarks by Product Type
A good product profit margin ranges from 15% to 80% depending on product type and industry. See benchmarks for manufactured, distributed, and specialty products.
A good product profit margin depends on product type, industry, and whether you're measuring gross or net margin. For gross margin, 20% to 40% is typical for manufactured products, 15% to 35% for distributed products, and 40% to 80% for specialty or high-value products.
The question isn't whether your product margin is "good" in absolute terms. The question is whether it's good for your product category, cost structure, and market position—and whether that margin translates to overall business profitability.
Product Margin vs Company Margin
Before evaluating product margins, understand the distinction between product-level profitability and company-level profitability.
Product margin (also called gross margin or contribution margin)
(Product Price - Product COGS) / Product Price × 100This measures profitability before operating expenses. It tells you whether the product itself is priced appropriately relative to its direct costs. A product with 35% gross margin generates $0.35 in gross profit for every dollar of sales.
Company margin (net profit margin)
Net Income / Total Revenue × 100This measures overall business profitability after all expenses, including salaries, rent, marketing, and overhead. A company might have products averaging 35% gross margin but only achieve 6% net profit margin after operational costs.
The distinction matters because a "good" product margin must support not just the product's direct costs but the entire business's operational needs. A product with 25% gross margin might be excellent for a lean distributor running 4% operating expenses but inadequate for a manufacturer with 20% operating expenses.
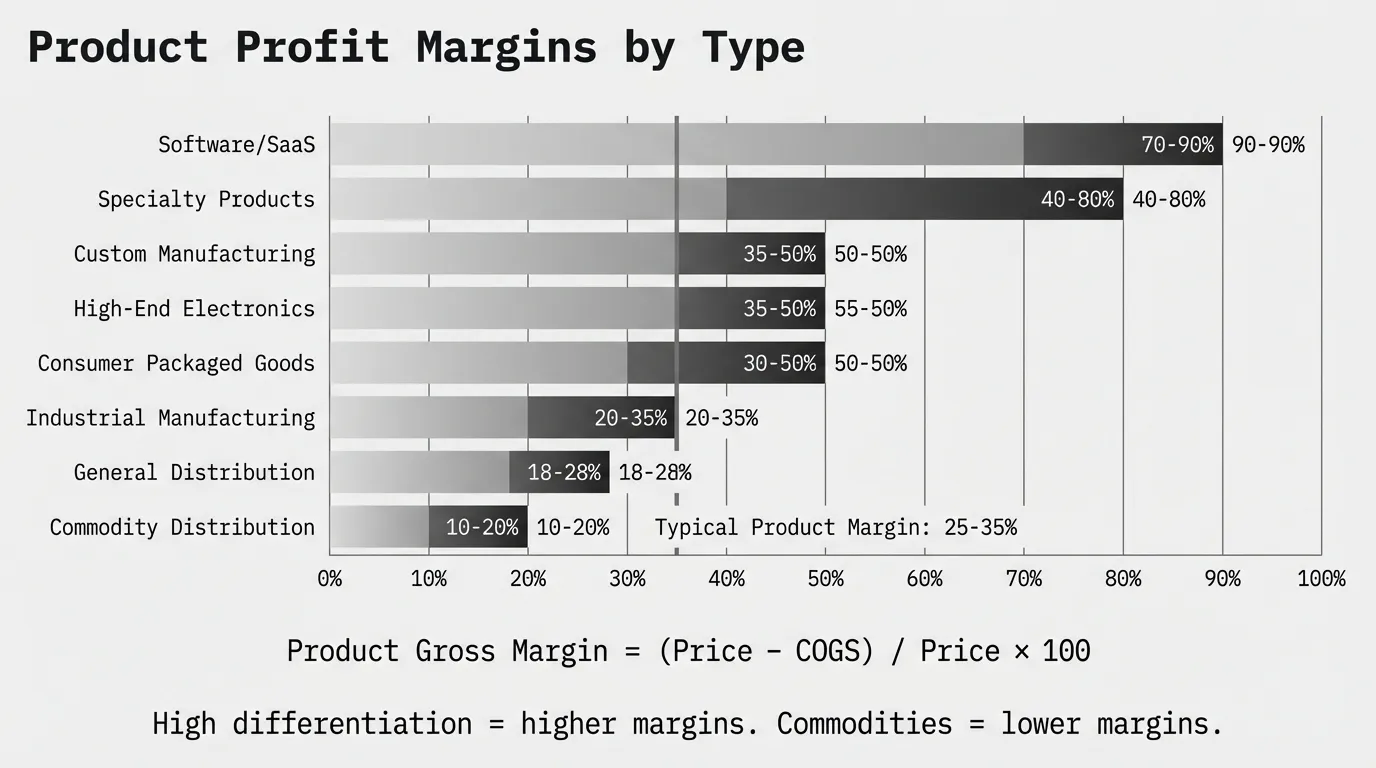
Good Product Profit Margin Benchmarks by Type
Product margins vary dramatically based on what you're selling and how much transformation or value-add you provide. Here's what the data shows:
| Product Type | Gross Margin Range | Notes | Source |
|---|---|---|---|
| Software / SaaS | 70-90%+ | Near-zero marginal cost per unit | Umbrex analysis |
| High-end electronics | 35-50% | Complex manufacturing, brand value | Umbrex |
| Consumer packaged goods | 30-50% | Volume manufacturing, brand positioning | Umbrex |
| Industrial manufacturing | 20-35% | Capital-intensive production | Umbrex |
| Grocery / retail | 15-30% | High-volume, low-touch | Umbrex |
| Commodity distribution | 10-25% | Limited differentiation, price sensitivity | Industry average |
| Specialty distribution | 25-40% | Technical expertise, value-added services | Industry average |
| Custom manufacturing | 35-50% | Low-volume, high-touch, engineering | Industry average |
Data compiled from Umbrex's gross margin analysis and industry benchmarking, updated February 2026.
The pattern is clear: products with higher differentiation, lower production costs relative to price, or more value-added services command higher margins. Products that compete on availability and price operate on thinner margins.
Product Margin Benchmarks for Distribution Companies
If you're distributing products (buying and reselling without significant transformation), your product margins depend on whether you're selling commodities or specialty items.
According to Vendavo's B2B margin research, manufacturers and wholesalers often target 15-20% gross margin on their products, while retailers aim for 20-50% depending on the product category.
Healthy product margins for distributors:
| Distribution Type | Typical Product Gross Margin | What Affects Margin |
|---|---|---|
| Commodity distribution | 10-20% | Low differentiation, high price transparency |
| General distribution | 18-28% | Mix of commodity and specialty items |
| Industrial distribution | 22-35% | Technical knowledge, application support |
| Specialty distribution | 30-45% | Deep expertise, limited competition |
For mid-market distributors handling thousands of SKUs, product margins vary widely within the same portfolio. According to Pollen Consulting Group's SKU profitability research, one retail client discovered that 23% of their SKUs generated 71% of total profit, while 40% of their catalog actively destroyed value.
This means your "average" product margin masks significant variance. You likely have:
- High-margin specialty products (35-50%) carrying the portfolio
- Mid-margin volume products (20-30%) generating cash flow
- Low-margin commodity products (10-20%) defending customer relationships
- Negative-margin products (below cost) that need repricing or elimination
How to interpret your product margins as a distributor:
| Your Product Gross Margin | What It Means |
|---|---|
| Below 15% | Commodity pricing—requires high volume or customer lock-in to justify |
| 15-25% | Acceptable for general distribution products |
| 25-35% | Strong for most distributed products |
| 35-50% | Excellent—indicates specialization or limited competition |
| Above 50% | Exceptional—check for underpricing or verify value justification |
According to Rysons' B2B margin guide, manufacturers and wholesalers often look to gain a 15-20% profit margin on their products, while retailers usually aim to make a profit between 20-50%.
Product Margin Benchmarks for Manufacturing Companies
If you're manufacturing products, your margin depends on product complexity, market position, production volume, and whether you're producing standard or custom items.
Healthy product margins for manufacturers:
| Manufacturing Type | Typical Product Gross Margin | What Drives Margin |
|---|---|---|
| Commodity manufacturing | 15-25% | Standardized products, price competition |
| General manufacturing | 25-35% | Mix of standard and engineered products |
| Industrial machinery | 32-40% | Complex products, application engineering |
| Custom manufacturing | 35-50% | Low-volume, high-touch, design work |
| Specialty/proprietary | 40-70% | Patents, unique technology, limited alternatives |
According to Wiss's contribution margin analysis, manufacturers should target contribution margins in the 30-40% range to cover operating expenses and generate acceptable net margins.
For mid-market manufacturers, here's how to interpret your product margins:
| Your Product Gross Margin | What It Means |
|---|---|
| Below 20% | Commodity pricing pressure or cost structure issues |
| 20-30% | Acceptable for volume manufacturing |
| 30-40% | Healthy for most manufacturing |
| 40-55% | Strong—indicates differentiation or niche market |
| Above 55% | Excellent—possible underpricing or check market position |
According to GSquared CFO's manufacturing margin guide, gross margin is an accounting construct, not an economic truth—it's directionally useful but structurally incomplete. It doesn't tell you which products actually deserve your capacity, capital, and management attention.
This means you need to look beyond gross margin to contribution margin (gross margin minus product-specific variable costs like freight, commissions, and tooling) to understand true product profitability.
E-commerce and Direct-to-Consumer Product Margins
If you're selling products online directly to consumers or businesses, margin expectations differ from traditional distribution and manufacturing.
According to TrueProfit's 2026 gross margin research based on analysis of more than 5,000 ecommerce stores, a gross profit margin in the 60-70% range is what makes profitable scaling possible. Here's what that breaks down to:
Healthy product margins for e-commerce:
| E-commerce Type | Typical Product Gross Margin | Notes |
|---|---|---|
| Dropshipping | 65-70% | No inventory holding, supplier handles fulfillment |
| Private label | 60-65% | Own-brand products with direct manufacturing |
| Print-on-demand | 50-80% | High-margin products like mugs, tote bags, apparel |
| Reselling branded products | 40-60% | Buying wholesale, selling retail |
According to the research, stores that want room to scale profitably should aim for around 60-70% gross margin. A 70%+ margin puts you in a great spot, usually coming from strong pricing power, while a 50-60% range can operate but scaling will feel tight.
When gross margins fall below 55%, growth becomes fragile, and scaling starts to rely heavily on volume, with even small increases in ad costs or fulfillment fees able to erase profitability.
For net margin, TrueProfit's net margin benchmarks show that overall approximately 10% is healthy, 10-20% is strong, and 20%+ signals real efficiency. For e-commerce specifically, dropshipping typically lands at 15-25% net margin, private label at 13-33%, and print-on-demand can reach 20-35%.
Factors That Shift What's "Good" for Your Product
Industry benchmarks are starting points, not targets. Several factors push your "good" product margin higher or lower:
Product Differentiation
Commodity products compete on price. If customers can buy the same product from five suppliers, your margin ceiling is low. Electrical wire, standard fasteners, or commodity chemicals typically operate at 10-20% gross margin.
Differentiated products command premiums. If your product has unique features, certifications, or performance characteristics, you can price higher. Specialty alloys, certified industrial equipment, or engineered components often achieve 30-50% margins.
Proprietary products own pricing power. If you're the only source—through patents, unique formulations, or exclusive technology—margins can reach 50-80%.
Value-Added Services
Products bundled with services earn higher margins. A distributor selling pumps at 18% margin can sell pump-plus-installation at 32% margin. A manufacturer selling bearings at 25% margin can sell bearing-plus-predictive-maintenance at 45% margin.
According to Vendavo's margin improvement research, bundling pricing can help differentiate offerings and improve profit margins by pairing high-margin items with lower-margin ones.
Technical expertise raises margin ceilings. Products requiring application engineering, specification support, or custom configuration justify higher margins than products sold off the shelf. The margin isn't just for the product—it's for the expertise.
Market Position and Competition
Market leaders command premium margins. The recognized brand in a category can price 10-20% higher than competitors for the same functional product. Market followers compete on price, compressing margins.
Local monopolies or limited competition change the math. If you're one of two suppliers in a region for a specialized product, margins expand. If you're one of twenty, margins compress.
Customer lock-in supports margins. Products with high switching costs (custom specifications, integrated systems, long certification cycles) maintain margins better than products customers can easily swap.
Production Volume and Scale
Low-volume custom products need high margins. If you're making five units with significant engineering and setup time, 40-50% gross margin might not cover costs. High-touch, low-volume products require 50%+ margins to be viable.
High-volume standard products operate on lower margins. If you're producing 10,000 identical units with automated processes, 20-25% margin can be profitable due to scale efficiency.
Cost Structure and Operational Efficiency
Your cost structure determines minimum viable margin. A manufacturer with 18% operating expenses needs higher product margins than one with 10% operating expenses. Product margin must cover not just COGS but contribute to company profitability.
Hidden costs erode effective margin. Freight, handling, returns, warranty claims, and inventory carrying costs reduce the margin that actually hits the bottom line. A product with 30% gross margin might deliver only 20% contribution margin after these costs.
According to CFO Pro Analytics' SKU profitability framework, a rolling SKU profitability model should track contribution margin, velocity efficiency, channel mix, true net price, trade spend, freight drag, 3PL overhead, spoilage, and inventory carrying cost at the SKU level, updated monthly.
Warning Signs Your Product Margin Is Too Low
A below-benchmark product margin usually points to specific problems:
1. Commodity pricing without volume to justify it. You're accepting 12% margin on a product that requires the same overhead as a 28% margin product. Unless volume is 3x higher, you're subsidizing this SKU.
2. Discounting that became permanent. A one-time customer concession at 18% margin became the standard price. You never revisited it. Now the product consistently underperforms.
3. Supplier cost increases not passed through. Your supplier raised prices 6% last year. You raised customer prices 2%. That's 4 points of margin compression that compounds annually.
4. Hidden costs eating margin. You think the product is at 26% margin, but after freight, handling, returns, and inventory carrying costs, it's actually 16%.
5. Product positioned as low-value. You're selling on price because you haven't communicated differentiation. Customers view it as a commodity even though it has value-added features.
6. Volume discounts that exceed cost savings. You're giving 15% volume discounts but only saving 3% in handling costs. The math doesn't work.
According to Revology Analytics' hidden SKU profitability research, many distributors are "data-rich but insights-poor"—they have transaction data but can't see which products actually produce cash and which destroy it.
The 2025 Revenue Growth Analytics Maturity Report found that 50% of organizations are stuck in a "Medium" analytics-maturity level, with a mere 2% achieving true excellence.
Warning Signs Your Product Margin Is Too High
High product margins aren't always good news:
1. You're pricing yourself out of the market. Margins 20+ points above competitors might mean you're leaving volume growth on the table. A product at 50% margin when competitors sell at 30% might be sacrificing market share you could profitably capture.
2. You're vulnerable to competition. Abnormally high margins attract competitors. If a new entrant can serve your customers at 35% margin when you're at 55%, you'll feel pricing pressure quickly.
3. Possible underpricing, paradoxically. If margins are very high with strong demand, you might be underpriced relative to value delivered. You could raise prices further without volume loss.
4. Low velocity hiding poor portfolio economics. A product with 60% margin but only 10 units sold annually might contribute less total profit than a product with 25% margin and 5,000 units sold.
According to Pollen Consulting's SKU analysis, profitability thresholds indicate that anything below 25% is typically marginal and requires justification through strategic value or strong velocity, while above 55% suggests possible underpricing or room to invest in growth.
High-Volume Low-Margin vs Low-Volume High-Margin
One of the fundamental product strategy questions: should you focus on high-margin specialty products or low-margin volume products?
According to Geneva Business School's margin analysis, the choice depends on your specific market position, production capacity, and customer relationships rather than being a one-size-fits-all decision.
High-volume, low-margin products:
- Require operational efficiency and scale
- Generate consistent cash flow
- Lower risk per transaction but higher execution risk
- Capital-intensive (inventory, logistics, automation)
- Price-sensitive customers, limited differentiation
Low-volume, high-margin products:
- Require customer relationships and expertise
- Generate lumpy revenue with high contribution per sale
- Higher risk per transaction but lower execution complexity
- Less capital-intensive but more labor-intensive
- Value-focused customers, limited price sensitivity
Most successful distribution and manufacturing companies operate a portfolio strategy: volume products for cash flow stability, specialty products for margin contribution. The mix depends on your capabilities and market position.
How to Evaluate Your Product Margins
A single product margin number doesn't tell you much. Here's how to make the evaluation meaningful:
1. Segment Product Margins by Category
Company-wide average margin hides what's happening underneath. Calculate margin by:
- Product category: Which categories drag down the average?
- Volume tier: Are high-volume products different from low-volume?
- Customer segment: Do different customers buy different margin products?
- Sales channel: Does e-commerce have different margin than direct sales?
- New vs existing products: Are newer products priced better?
A 28% overall product margin might be masking 45% margin on specialty products and 12% margin on commodity items. The insight is in the segmentation.
2. Track Contribution Margin, Not Just Gross Margin
Gross margin is revenue minus COGS. Contribution margin is revenue minus all variable costs directly attributable to the product:
Contribution Margin = Revenue - COGS - Freight - Commissions - Returns - Handling
A product with 30% gross margin might have only 22% contribution margin after freight, commissions, and handling costs. That's the margin that actually contributes to covering fixed costs and generating profit.
3. Compare to Profitability Thresholds
According to Extensiv's SKU profitability framework, use these thresholds:
| Contribution Margin | Action |
|---|---|
| Below 15% | Review pricing or discontinue unless strategic |
| 15-25% | Marginal—justify through velocity or customer value |
| 25-40% | Healthy—maintain and grow |
| 40-55% | Strong—invest in growth |
| Above 55% | Excellent—check for underpricing or defend position |
4. Calculate Margin × Velocity
High margin with low velocity might contribute less profit than moderate margin with high velocity.
Total contribution from a product = (Contribution margin %) × (Annual revenue from product)
A product with 50% margin and $20K annual revenue contributes $10K. A product with 25% margin and $100K annual revenue contributes $25K.
The second product is more valuable to your business despite lower margin.
5. Track Margin Trend, Not Just Level
A product whose margin declined from 32% to 22% over two years is more concerning than a stable 20%. Trend direction matters as much as absolute level.
If product margin is declining, find out why before benchmarking:
- Supplier costs rising faster than customer prices
- Competitive pressure forcing price concessions
- Product mix shifting to lower-margin variants
- Hidden costs accumulating
How Product Margins Connect to Business Margins
Understanding product margins is useful, but only if they translate to business profitability. Here's how they connect:
Gross margin (product-level) shows whether pricing and direct costs are healthy. Operating margin (business-level) shows whether your business model works at current scale. Net profit margin (business-level) shows the bottom line after everything.
A company with strong product margins (35% gross) but weak net margin (2%) has an operating expense problem. A company with weak product margins (18% gross) and weak net margin (1%) has a pricing or COGS problem.
Example for a $50M distributor:
| Scenario | Avg Product Gross Margin | Company Operating Margin | Company Net Margin | Diagnosis |
|---|---|---|---|---|
| Company A | 28% | 6% | 4% | Healthy—product margins support business |
| Company B | 28% | 2% | 1% | Operating expense problem—product margins are fine |
| Company C | 18% | 3% | 2% | Product pricing/COGS problem—margins too thin |
| Company D | 35% | 8% | 6% | Strong performance—excellent product margins |
This diagnostic approach tells you where to focus. Company B shouldn't waste time on product repricing—they need to address operating expenses. Company C needs to fix product pricing, supplier costs, or product mix.
Where Is Your Product Margin Going?
Knowing whether your product margin is "good" is useful context. But the more actionable question is: where is product margin leaking?
Most distribution and manufacturing companies have 3-7 percentage points of recoverable margin hiding in their product portfolios. It's in:
- Products priced years ago that never got reviewed
- Volume discounts that exceeded actual cost savings
- Freight and handling costs absorbed instead of charged
- Product mix shifts toward lower-margin SKUs
- Customer-specific pricing that outlived its justification
- Supplier cost increases not fully passed through
Finding this margin requires analyzing transactions at the product and customer level across thousands of SKUs. Excel becomes unwieldy when you're tracking margin variance across 10,000+ SKUs and 500+ customers.
That's what Pryse is built for. Upload your transaction data and see where your product margin actually goes in 24 hours, not 6 months. You'll see:
- Which products are below margin targets
- Where discounting is eroding margin
- Which customer-product combinations destroy value
- Where to focus repricing efforts for maximum impact
For a deeper look at margin analysis by industry and business type, see our complete guide to profit margins by industry. For understanding margin types and calculations, see our margin analysis guide.
Sources:
- Good Gross Profit Margins for Ecom in 2026 (Based on 5,000+ Stores) - TrueProfit
- What is a Good Net Profit Margin? The 2026 Benchmarks - TrueProfit
- Gross Margin by Product Analysis - Umbrex
- Industry Benchmarks of Gross, Net and Operating Profit Margins - Vena Solutions
- How to Improve Profit Margin in B2B - Vendavo
- SKU Profitability - Pollen Consulting Group
- SKU Productivity: Use This Metric To Improve SKU Profitability - Extensiv
- How to Build a Rolling SKU Profitability Model - CFO Pro Analytics
- Beyond Gross Margin: Calculating True Product Profitability in Manufacturing - GSquared CFO
- Understanding Contribution Margin in Manufacturing Operations - Wiss
- What are Margins in B2B Trade - Rysons
- High volume low margin or high margin low volume? - Geneva Business School
- How Hidden SKU Profitability Is Dragging Down Your Distribution Business - Revology Analytics
Last updated: February 24, 2026
Frequently Asked Questions

Want to analyze your entire product catalog?
Pryse automatically identifies margin leakage across thousands of SKUs. Upload your data and find hidden profit in 24 hours.
One-time $1,499 diagnostic. No subscription required.