Average Profit Margin for Manufacturing Industry: 2026 Benchmarks by Sector
The average manufacturing profit margin is 7-12% net and 25-35% gross. See detailed benchmarks for machinery, auto parts, food processing, chemicals, and more.
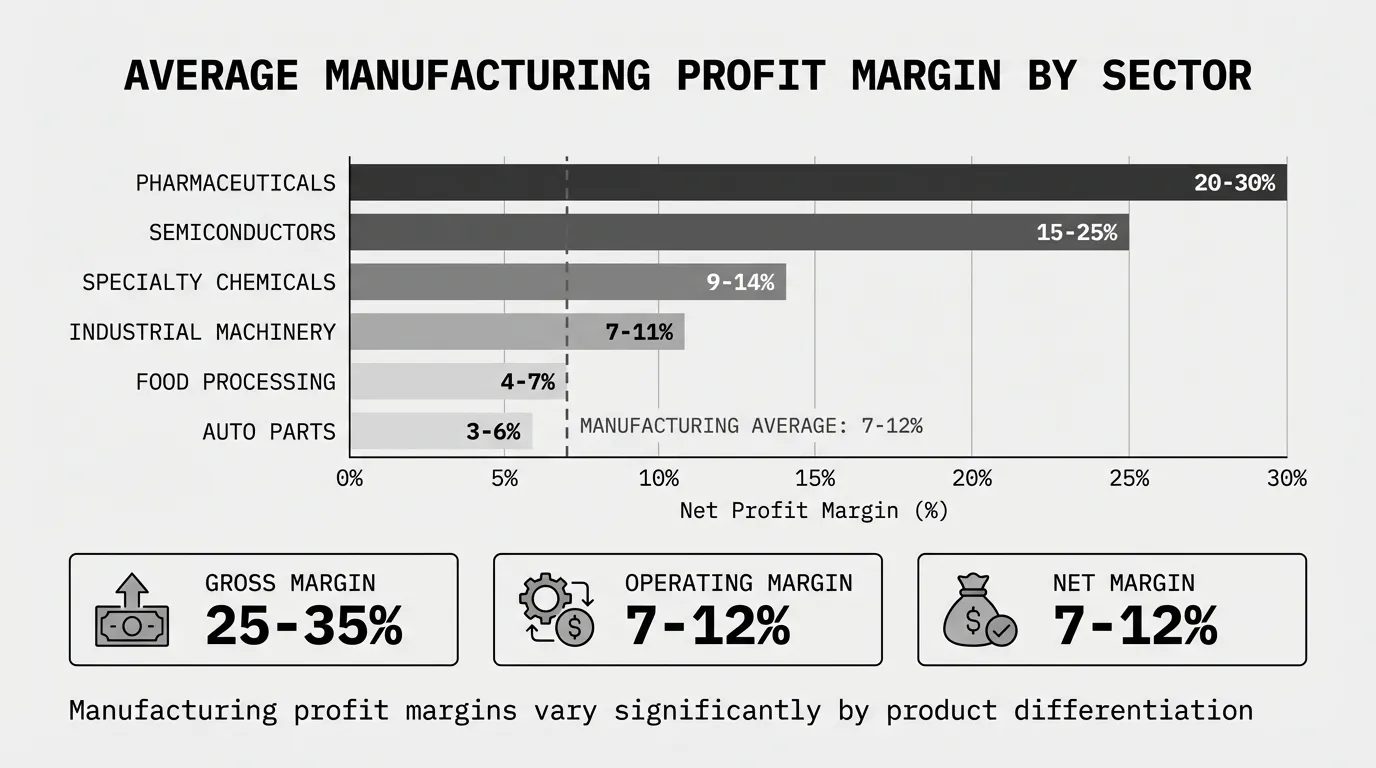
The average profit margin for the manufacturing industry is 7-12% for net profit margin and 25-35% for gross margin. But this masks significant variation. Auto parts manufacturers run 3-6% net margin. Specialty chemical manufacturers reach 10-14%. Industrial machinery sits in the middle at 7-11%.
Industry type, product differentiation, and operational efficiency explain most of the variation. Commodity manufacturers competing on price operate at the low end. Specialty manufacturers with proprietary products or technical expertise command the high end.
What Is the Average Profit Margin for Manufacturing?
According to Vena Solutions' industry benchmarking data, manufacturers typically aim for 25-35% gross margins and 5-10% net margins. NYU Stern's margin database (updated January 2026) shows similar patterns across public manufacturing companies.
The average manufacturing company spends 42% of revenue on material costs, which explains why margins are tighter than service-based industries that don't manufacture physical products.
Standard benchmarks by margin type:
| Margin Type | Manufacturing Average | Range |
|---|---|---|
| Gross Margin | 25-35% | 12-50% |
| Operating Margin | 7-12% | 5-22% |
| Net Profit Margin | 7-12% | 3-25% |
These averages combine all manufacturing types. Breaking down by sector reveals a clearer picture.
Average Manufacturing Profit Margin by Sector
Manufacturing isn't one industry. A semiconductor fabricator has little in common with a metal stamping shop. Here are the margins by major manufacturing sector:
| Manufacturing Sector | Gross Margin | Operating Margin | Net Margin | Source |
|---|---|---|---|---|
| Auto Parts | 12-18% | 4-8% | 3-6% | CSI Market Q3 2025 |
| Chemicals (Basic) | 22-28% | 8-12% | 5-8% | NYU Stern 2026 |
| Chemicals (Specialty) | 35-45% | 14-20% | 9-14% | NYU Stern 2026 |
| Electrical Equipment | 28-35% | 10-15% | 6-10% | Industry average |
| Food Processing | 16-20% | 6-10% | 4-7% | CSI Market 2022 |
| Industrial Machinery | 28-35% | 10-16% | 7-11% | Industry average |
| Metal Fabrication | 22-30% | 6-12% | 4-8% | Industry average |
| Pharmaceuticals | 65-75% | 20-30% | 20-30% | NYU Stern 2026 |
| Plastics & Rubber | 22-30% | 7-12% | 4-8% | Industry average |
| Semiconductors | 45-55% | 20-30% | 15-25% | NYU Stern 2026 |
Data compiled from NYU Stern margin database, CSI Market industry profitability data, and Vena Solutions benchmarking.
The pattern is clear: sectors producing differentiated, high-value products command higher margins. Sectors producing commodity or price-sensitive products run thinner.
Auto Parts Manufacturing Margins
Auto parts manufacturing shows some of the lowest margins in manufacturing. According to CSI Market's Q3 2025 data, the auto and truck parts industry operates with gross margins around 12-18%.
Bain & Company's automotive profitability analysis shows that OEM supplier margins declined to 3.9% in Q3 2025—down nearly 60% from their 2021 peak and below pre-Covid levels.
Why margins are thin:
- Intense pricing pressure from large OEMs
- Commodity-like products with limited differentiation
- High capital requirements for tooling and equipment
- Cyclical demand tied to vehicle production
- Material cost volatility (steel, aluminum, resins)
A $30M auto parts manufacturer stamping components for Tier 1 suppliers might achieve 15% gross margin and 4% net margin. Volume matters more than margin in this sector. Companies compete on cost, quality, and delivery reliability.
Food Processing & Manufacturing Margins
Food manufacturing operates on some of the tightest margins in manufacturing. According to CSI Market's food processing industry data, gross margins averaged 18.98% in Q1 2022, compared to 45.81% across all industries.
Net margins for food processing average 4-7%, with the most profitable food companies reaching 20-30%. The trailing twelve-month net profit margin was under 12% in 2022, but a 64-company dataset shows an average of 4%.
Why margins are constrained:
- High raw material costs and commodity inputs
- Price sensitivity from retailers and consumers
- Limited ability to differentiate basic products
- Regulatory compliance costs (FDA, USDA)
- Refrigeration and logistics costs
- Short shelf life creates waste
A $50M regional food processor might run 18% gross margin and 5% net margin. Scale helps because fixed costs spread over more units, but material costs remain a constant pressure.
Industrial Machinery Manufacturing Margins
Industrial machinery manufacturing achieves better margins than commodity sectors. The sector typically delivers gross margins of 28-35%, operating margins of 10-16%, and net margins of 7-11%.
According to CSI Market's industrial machinery profitability data, margins are healthier than auto parts or food processing due to product complexity and engineering value.
Why margins are moderate to strong:
- Custom engineering and application knowledge
- Longer sales cycles with negotiated pricing
- Aftermarket parts and service revenue
- Customer switching costs (training, integration)
- Complexity creates barriers to competition
A $75M industrial equipment manufacturer producing conveyor systems for manufacturing plants might run 32% gross margin and 12% operating margin. The product requires engineering, installation, and ongoing service—all margin opportunities beyond the base equipment sale.
Specialty vs. Commodity Manufacturing Margins
The biggest margin difference in manufacturing isn't sector-specific. It's whether you produce commodity products or specialty products.
Commodity Manufacturing
- Products: Standardized items where customers can easily switch suppliers
- Examples: Basic fasteners, commodity chemicals, standard metal stampings
- Gross margin: 18-25%
- Operating margin: 5-8%
- Net margin: 3-5%
- Strategy: Cost leadership, volume, operational efficiency
A $40M fastener manufacturer producing standard bolts competes almost entirely on price and delivery. Customers view the product as interchangeable. The only defense is being the low-cost producer.
Specialty Manufacturing
- Products: Differentiated items with technical barriers, IP, or unique capabilities
- Examples: Medical devices, aerospace components, specialty chemicals, precision instruments
- Gross margin: 38-50%
- Operating margin: 15-22%
- Net margin: 10-15%
- Strategy: Differentiation, technical expertise, customer intimacy
A $30M precision machining company serving the medical device industry runs 45% gross margin because qualification barriers, regulatory requirements, and tight tolerances prevent customers from switching to low-cost alternatives.
The margin gap between commodity and specialty isn't about working harder. It's about competitive dynamics and pricing power.
What Drives Manufacturing Profit Margins
Six factors explain most margin variation across manufacturing companies:
1. Capacity Utilization
Manufacturing has high fixed costs. Running at 90% capacity versus 60% changes unit economics dramatically.
A manufacturer with $3M in annual fixed costs (facility, equipment depreciation, salaried staff) producing 600,000 units at 60% utilization has a fixed cost per unit of $5.00. At 90% utilization producing 900,000 units, fixed cost per unit drops to $3.33.
Fixed cost per unit at 60% utilization: $3,000,000 / 600,000 = $5.00
Fixed cost per unit at 90% utilization: $3,000,000 / 900,000 = $3.33
Margin impact: $1.67 per unit
On a product selling at $25, that $1.67 difference represents nearly 7 percentage points of margin.
2. Material Costs
Manufacturing companies spend an average of 42% of revenue on materials. A 3% reduction in material costs improves net margin by roughly 1.3 percentage points.
Material cost leverage comes from:
- Supplier negotiation and volume consolidation
- Alternative sourcing (domestic vs. international)
- Substitute materials with lower cost
- Reducing scrap and waste in production
- Locking in prices through forward contracts
A $60M manufacturer spending $25M on materials (42%) who reduces material costs by 4% saves $1M—dropping straight to profit.
3. Product Mix
Not all products carry the same margin. A shift in what customers buy affects overall profitability even if individual product margins stay constant.
Example manufacturer portfolio:
| Product Line | Revenue Share | Gross Margin |
|---|---|---|
| Standard products | 50% | 28% |
| Custom products | 30% | 38% |
| Engineered solutions | 20% | 48% |
Blended gross margin: (0.50 × 28%) + (0.30 × 38%) + (0.20 × 48%) = 34%
If mix shifts to 60% standard, 25% custom, and 15% engineered due to sales incentives favoring volume:
New margin: (0.60 × 28%) + (0.25 × 38%) + (0.15 × 48%) = 33.5%
A half-point margin drop from mix alone. On $40M revenue, that's $200K in lost margin.
4. Labor Efficiency
Direct labor as a percentage of COGS varies by automation level:
| Manufacturing Type | Direct Labor % of COGS |
|---|---|
| Highly automated | 5-10% |
| Semi-automated | 15-25% |
| Labor-intensive | 30-50% |
For labor-intensive manufacturers, productivity directly impacts margins. A production line running 85 units per hour versus 100 units per hour has 15% higher labor cost per unit.
5. Scrap and Rework
Scrap and rework directly consume margin. A process running at 4% scrap means 4% of material cost is wasted. If materials are 45% of COGS and you eliminate half that scrap, you recover 0.9% of COGS.
Yield losses compound through multi-step processes. A five-step process running 97% yield at each step has overall yield of 0.97^5 = 85.9%. Improving each step to 98.5% raises overall yield to 92.7%—nearly 7 points of improvement.
6. Pricing Discipline
According to McKinsey's 2003 study "The Power of Pricing" published in McKinsey Quarterly, a 1% price improvement drives an 8% increase in operating profit for B2B companies.
For a manufacturer running 10% net margin, a 1% price improvement increases profit by 10%.
Common pricing failures that erode margins:
- Legacy pricing for customers whose volume declined
- Quoting standard prices for custom work
- Not passing through material cost increases
- Uniform pricing that ignores customer value
- Discounting to win orders without margin guardrails
A $28M metal fabrication company analyzed 2,400 quotes over a year. Win rates were nearly identical at full price (31%) versus discounted 10%+ (34%). They had been giving away margin without winning more business.
How to Calculate Manufacturing Profit Margins
Manufacturing companies should track three margin types:
Gross Margin Calculation
Gross Margin = (Revenue - COGS) / Revenue × 100For manufacturers, COGS includes:
- Raw materials and components
- Direct labor (production workers)
- Manufacturing overhead (factory rent, equipment depreciation, utilities)
Example: $10M revenue manufacturer with $6.5M COGS
Gross Margin = ($10M - $6.5M) / $10M × 100 = 35%Operating Margin Calculation
Operating Margin = (Gross Profit - Operating Expenses) / Revenue × 100Operating expenses include sales, marketing, admin, R&D, and non-production overhead.
Same manufacturer with 35% gross margin ($3.5M gross profit) and $2M operating expenses:
Operating Margin = ($3.5M - $2M) / $10M × 100 = 15%Net Profit Margin Calculation
Net Margin = Net Profit / Revenue × 100Net profit is what remains after all costs including interest and taxes.
Same manufacturer with 15% operating margin ($1.5M operating profit), $300K interest, and $300K taxes leaves $900K net profit:
Net Margin = $900K / $10M × 100 = 9%Comparing Your Manufacturing Margins to Benchmarks
A single profit margin number doesn't tell you much. Here's how to make the comparison meaningful:
1. Use the Right Benchmark
Don't compare a food processor to a pharmaceutical manufacturer. Both are "manufacturing" but operate in completely different competitive environments.
Compare to:
- Direct competitors in your specific sub-sector
- Companies at similar scale ($20M vs. $500M matters)
- Similar product complexity (commodity vs. specialty)
- Similar business model (contract manufacturing vs. branded products)
2. Segment Your Analysis
Company-wide margin hides what's happening underneath. Calculate margin by:
- Product category: Which categories drag down the average?
- Customer segment: Are your biggest customers your most profitable?
- Production line: Do different facilities perform differently?
- Order type: Standard orders versus custom versus rush orders
A 4% overall net margin might mask 8% margin on specialty products and 1% margin on commodity items. The insight is in the segmentation.
3. Track Trend, Not Just Level
A net profit margin that declined from 9% to 4% over three years is more concerning than a stable 3%. Trend direction matters as much as absolute level.
If margin is declining, find out why before benchmarking. Common causes:
- Material cost increases not passed through
- Product mix shift toward lower-margin items
- Uncontrolled discounting by sales
- Operational inefficiency increasing costs
- Customer concentration at low prices
4. Understand the Why Behind Your Number
A 6% net margin might be strong for a commodity manufacturer but weak for a specialty manufacturer. Context matters more than the number itself.
Ask:
- Are we priced appropriately for the value we deliver?
- Is our cost structure competitive for our volume?
- Are we operating efficiently relative to our product complexity?
- Have we invested appropriately in capacity for our demand?
How Manufacturers Can Improve Profit Margins
Margin improvement falls into two categories: get more for what you sell (pricing) and spend less to make it (costs).
Pricing Strategies
Pass through input cost increases systematically. Material costs change. Manufacturers who track changes and adjust prices maintain margins. Those who don't erode them.
Create a formal process: track key input costs monthly, set thresholds that trigger price reviews (5% change triggers review), communicate increases to customers with data supporting the change.
Implement value-based pricing for differentiated products. Cost-plus pricing leaves money on the table when customers value your product beyond production cost. An engineered solution saving a customer $100K annually is worth more than cost-plus 25%.
Price for services separately. Engineering support, technical service, rapid prototyping, inventory management, and quality documentation all have value. Pricing them separately captures margin that bundled pricing gives away.
Establish pricing guardrails. Define minimum acceptable margins by product category. Require approval for exceptions. Track exceptions and patterns. A manufacturer allowing 50 "exception" deals per quarter at below-target margins has a pricing process problem.
Cost Strategies
Optimize capacity utilization. Fill unused capacity with profitable volume. This might mean entering new markets, adding customers in adjacent industries, or offering contract manufacturing services.
Reduce BOM costs through sourcing. Review supplier contracts, consolidate purchases for volume leverage, evaluate alternative materials, consider geographic sourcing options. A 3% reduction in material costs at 50% material content means 1.5% margin improvement.
Attack scrap and rework root causes. Track defects by type, source, and cost. Apply 80/20 rule: a few causes usually drive most waste. A $22M plastics manufacturer found 65% of scrap came from three mold issues. Fixing those reduced scrap from 5.2% to 2.8%.
Automate where the math works. Calculate payback on automation using fully-loaded labor costs including benefits, turnover, training, and supervision. A $180K automation investment replacing $75K in annual labor cost pays back in under three years.
Manage product portfolio actively. SKU rationalization identifies products that lose money, consume capacity, and distract from profitable items. A typical SKU analysis reveals 20-30% of products generating minimal or negative contribution.
See our complete guide to margin analysis for detailed methods on product and customer profitability analysis.
Where Is Your Manufacturing Margin Going?
Knowing whether your profit margin is "good" compared to industry average is useful context. But the more actionable question is: where is margin leaking in your business?
Most manufacturers have 2-5 percentage points of recoverable margin hiding in transaction data:
- Discounts that were supposed to be one-time but became permanent
- Customer-specific pricing that hasn't been reviewed in years
- Cost increases that weren't fully passed through
- Product mix shifts toward lower-margin items
- High-touch service provided to low-margin accounts
- Freight and handling absorption not billed back
Finding this margin requires analyzing transactions at the line-item level across products, customers, and time periods. For manufacturers with thousands of SKUs and hundreds of customers, Excel becomes unwieldy.
That's what Pryse is built for. Upload your transaction data and see where your margin actually goes in 24 hours, not 6 months.
For more manufacturing-specific margin strategies, see our manufacturer profit margin guide and complete guide to profit margins by industry.
Last updated: February 24, 2026
Frequently Asked Questions

Want to analyze your entire product catalog?
Pryse automatically identifies margin leakage across thousands of SKUs. Upload your data and find hidden profit in 24 hours.
One-time $1,499 diagnostic. No subscription required.