Small Business Profit Margin by Industry: 2026 Benchmarks and Data
See actual profit margin data by industry for small businesses. Retail averages 3-7%, professional services 12-20%, and restaurants 3-5%.
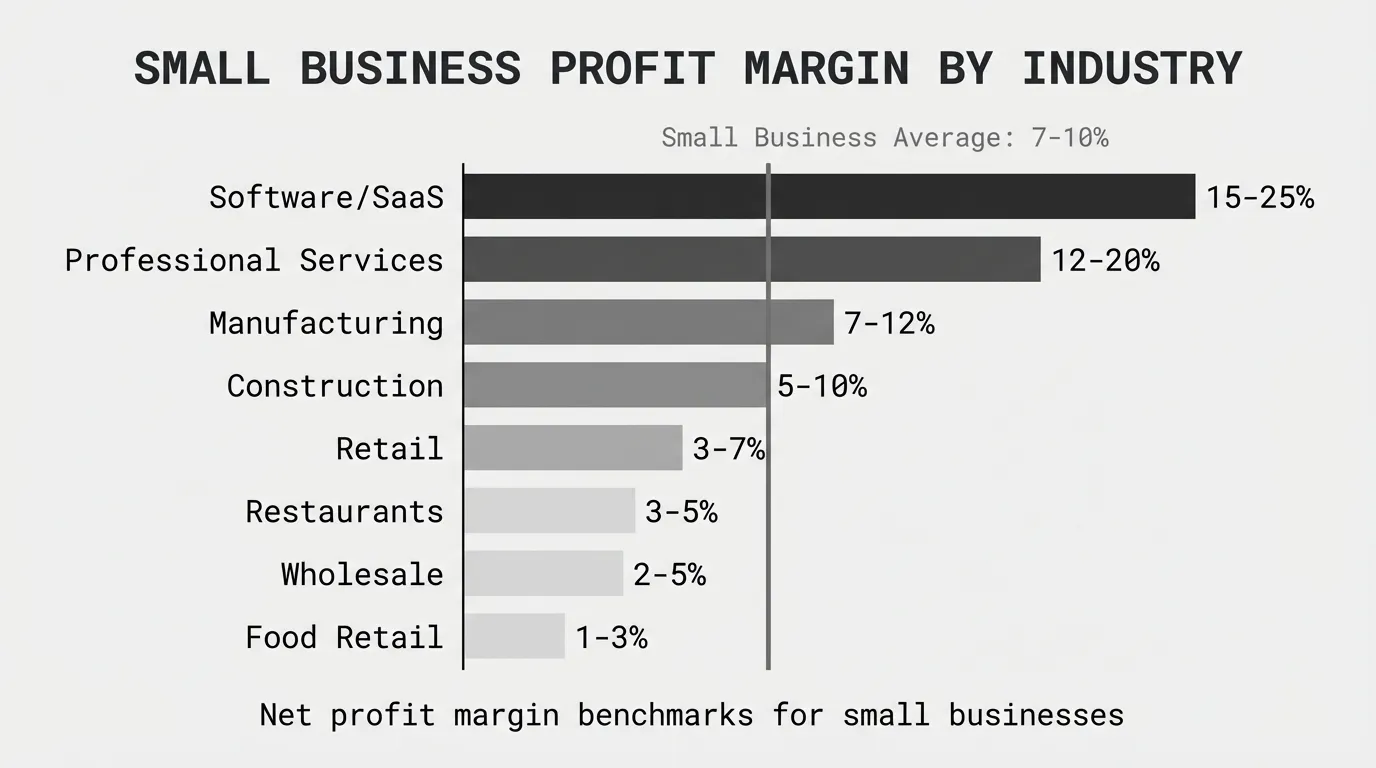
Small business profit margins vary dramatically by industry. Professional services average 12% to 20% net profit margin. Retail averages 3% to 7%. Restaurants average 3% to 5%. Manufacturing averages 7% to 12%. Understanding these benchmarks tells you whether your business performs well for your industry.
According to Vena Solutions' 2026 analysis, the average net profit margin for small businesses ranges between 7% and 10%. But this average masks huge variation—a 5% margin that's strong for a restaurant is weak for a consulting firm.
The Margin Types That Matter
Before comparing your business to industry benchmarks, clarify which margin you're measuring:
Gross Profit Margin
Gross Margin = (Revenue - COGS) / Revenue × 100This measures product or service profitability before operating expenses. According to FullRatio's 2026 industry analysis, the average gross profit margin across all industries is 36.56%.
Net Profit Margin
Net Profit Margin = Net Income / Revenue × 100This measures bottom-line profitability after all expenses. FullRatio's data shows the average net profit margin across industries is 8.54%. When people ask about profit margins, they usually mean this number.
Operating Margin
Operating Margin = (Revenue - COGS - Operating Expenses) / Revenue × 100This measures profitability after operating expenses but before interest and taxes. It tells you whether your business model works at current scale.
Small Business Profit Margin by Industry (2026 Data)
Here's actual profit margin data by industry for small businesses, compiled from Vena Solutions, FullRatio, NYU Stern, and TrueProfit's 2026 research:
| Industry | Gross Margin | Net Margin | What's "Good" | Source |
|---|---|---|---|---|
| Professional Services | ||||
| Accounting/Tax Services | 60-75% | 18-24% | Above 20% | Industry avg |
| Legal Services | 55-70% | 15-20% | Above 18% | Industry avg |
| Consulting/Advisory | 60-75% | 15-20% | Above 18% | Industry avg |
| Software/SaaS | 70-85% | 15-25% | Above 20% | Industry avg |
| Real Estate Services | 50-70% | 15-20% | Above 18% | Industry avg |
| Medical/Healthcare | 45-60% | 12-18% | Above 15% | Industry avg |
| General Professional Services | 50-70% | 12-20% | Above 15% | TrueProfit |
| Retail & E-commerce | ||||
| E-commerce (high-ticket) | 45-55% | 8-15% | Above 12% | Industry avg |
| E-commerce (general) | 35-45% | 5-10% | Above 8% | Industry avg |
| Specialty Retail | 35-45% | 5-10% | Above 8% | Industry avg |
| General Retail | 32% | 4.6% | Above 6% | FullRatio |
| Electronics Retail | 25% | 5.6% | Above 7% | FullRatio |
| Liquor Stores | 25-35% | 15-20% | Above 18% | Industry avg |
| Food & Hospitality | ||||
| Restaurants (full-service) | 25-35% | 3-5% | Above 5% | Industry avg |
| Restaurants (quick-service) | 30-40% | 6-9% | Above 8% | Industry avg |
| Cafes/Coffee Shops | 25-35% | 3-6% | Above 5% | Industry avg |
| Food Retail/Grocery | 18-25% | 1-3% | Above 2% | Industry avg |
| Catering | 30-40% | 7-12% | Above 10% | Industry avg |
| Manufacturing & Construction | ||||
| Custom/Specialty Manufacturing | 35-50% | 10-18% | Above 15% | Industry avg |
| General Manufacturing | 25-35% | 7-12% | Above 10% | TrueProfit |
| Food/Beverage Manufacturing | 20-30% | 5-8% | Above 6% | Industry avg |
| Computer Services Manufacturing | 24% | 4.2% | Above 6% | FullRatio |
| Engineering/Construction | 14% | 3% | Above 5% | FullRatio |
| Construction/Contracting | 20-30% | 5-10% | Above 8% | Industry avg |
| Distribution & Wholesale | ||||
| Wholesale Distribution | 15-25% | 2-5% | Above 4% | Industry avg |
| Industrial Distribution | 22-30% | 3-7% | Above 5% | Industry avg |
| Food Distribution | 13-18% | 0.5-2% | Above 1.5% | Industry avg |
| Services | ||||
| Cleaning Services | 40-55% | 15-31% | Above 20% | Industry avg |
| Landscaping/Lawn Care | 35-50% | 10-14% | Above 12% | Industry avg |
| Marketing/Advertising | 45-60% | 10-15% | Above 12% | Industry avg |
| Design/Creative Services | 50-65% | 12-18% | Above 15% | Industry avg |
This table combines data from multiple 2026 sources to show both average performance and what constitutes "good" performance for each industry.
Industries with the Highest Profit Margins
Professional services dominate the high-margin end. Here's why:
According to TrueProfit's 2026 analysis of high-margin small businesses, the most profitable industries share common traits: minimal COGS, recurring revenue models, no inventory costs, and high scalability without proportional cost increases.
Top 5 highest-margin industries for small businesses:
-
Accounting/Tax Services (18-24% net margin): Low COGS, recurring revenue from annual tax work, high hourly billing rates, minimal overhead beyond staff and software.
-
Software/SaaS (15-25% net margin): After initial development costs, marginal cost per customer is near zero. Recurring subscription revenue and high scalability.
-
Legal Services (15-20% net margin): Specialized expertise commands premium rates. COGS is mostly labor. Recurring clients in business law and estate planning.
-
Liquor Stores (15-20% net margin): High markup on alcohol, inventory that doesn't spoil quickly, relatively low operational complexity, and steady demand.
-
Consulting/Advisory (15-20% net margin): Selling expertise and time, not products. No inventory, minimal overhead, high hourly rates for specialized knowledge.
All five industries benefit from either extremely low COGS (services) or high markup capability (liquor). Small businesses in these sectors that run below 15% net margin likely have pricing problems or operational inefficiency.
Industries with the Lowest Profit Margins
Some industries structurally operate at thin margins:
Bottom 5 lowest-margin industries for small businesses:
-
Food Distribution (0.5-2% net margin): Commodity products, intense price competition, high inventory costs, tight supplier and customer relationships limit pricing power.
-
Grocery/Food Retail (1-3% net margin): Perishable inventory, shrinkage, intense local competition, low switching costs for customers, and thin markup on staples.
-
Engineering/Construction (3% net margin according to FullRatio): Project-based revenue, labor and material cost volatility, intense bidding competition, and thin profit built into winning bids.
-
Restaurants - Full Service (3-5% net margin): High labor costs, food waste, rent in high-traffic locations, intense competition, and price sensitivity from customers.
-
General Retail (4.6% net margin according to FullRatio): Inventory costs, rent in retail locations, price competition from e-commerce and big-box stores, and shrinkage.
These industries succeed on volume, operational efficiency, and tight cost control—not margin expansion. A food distributor at 1.5% net margin isn't failing. That's the business model.
Why Profit Margins Vary So Much Between Industries
Industry profit margins aren't random. They're driven by specific structural factors:
Cost of Goods Sold (COGS) Structure
Low COGS = high margins. Professional services have COGS of 20-40% (mostly labor). That leaves 60-80% gross margin. Retail has COGS of 65-75% (inventory purchases). That leaves 25-35% gross margin.
A consulting firm starts with 65% gross margin before paying overhead. A retailer starts with 30%. Both might have similar operating expenses as a percentage of revenue. The consultant ends at 18% net margin; the retailer ends at 5%.
Inventory and Working Capital Requirements
No inventory = better margins. Service businesses don't carry inventory. Capital goes into growth, not stock. Product businesses tie up cash in inventory that might sit for 60-120 days before selling.
This affects margin in two ways: carrying costs (storage, insurance, shrinkage) reduce profit, and capital constraints limit growth opportunities.
Price Competition and Differentiation
Commodity products = compressed margins. Food distribution moves branded products that customers can buy from multiple suppliers. Price is the main differentiator. Margins compress to commodity levels.
Specialized professional services sell unique expertise. Customers can't easily substitute. Pricing power allows margin expansion.
Scalability and Marginal Costs
Digital scales cheaply; physical scales expensively. A software company can serve customer #1,000 at nearly the same marginal cost as customer #100. A restaurant serving customer #1,000 requires more staff, kitchen capacity, and seating.
Industries with low marginal costs (software, consulting, digital media) maintain high margins at scale. Industries with high marginal costs (food service, retail, manufacturing) see margins compress as they grow unless they improve operational efficiency proportionally.
Regulatory and Compliance Costs
Regulated industries have margin pressure. Healthcare services face compliance costs, malpractice insurance, and licensing requirements that eat margin. Restaurants face health inspections, liquor licensing, and labor regulations.
According to research, industries with heavy regulation typically run 3-5 percentage points lower net margins than similar unregulated industries, holding other factors constant.
How Small Business Size Affects Profit Margins
Size matters. Larger small businesses typically achieve better margins than smaller ones in the same industry.
According to Vena Solutions' research, businesses under $1M in revenue often accept lower margins to fund growth. Businesses at $5M+ can optimize for profitability.
Margin progression by revenue size (typical patterns):
| Revenue Range | Typical Net Margin | Why |
|---|---|---|
| Under $500K | 3-5% | Fixed costs consume revenue; limited buying power |
| $500K-$1M | 5-8% | Better cost absorption; still growing |
| $1M-$5M | 7-12% | Scale efficiencies emerge; supplier leverage improves |
| $5M-$20M | 10-15% | Full operational efficiency; strong supplier terms |
| Above $20M | 12-18% | Maximum scale benefits; category leadership |
This pattern applies within industries. A $500K accounting firm might achieve 12% net margin. A $5M accounting firm in the same market might hit 20%. The difference is cost absorption, staff utilization, and operational maturity.
Small Business vs. Large Company Margins
Small businesses typically run lower profit margins than large companies in the same industry. The gap ranges from 2 to 5 percentage points depending on the industry.
Why large companies achieve better margins:
-
Supplier bargaining power: A $100M distributor negotiates better terms than a $5M distributor, reducing COGS by 3-8 percentage points.
-
Economies of scale: Fixed costs (warehouse, software, overhead) spread across more revenue. Per-unit costs decline.
-
Operational efficiency: Large companies invest in automation, systems, and process optimization. Small businesses rely on manual processes.
-
Brand pricing power: Established brands command premium prices or win more deals without heavy discounting.
-
Access to capital: Lower cost of capital for debt and expansion allows faster growth and better cash flow management.
For context, large retailers like Walmart and Target achieve 3-5% net margins at massive scale. Small retailers average 3-7%, which seems comparable. But large retailers operate on higher absolute revenue, so 3% net margin on $600B in revenue produces far more profit than 7% on $2M.
Small businesses competing with large companies in the same market need operational efficiency and differentiation to maintain healthy margins.
Geographic Impact on Small Business Profit Margins
Location affects profit margins through two channels: cost structure and pricing power.
High-cost markets compress margins unless you can price accordingly:
A service business in San Francisco pays 2-3x more for rent and labor than the same business in Indianapolis. If both charge similar rates, the San Francisco business runs tighter margins. If the San Francisco business can charge premium rates, margins equalize.
Local competition density matters:
Markets with limited competition allow margin expansion. A specialty retailer in a small city with no local competitors can maintain 10% net margin. The same retailer in a major metro competing with five similar stores might run at 5%.
Regional price sensitivity varies:
High-income areas tolerate premium pricing better than low-income areas. A landscaping company in an affluent suburb can charge 30% more than one in a working-class area, achieving better margins even with similar costs.
Business Model Differences Within Industries
Industry benchmarks are starting points. Business model choices shift your target margin up or down within that industry.
Service Model Variations
Recurring revenue vs. one-time projects:
A marketing agency on monthly retainers achieves 15-20% net margin. The same agency selling one-time projects achieves 8-12%. Recurring revenue reduces customer acquisition costs and improves cash flow predictability.
Productized services vs. custom work:
A web design agency offering productized packages ("$5K starter website, $15K professional, $30K enterprise") achieves better margins than one quoting custom for every project. Standardization reduces scope creep and improves delivery efficiency.
Product Business Variations
Private label vs. reselling branded products:
A retailer selling private-label products achieves 8-12% net margin. The same retailer selling only third-party brands achieves 4-7%. Private label captures more value and reduces price competition.
Direct-to-consumer vs. wholesale:
A small manufacturer selling direct to consumers achieves 12-18% net margin. The same manufacturer selling through distributors achieves 7-10%. Direct sales capture the distributor's margin but require marketing and fulfillment capabilities.
Value-Added Services
Businesses offering installation, customization, training, or ongoing support should command 3-7 percentage points higher net margins than pure product sellers.
A distributor just moving boxes should hit 3-5% net margin. A distributor providing technical support, inventory management, and custom kitting should hit 6-10%. If you're providing value-adds but your margin matches commodity distribution, you're underpriced.
Warning Signs Your Margin Is Too Low for Your Industry
If your profit margin is below industry benchmarks, specific problems are usually responsible:
1. Pricing below market rates. You're competing on price because you haven't differentiated on value. Customers choose you because you're cheapest, not because you're best. That's not sustainable.
2. Untracked discounting. You give away margin to close deals. Each discount feels small (5% here, 10% there), but they compound. You think your average margin is 25%; it's actually 18%.
3. Product or service mix drift. You're selling more low-margin offerings over time. Maybe sales pushes them because they're easier to sell. Maybe customers demand them. Overall margin declines even though no individual transaction looks bad.
4. Cost increases not passed through. Supplier costs went up 6% last year. Your prices went up 2%. That's 4 percentage points of margin erosion. Three years of this pattern destroys profitability.
5. Operational inefficiency. Your gross margin looks healthy (30%), but your net margin is weak (3%). The problem isn't pricing—it's operating expense. Too many employees for revenue level, expensive tools you don't fully use, or inefficient processes.
According to McKinsey's 2003 study "The Power of Pricing" published in McKinsey Quarterly, a 1% price improvement drives an 8% increase in operating profit for the average B2B company. For a small business operating at 7-10% net margin, a 1-2% margin leak represents a 10-20% reduction in profitability.
Fixing margin problems isn't about incremental improvements. It's about survival.
How to Use Industry Benchmarks Correctly
Industry profit margin data is useful context. But applying it correctly requires more than comparing a single number.
1. Match Your Specific Sub-Industry
"Retail" is too broad. Electronics retail operates at different margins than specialty retail. Food retail is different from both.
Find the most specific benchmark available. A $2M specialty coffee roaster should compare to specialty food manufacturing (8-12% net margin), not general manufacturing (7-12%).
2. Segment Your Own Margin Analysis
Company-wide margin hides what's happening underneath. Calculate margin by:
- Product or service category: Which offerings drag down your average?
- Customer segment: Are your biggest customers your most profitable?
- Sales channel: Does your e-commerce channel have different margins than in-person sales?
- Time period: Is margin trending up, down, or flat over the past 12-36 months?
A 6% overall net margin might be masking 12% on specialty services and 2% on commodity products. The insight is in the segmentation.
3. Compare to Direct Local Competitors
Industry-wide data is useful, but your direct competitors matter more. A coffee shop in a small town shouldn't compare to coffee shops in Manhattan, even though both are "restaurants."
Find 3-5 businesses in your specific niche and geographic area. If they're public companies or share financial information, analyze their margins. That's your real benchmark.
4. Track Trend Direction, Not Just Level
A net profit margin that declined from 10% to 4% over three years is more concerning than a stable 3%. Trend direction tells you whether you're solving the right problems.
If margin is declining, diagnose why before comparing to benchmarks. You might be chasing the wrong metric.
5. Understand the Trade-Off Between Growth and Margin
High-growth businesses often accept lower margins temporarily. If you're investing heavily in sales, marketing, and infrastructure, you might run at 5% net margin while competitors hit 10%.
That's acceptable if growth is working. It's a problem if you're sacrificing margin without gaining revenue.
Where to Find Your Margin Leakage
Knowing whether your profit margin is good for your industry provides context. But the more actionable question is: where is your margin leaking?
Most small businesses with complex operations have 2-5 percentage points of recoverable margin hiding in their data. It's in:
- Discounts that were supposed to be temporary but became permanent
- Shipping and handling charges that should be billed but aren't
- Customer-specific pricing that hasn't been reviewed in 2-3 years
- Product mix shifts toward lower-margin items over time
- Cost increases that were only partially passed through to customers
- High-touch service provided to low-margin accounts
Finding this margin requires analyzing transactions, customers, and products systematically. For small businesses with dozens of products, hundreds of customers, and thousands of transactions, Excel becomes unwieldy. The analysis that should take a day takes weeks—so it doesn't happen.
For businesses in the $500K-$20M range managing complex product catalogs, customer pricing, or multi-channel operations, margin analysis needs to be fast and visual. That's what Pryse is built for—upload your transaction data and see where margin goes in 24 hours, not 6 months.
For broader industry benchmarks beyond small businesses, see our complete guide to profit margins by industry. For general guidance on evaluating your margin, see what is a good profit margin.
Last updated: February 22, 2026
Frequently Asked Questions

Want to analyze your entire product catalog?
Pryse automatically identifies margin leakage across thousands of SKUs. Upload your data and find hidden profit in 24 hours.
One-time $1,499 diagnostic. No subscription required.